African Journal of
Agricultural Research

  • Abbreviation: Afr. J. Agric. Res.
  • Language: English
  • ISSN: 1991-637X
  • DOI: 10.5897/AJAR
  • Start Year: 2006
  • Published Articles: 6865

Full Length Research Paper

Evaluation of DSSAT model for sprinkler irrigated potato: A case study of Northeast Algeria

Rabia Malkia
  • Rabia Malkia
  • Agricultural Water Management Laboratory, National High School of Agronomy, El Harrach, Algiers, Algeria.
  • Google Scholar
Tarik Hartani
  • Tarik Hartani
  • Agricultural Water Management Laboratory, National High School of Agronomy, El Harrach, Algiers, Algeria.
  • Google Scholar
Farida Dechmi
  • Farida Dechmi
  • Soil and Irrigation Department (EEAD-CSIC Associated Unit), Agrifood Research and Technology Centre of Aragón, Avda. Montañana 930, 50059 Zaragoza, Spain.
  • Google Scholar


  •  Received: 19 April 2015
  •  Accepted: 17 February 2016
  •  Published: 21 July 2016

 ABSTRACT

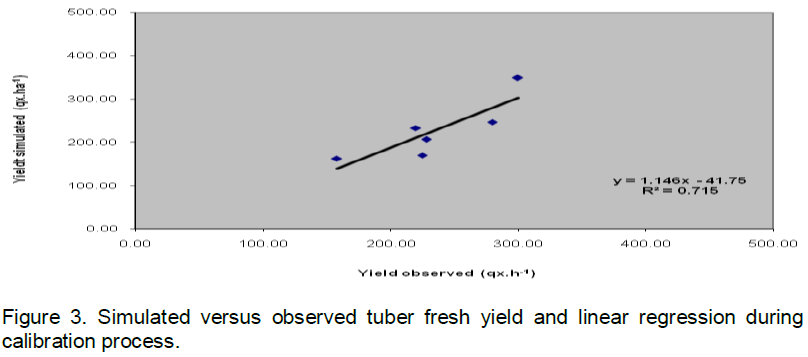
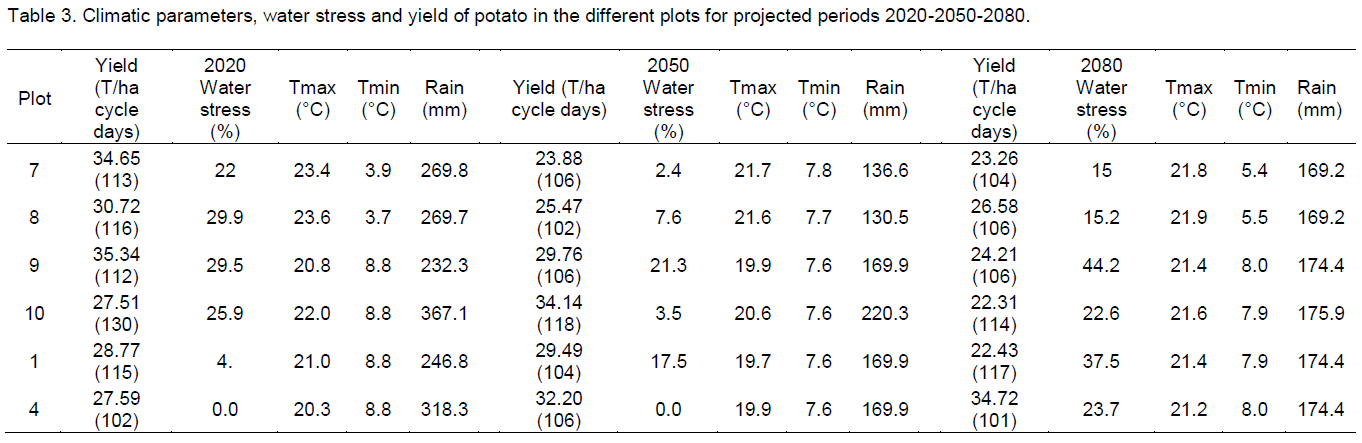
This study was conducted in order to evaluate the performance of potato crop in two major irrigation schemes situated in the Northeast of Algeria. This area is characterized by alluvial soil texture, very fine clay, a very flat topography, and a typical Mediterranean climate. This was done to guide farmers on any changes to their crop management to improve the yields of potato crops. The model SUBSTOR-potato (Decision Support System for Agrotechnology Transfer, DSSAT 4.5) was calibrated and validated for two cropping seasons 2008-2009 and 2009-2010, in order to estimate yields. The calibration of the model required the combination of genetic coefficients that characterize the phenology and morphology of this culture. The model performance was evaluated from statistical coefficients (R², root mean square error (RMSE), and BIAS). The results appear to be satisfactory (R²=0.715, RMSE=34.52 qx/ha, BIAS=-7.34). The observed yield is 254.33 qx/ha and the estimated one is 238.77 qx/ha. There is a positive impact of climate change generated by the model weatherman on yields of potato particular for 2050. This indicates the model using possibility because it improves the results of farmer’s strategies over multiple years.

Key words: SUBSTOR-potato, calibration, simulation, statistical coefficients, Algeria.


 INTRODUCTION

The Mediterranean region seems to be particularly affected by climate change. The warming is projected to be greater than the global average, with also a large percent reduction of precipitation and an increase in its inter-annual variability (Giorgi, 2006). A pronounced decrease in precipitation over the Mediterranean is expected (Tanasijevic et al., 2014). Algeria, who belongs to the southern areas, faces a water stress which is a threat to the sustainable development of irrigated agriculture.
 
Potatoes have a dominant place in the diets of people in Algeria and according to the local statistics, this crop is in the fifth place in the agricultural production with two leading varieties Desiree and Spunta (MADR, 2010). However, the large area that is put into potato production each year requires full irrigation in order to meet the crop water requirements, especially during the most sensitive growth stages. The annual production approaches 2.8 million tons and the cultivated area was 161873 hectares with a resulting yield of 17.3 tons per hectare (MADR, 2010). This value is clearly too low if compared to those of the developed countries or South American’s (40 and 25 tons per hectare, respectively).
 
In these conditions, optimal scheduling of water application in the framework of "future climate change impacts on freshwater resources and their management" should be improved (Kundzewicz et al., 2008). Progress in understanding is conditioned by adequate availability of observation data, which calls for enhancement of monitoring endeavors worldwide, addressing the challenges posed by projected climate change. One way to meet this objective is to use a crop-model that simulates crop yield under different soil-climate conditions and crop management practices (Stastna et al., 2010).
 
Crop models can be useful tools for managers in the irrigated areas with different agroecological conditions to improve the sustainability of agricultural systems. Many authors, namely Hoogenboom (2003) and Ritchie et al. (1995) applied Decision Support System for Agrotechnology Transfer (DSSAT) model to optimize land use and water allocation to crops at plot level. Moreover, Medany (2006) and Abdrobbo et al. (2010) applied it in Egypt and stated that DSSAT predicts increases in yields. However, no similar work has been conducted elsewhere in the south Mediterranean.
 
The objectives of this study were to calibrate and validate the DSSAT model for potato (variety Desiree) in the Bounamoussa and Guelma irrigation district, Northern Eastern Algeria. The conclusions should provide valuable information to water managers and potato producers on the future challenges due to climate change.


 MATERIALS AND METHODS

Description of the study area
 
The study area is located in the Northeast of Algeria (Figure 1) and includes two irrigation districts: the Bounamoussa irrigation district and Guelma irrigation district (36°46´and 36°49´ N; 7°43´and 7°49´ E, respectively). The total equipped areas of the Bounamoussa irrigation district is about 16500 ha, while in Guelma irrigation district, it is about 6000 ha (ONID, 2010). The irrigation water is supplied by the Cheffia and Hammam Dabbagh dams, respectively. The climate is Mediterranean characterized by two periods; a rainy period from September to April and a dry and hot period from May to August. The minimum and maximum daily air temperatures range between 22.6 and 12.2°C, respectively, while the annual average precipitation, relative humidity, and wind speed are 686 mm, 75%, and 3 km day-1, respectively (FAO, 2006). The soil has a sedimentary formation which is dominated by clay.
 
Both irrigation districts are equipped with sprinkler irrigation system to irrigate mainly vegetable crops with dominance of tomato in Bounamoussa and potatoes in Guelma. For performing their crop irrigation management, the majority of farmers appreciate the soil moisture by touching the soil and its color appearance. This technique is very well controlled by farmers especially for clay soil texture. Some farmers use corn (Zea maize) as an indicating plant for hydric-stress to adequately assess the irrigation requirements. The average seasonal irrigation dose is about 6940 m3 ha-1 in Bounamoussa and 7000 m3 ha-1 in Guelma (Guemraoui and Chabaca, 2005). The potato yield recorded in the  study  areas  (with different types of soils) varied between 15.8 and 30.0 t ha-1 in 2009.
 
Model description
 
For this study, the SUBSTOR potato model (Simulate Underground Bulking Storage Organs) included in DSSAT 4.5 was used to evaluate its performance for the variety Desiree in the study area using data from six representative types of soils (Table 1). The model describes daily phonological development and growth in response to environmental factors (soils, weather, and management). DSSAT uses the Ritchie model to calculate crop evaporation and transpiration and to update the soil water balance on a daily basis as a function of the water transfer processes affecting the soil profile (precipitation, irrigation, transpiration, soil evaporation, runoff, and drainage) (Ritchie, 1998). The growth stages simulated by the DSSAT SUBSTOR include sprout germination, emergence, tuber initiation, maturity, and harvest. The model includes five cultivar specific coefficients (G2, G3, P2, TC, and PD) that control the tuber initialisation, the leaf area development, and the tuber growth rate. These coefficients determine the crop responses to the management and the environmental factors, and their level of performance (Hunt et al., 1993). G2 (cm2 m-2 d-1) is the leaf area development rate and G3 (g m-2 d-1) is the tuber growth rate. P2 and TC unitless coefficients correspond to the effect of photoperiod and temperature sensitiveness. P2 takes values ​​between 0 and 1, where lower values ​​are assigned for late cultivations, those developing with fewer hours of daily radiation. TC is the temperature value above which the tuber initiation is inhibited. PD is a dimensionless coefficient that describes to what extent the cultivar is determinate. Output data files provide a detailed description of tuber yield and the above ground biomass as well as information about soil reserves of available water and nitrogen. The model simulates physiological crop responses (phonology and growth throughout the season). More additional information about the model is provided by using the DSSAT model.
 
Model input data
 
The required input data includes daily weather data (maximum and minimum air temperature, solar radiation, precipitation, relative humidity, and wind speed), soil data (field capacity, wilting point, depth, bulk density, rooting preference coefficients, runoff, radiation reflection coefficients, initial soil water, and nitrogen content for each soil layer), and crop management practices (sowing date and dates and amounts of irrigation and N fertilization). The meteorological input data considered in the study (2009 and 2010), were recorded by two meteorological stations located in Bounamousa (36°49´N, 7°49´W, 4 m altitude) and Guelma (36°28´N, 7°28´W, 227 m altitude).
 
Some of the soil’s data belonging to the six representative types of soils considered were taken from the National Agency of Hydraulic Resource database (Table 1). The total nitrogen was estimated from the carbon/Nitrogen (C/N) ratio. The drained upper limit (field capacity), lower limit (wilting point), soil water content at saturation, and soil rooting preference function for each layer were calculated by the algorithm included in DSSAT, based on input of measured soil characteristics (layer thickness and depth, clay, silt, coarse, and organic fractions C). Permanent wilting point (PWP) and field capacity (FC) were determined from soil texture by DSSAT 4.5 model. The soil albedo, drainage rate, and soil run-off curve number were set as 0.09, 0.4, and 76 for Guelma and 0.09, 0.05, and 61 for Bounamoussa, respectively. The potato management data were the same for all soils types, including planting date (February 01), harvest date (July 01), planting density (6.5 plants m-2), row  spacing (75 cm), irrigation (100 mm in Guelma and 80 mm in Bounamoussa), fertilizer application before planting (15.15.15, 18 quintals ha-1), and chemical applications (various products).


Model calibration and validation
 
The SUBSTOR model calibration and validation processes were performed for the Desiree potato variety. The calibration process consists of adjusting the genetic coefficient values (G2, G3, P2, PD, and TC) considering the six types of soils and the 2009 input data. The validation process consists of a comparison between observed and simulated tuber yield using the observed meteorological data of 2010. For both processes, the model runs were performed with water and nitrogen balance simulation switched “on,” using FAO 56 method for the evapotranspiration calculation. In this study, only the potato tuber yield was used as an evaluation parameter using the following statistical criteria: (i) linear regression and coefficient of determination (R2) between simulated and observed potato tuber yield; (ii) the root mean square error (RMSE) of these variables, and (iii) BIAS. The R2 represents the percentage of the variance in the measured data explained by the simulated data. The BIAS measures the average difference between measured and simulated values. If on the 0 average the model under-estimates, then the BIAS is positive and conversely if the model over-estimates. The optimal value of BIAS is 0.0.  The RMSE is equal to the sum of the variance of the modeled values and the square of the BIAS. The smaller the RMSE, the better the performance of the model. A RMSE value of 0.0 represents a perfect simulation of the observed potato tuber yield. The calibration objectives for potato tuber yield were to maximize R2 and to minimize the absolute value of BIAS and RMSE.
 
 
Climate change
 
The daily observed climate parameters (2006-2011), needed to manage a future climate by applying a weatherman model that is integrated in DSSAT, were collected nearby the National Office of Meteorology (Figure 2). The lack of solar radiation data was filled by the estimation of this parameter by applying the CROPWAT 8.0 model.


 RESULTS AND DISCUSSION

Model evaluation
 
After the iterative process of calibration, the best derived genetic coefficients were G2=2000, G3=22.5, G4=0.2, PD=0.7, P2=0.4, and TC=17. These coefficients are constants in the model and are used to quantify differences in development’s responses between potato cultivars. The comparison between simulated and observed yield is presented in Figure 3. Results indicated a significant correlation between observed and simulated values  (R2  = 0.71). The measured yield was 23.5 t ha-1 and the simulated one was 22.8 t ha-1 with a coefficient of variation (CV) of 0.21 and 0.30, respectively. The statistics evaluation associated with the average error between observed and simulated values ​​of the six plots presents RMSE and BIAS values of 3.45 t ha-1 and -7.34, respectively. These results are analogous to those indicated by Pereira et al. (2008) in Brazil (Itararé IAC-5986 cultivar), Medany (2006) Valour cultivar, Abdrabbo et al. (2010) in Egypt (Valour and Desiree cultivar), and Daccache et al. (2011) in England’s humid climate (Bintje cultivar). For this author, the differences expressed as a percentage between the simulated and observed mean yields were very small (1 to 3%). Medany (2006) found that there is no difference between observed and predicted data and concluded that SUBSTOR-Potato crop model can be used successfully in Egypt. 
 
The simulation performed with the adjusted genetic parameter using the 2008 data indicated that the Plot 7 was the only plot that presents the lowest crop yield because of water stresses observed during the growing season (Table 2). This was due to the inadequate irrigation management by the farmer. Simulation results indicate also a nitrogen deficit for all plots throughout the vegetative stages and especially during tuber formation until maturity. This had got a negative effect on potato tuber yield that are close to the national average production of potato (22.6 t/ha). Tuber fresh weight was peaked at 150th day after planting for all plots except plot 7 which the tuber fresh yield was reached at 130th day due to water deficit. The tops weight is obtained for the six plots between 60 and 90th day of the vegetative stages. The maximum simulated leaf area index (LAI) is 0.75 and 2.5, corresponding respectively to plot number 7 and 10 for the 60 and 80th day of the vegetative stages (Figure 4). These results were derived by the SUBSTOR model after its calibration.
 
The validation process was based on independent sets of field data corresponding to 2009 (Figure 5). Results indicate that the correlation between measured and simulated yield was better during the validation process (R2 = 0.73) than during the calibration (R2 = 0.71). The comparison between the measured and calculated yield of fresh tubers showed a significant correlation with average values of BIAS and RMSE of -7.34/23.33 and 34.52/43.59 quintals ha-1, respectively for model's calibration and validation.
 
Climate change
 
Table 3 provides information about the future yields evolution (2020-2050-2080) simulated with DSSAT4.5 according to climatic  changes  (minimum  and  maximum temperature and average cumulative rainfall) (Figure 6)  and water stress during the vegetative stages for all the plots in the study area, without taking into account the evolution of the CO2 and maintaining a constant agricultural crop management.
 
The results show essentially:
 
(1) Increased yields as compared to 2009.
(2) Falling yields in 2080 compared to 2020 for all plots except plot 5, which recorded an increase due essentially to the lack of water stress and probably to the spring warmed climate.
(3) 2050 appears to be the most stable year from the point of view of the climatic parameters and yields.
(4) A shortening of the growth period related to the increase of the minimum and maximum temperatures.


The results obtained for 2080 appear to be encouraging in terms of yield estimation, despite longer vegetation period and slightly higher temperatures. Many explanations are possible to discuss the results. In Algeria, potato is cultivated during three seasons (autumn, winter, spring/ summer). The main problem in the production of potatoes during the second season is the germination’s delay. The minimum temperature after planting is the major factor for the success of germination (Table 3). The change of planting date is necessary to avoid low temperature period and reduce the growth cycle ensuring good performance.


 CONCLUSION

In this study, an adjustment of the genetic co-efficient of SUBSTOR-potato model was proposed for Desiree potato variety under Mediterranean climate. The comparison between measured and estimated tuber fresh yield showed a significant correlation with average values of BIAS and RMSE of -7.34/-12.42 and 34.52/51.41, respectively for both calibration and validation processes and enables interesting applications for potato production. Since the amount of water during irrigation was the same for the different types of soil, the model indicated an irrigation water deficit in one plot. The analysis of the performed simulations indicated also some nitrogen management deficit. Possible potato management improvements are presented. The results suggest that it is necessary to change the date of planting to avoid low temperatures and increase yield.
 
This study highlights the impact of climate change on future yields of potato in the North of Algeria, after integration of daily data linked to climate over a period of more than five years in the model DSSAT 4.5. It is also important to note that taking into account other factors affecting performance, including weeds, diseases, pests, and soil salinity would be very useful in the improvement of the reliability of the results.


 CONFLICT OF INTERESTS

The authors have not declared any conflict of interests.


 REFERENCES

Abdrabbo MAA, Khalil AA, Hassanien MKK, Abou-Hadid AF (2010). Sensitivity of potato yield to climate change. J. Appl. Sci. Res. 6:751-755.


Daccache A, Weatherhead EK, Stalham MA, Knox JW (2011). Impact of climate on irrigated potato production in a humid climate. Agric. For. Meteorol. 151:1641-1653.
Crossref


FAO (2006). Climwat 2.0 for CROPWAT. FAO Irrigation and Drainage Paper 49.


Giorgi F (2006). Climate changes hot-spots, Geophys. Res. Lett. 33:L08707.
Crossref


Hoogenboom G (2003). Decision Support System for Agrotechnology Transfer Version 4.0, volume 1: Overview. International consortium for Agricultural Systems Applications, University of Hawai.


Hunt LA, Pararajasingham S, Jones JW, Hoogenboom G, Imamura DT, Ogoshi RM (1993). GENCLAC: Software to facilate the use of crop models for analyzing field experiments. Agron. J. 85:1090-1094.
Crossref


Kundzewicz ZW, Mata LJ, Arnell NW, Döll P, Jimenez B, Miller K, Okii T, Åžen Z, Shiklomanov I (2008). The implications of projected climate change for freshwater resources and their management. Hydrol. Sci. J. 53:3-10.
Crossref


Guemraoui M, Chabaca MN (2005). Gestion des grands périmètres d'irrigation: l'expérience algérienne. Mohamed Salah Bachta. Les instruments économiques et la modernisation des périmètres irrigués, Kairouan, Tunisie. Cirad, 14p. < Cirad-00193633>


MADR (2010). Ministry of Agriculture and rural development. Statistiques agricoles de 2002 à 2010. M.A.D.R., Alger.


Medany M (2006). Assessment of the impact of climate change on adaptation on potato production. Agricultural Research Center. Final Report.


ONID (2010). Office Nationale de l'Irrigation et du Drainage. Evolution des superficies irriguées des périmètres d'irrigation. O.N.I.D., Alger.


Pereira AB, Nilson Augusto VN, Ramos VJ, Pereira AR (2008). Potato potential yield based on climatic elements and cultivar characteristics. Bragantia Campinas 67:327-334.
Crossref


Ritchie J (1998). Soil water balance and plant water stress. In Understanding options of agricultural production, eds. Dordrecht, The Netherlands: Kluwer Academic Publishers and International Consortium for Agricultural Systems Applications pp. 41-53.
Crossref


Ritchie J, Griffin TS, Johnson BS (1995). SUBSTOR Functional model of potato growth, development, and yield. In Modeling and parameterization of the soil-plant-Atmosphere System: A comparison of potato Growth Models, pp. 401-434.


Stastna M, Toman F, Dufková J (2010). Usage of SUBSTOR model in potato yield prediction. Agric. Water Manage. 97:286-290.
Crossref


Tanasijevic L, Todorovic M, Pereira LS, Pizzigalli C, Lionello P (2014). Impacts of climate change on olive crop evapotranspiration and irrigation requirements in the Mediterranean region. Agric. Water Manage. 144:54-68.
Crossref


          */?>