Optimization of the use of agricultural inputs and the efficient management of the wheat crop can increase the yield potential per unit area. Thus, the objective of this study was to evaluate the agronomic performance of a wheat cultivar in function of different spacing and sowing densities in two agricultural years. The experiment was performed during the 2010 and 2011 agricultural years. The experimental design was a randomized complete block design in a factorial 3 x 4. The first factor was comprised of three spacings (13, 17 and 21 cm between rows), and the second factor consisted of four sowing densities (200, 300, 400 and 500 viable seeds m2). The results obtained showed that the lowest densities evaluated (200 and 300 seeds m2) promoted greater number of spikelets per ear, length of ears, number of grains in 10 ears and weight of one hundred grains, as well as, a smaller number of unviable tillers per m2. The shortest spacings evaluated (13 and 17 cm) promoted greater mass of spikes per m2 and greater accumulation of dry mass of plants. The grain yield and hectoliter weight were not influenced by the density and spacing. The yield was higher in the year, 2011 as compared to 2010.
Wheat (Triticum aestivum L.) is one of the most important and most consumed cereals in the world. With an estimated global production of 730 million tons for the 2016/2017 crop year (CONAB, 2017), wheat grain is produced mainly for human consumption, and its processing that generates by-products are also used in animal production.
In Brazil, production reached approximately 6.56 million tons in that same agricultural year, which did not meet the national demand of this grain. However, the country has the potential to reach higher levels of production to supply the domestic consumption market. Since the beginning of the 1980s, Paraná has been the leading agricultural producer of this cereal, contributing 50% of its national production in the last harvest (CONAB, 2017).
The increase in yield potential under tillage conditions has been of fundamental importance for Brazil to reach self-sufficiency in the production of this cereal (Silveira et al., 2010). The increase of wheat crop productivity depends on a set of strategies aimed at greater utilization of the area and the field conditions in which it is submitted.
In addition, the cultural management that results in the increase of the number of tiller can effectively contribute to the achievement of higher yields of the crop (Valério et al., 2009), because the density of sowing can provide a better balance of yield components, especially due to the difference in tillering capacity of the cultivars, resulting in better yield (Silveira et al., 2010; Benin et al., 2012; Fioreze et al., 2012). The density of sowing is important, mainly due to the difference in tillering capacity of the cultivars (Valério et al., 2013).
The seeding density and spacing between lines when suitable influence the competition among the wheat plants, and thus provide a consequent improvement in light interception by the canopy and in the use of environmental resources (Chen et al., 2008; Valério et al., 2009). The competition between plants and their effects are crucial in the production of tillers and act directly on the grains yield and its components (Ozturk et al., 2006). However, wheat genotypes with different potential of tillers respond in such differentiated ways to sowing density and to the number of plants per area.
In this way, genotypes with high potential of tillers are dependent on adequate adjustment of seeding density, because they compete for more light and nutrients (Valério et al., 2009). In turn, the genotypes with reduced potential of tiller exhibit less countervailing effect and, therefore, depend on high seeding densities to maintain the yield (Valério et al., 2008).
Thus, the optimal adjustment of the number of plants per area can be decisive for achieving stability and balance of yield components of wheat crop (Valério et al., 2009). Thus, the objective of this study was to evaluate the agronomic performance of the wheat cultivar BRS 208 in function of different spacing and sowing densities in two agricultural years.
The experiment was conducted during the agricultural years of 2010 and 2011 in the municipality of Marechal Cândido Rondon, west region of Paraná State, situated at a latitude of 24°33'40''S and longitude 54°04'00'' W, with an altitude of 410 m. The local climate, classified according to the Köppen, is the subtropical Cfa type, with rainfall well distributed during hot summers. The predominant soil type is an Eutroferric Red Latosol. The chemical and physical characterization of the soil at a depth of 0 to 10 cm had the following characteristics:
pH (CaCl2) = 5.69; exchangeable Al (cmolc dm-3) = 3.76; Ca (cmolc dm-3) = 9.38; Mg (cmolc dm-3) = 2.72; P (Mehlich) (mg dm-3) = 8.43; K (cmolc dm-3) = 1.34; organic matter (g dm-3) = 28.43; CTC (cmolc dm-3) = 17.20 V (%) = 78.14; sand (g kg-1) = 64.08; silt (g kg-1) = 492.92; clay (g kg-1) = 443.0.
The values of temperature and rainfall during the experimental period are presented in Figure 1. The experimental design was randomized blocks with four replications in a factorial scheme of 3 x 4, consisting of three spacings (13, 17 and 21 cm between rows) and 4 seeding densities (200, 300, 400 and 500 seeds m2), conducted during the harvests of 2010 and 2011. Each experiment consisted of 48 plots, having 2 m width and 6 m lenght, with 12 m2 area.
The cultivar used was the BRS 208. The experiment was installed in the period of May to September, 2010 and 2011. The soil of the area under study was under no-tillage system, and had a predecessor crop to soybean. Before the implementation of the experiment, the desiccation of the plant material present in the area was performed with the application of the herbicide glyphosate (1,560 g ha-1 of the a.i).
The basic fertilization in the furrows of the sowing was performed taking into account the soil analysis and recommendations for the crop by applying 250 kg ha-1 77 of the formulated 78 NPK 08-20-20. The side dressing fertilization was performed with urea at a dose of 150 kg ha-1 79 at the beginning of tillering.
During the experiments, the application was performed with post-emergent herbicide metsulfuom-metilíco at a dose of 6.6 g ha-1 in the control of the major weeds. Applications of insecticide were carried out: dimetoato at the dose of 0.630 L ha-1 and clorpirifós at a dose of 0.75 L ha-1 to control aphid and caterpillar. For disease control, two applications of fungicide were used: 0.8 L ha-1 of pyraclostrobin + epoxiconazole and 0.75 L ha-1 of propiconazole.
The evaluations were performed at the end of the crop cycle being considered as useful area, one-meter square located in the center of each experimental plot. The number of fertile tillers m-2, number of infertile tillers m-2 and the number of ears m-2 were evaluated. The hundred grain mass and yield and corrected values for 13% of humidity were also determined. In addition, 10 ears were collected within the useful area of each experimental plot for the ratings of the length of the ear and the number of grains per ear. The hectoliter weight was evaluated in balance, especially for hectoliter mass of 0.25 L, with water content of the grain corrected to 13% of moisture, using a sample of each experimental plot.
A joint analysis of data collected was performed during the two harvests (2010 and 2011). The data were subjected to analysis of variance through F-test. When the value was significant at a level of 5 or 1% of probability, the Tukey test was applied for comparison of averages. The regression analysis was performed when the F-test was significant for seeding density. For the statistical analysis, the program SAEG 9.1 was used.
Table 1 presents the average values of the number of tillers per m2 as a function of different spacings, densities and the agricultural years evaluated.
In the agricultural year 2010, the effect of interaction between the different spacing and sowing densities was observed, and the spacing of 13 cm between rows when used with density of 200 seeds m2 resulted in greater numbers of tillers per m2 (429.50) in relation to the other spacings. Whereas, in the density of 500 seeds per m2, the spacing of 13 and 17 cm between rows resulted in a smaller number of tillers per m2 when compared with the spacing of 21 cm (550.25). In the comparison of the other spacings, no significant difference was found.
Regarding the effect of the different seeding densities, it can be observed that within the two years of the experiment (2010 and 2011), the highest density tested (500 seeds m2) resulted in a greater number of tillers per m2. However, it is worth mentioning that at the density of 500 seeds per m2, it was observed to be about 520, 532 and 550 tillers per m2, for the spacing of 13, 17 and 21 cm, respectively, that is, on average, a plant produced a little more than 1.0 tiller, whereas in the density of 200 seeds per m2, it was observed for these spacings, average value of 415 tillers per m2, that is, a plant produced on average, more than 2 tillers.
Thus, it is observed that there is a decrease in the number of tillers per plant as the density of seeding increased. Fernandes (2009) and Valério et al. (2008) also found a reduction in the number of tillers in function of increased density. It is important to emphasize that different wheat cultivars respond differently to increased density in relation to the potential issue, development or survival of tillers (Silveira et al., 2010), effect which may possibly have occurred in the present study, depending on the characteristics of the cultivar used.
A rising linear behavior for the number of infertile tillers per m2 was observed as it increased the density of seeding, regardless of the spacing used (Figure 2). The results showed that the largest number of seeds per m2 caused the wheat plants to increase their capacity to generate unproductive tillers.
These results are in agreement with those obtained by Alvarenga et al. (2009), who reported a lower number of fertile spikelets with the increase of density and sowing. According to Sparkes et al. (2006), the quality of light reflected on the plant is a key factor in the viability of tillers, and with increase in density, there is a high incidence of extreme red light at the bottom of the plants, reducing the quality of the light absorbed by the plant. Hence, increase in the number of seeds per area can lead to competition between plants and thus a consequent increase in the number of infertile tillers by area (Ozturk et al., 2006; Valério et al., 2008).
The effect of seeding density in relation to the number of ears per m2 is shown in Figure 3. The spacings of 13, 17 and 21 cm between lines did not differ among themselves, showing a growing linear trend in the number of ears per m2 with the increase of seeding density. Gross et al. (2012) working with different sowing densities also verified an increase in the number of spikes per area as a function of the increase in the number of seeds per area. For Valério et al. (2009), wheat in general, when cultivated under reduced sowing densities express a smaller number of ears per unit area. Whereas, concerning the number of spikelets per ear (Figure 4), there was an opposite effect to that obtained for the number of ears per m2 (Figure 3), and this variable demonstrated a rising linear behavior in proportion to the increase in the number of seeds per m2 with averages ranging from 14.5 and 13.2 spikelets per ear for the lowest and highest density tests, respectively.


Results that corroborate with those obtained in the present study were obtained by Gross et al. (2012) where they obtained smaller mean spikelets per spikes as a function of the increase of plant density. Thus, the reduction of the number of spikelets per ear, may be a consequence of competition specifically for light, water and nutrients, due to a larger number of seeds per area.
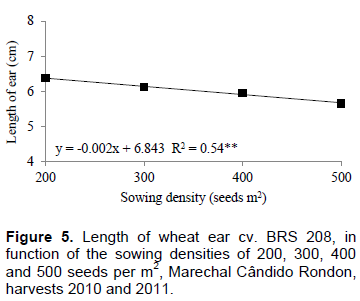
The average values of length of ear decreased linearly as a function of densities tested, but regarding the different spacings, significant differences between treatments were not observed (Figure 5). The sowing density influenced negatively, the length of ear ranging from 6.2 to 5.8 cm for densities of 200 to 500 seeds per m2, respectively. Similar results were obtained by Filho et al. (2008) and Alvarenga et al. (2009), where they found a reduction in the length of the wheat ears in proportion to the increase of the density of seeds per m2.
In relation to the number of grains in ten ears (Figure 6), it is possible to observe that this variable had a similar behavior to the length of the ear (Figure 5), where a linear reduction in function of the densities of 200, 300, 400 and 500 seeds per m2 was observed, with values of 303.3, 281.2, 272.2 and 254.2 seeds in ten ears, respectively.
The same way, Teixeira Filho et al. (2008), Valério et al. (2008) and Alvarenga et al. (2009) working with different seeding densities in the wheat crop, verified negative linear behavior for the number of grains per spike due to the increased sowing density. This fact can be associated with increased competition for light and nutrients, resulting from the largest population of fertile tillers per unit area (Ozturk et al., 2006).
For the mass of 100 grains, no significant effects were observed as a function of the spacings, but only as a function of the different densities (Figure 7), showing a linear behavior decrease due to increase in the number of seeds per area. This is possibly due to the high competition between plants for resources of the environment during their development. Similar results were obtained by Fernandes (2009), who verified that the increase in sowing density resulted in the reduction of one hundred grain mass. This author confers this reduction to the existing competition due to the increase in seed sowing density. However, Tavares et al. (2014) found no significant difference for grain mass at densities of 150 to 450 m² plants.

The grain yield and hectolitric weight of cv. BRS 208 obtained in the present study was not influenced by the factors between line spacing and sowing density. Several authors (Gross et al., 2012; Teixeira Filho et al., 2008) also observed that productivity is not influenced by sowing density.
For the variable hectolitric, Tavares et al. (2014) obtained similar results. Thus, similarity of the results in the present work can be considered normal for the densities used. However, Barbieri et al. (2013) working with four cultivars of wheat in populations of 140 to 350 plants m2, concluded that the yield varies according to the genotype used, and some cultivars have a lower capacity of compensation in relation to others, that is, each cultivar has a different performance when subjected to random plant reduction.
The results of grain yield and hectoliter weight, regarding the two agricultural years are shown in Table 2. The yields obtained in the two years of cultivation, lies within expectations for the western region of Paraná State, reaching average values of 2572.02 and 2878.52 kg ha-1, for the years, 2010 and 2011, respectively. However, when compared with the averages of productivity, it was evident that the year 2011 had better response, having obtained significantly higher value than the year 2010. The planting performed in 2011, also resulted in significantly higher values for the variable, hectoliter weight (73.94%).
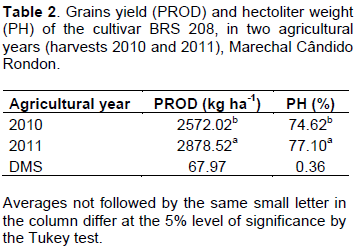
It is observed in the year 2011, that the averages of hectoliter weight and the final productivity of the cultivation were higher as compared to the year, 2010. These results can be explained in function of greater regularity of precipitation in 2011 or even the existence of precipitation in the final period of grain filling and maturation of culture, with the period approximately between 20 and 10 days before harvest, indicating that this weather variable influenced the yield of the crop during the first year of cultivation (2010) as shown in Figure 1.
Santos et al. (2012) reports that wheat cultivars subjected to water deficit at the beginning of flowering, obtained lower phytomass and grain yield. According to Guarienti et al. (2005), the water excess within 21 days prior to harvest negatively affects the hectoliter weight and the grains yield. Thus, these effects may explain the differences obtained in the components mentioned above in the two years of cultivation in this study.
The responses obtained for grain production in this study showed a direct relationship dependent of the performance of each component of production evaluated. In a general way what can be seen in relation to the results obtained in the analysis of the harvests of 2010 and 2011, was that high seeding densities responded significantly to the variables directly related to the increase in the number of seeds per m2, that is, the number of tillers per area and ears per area evaluated. However, these responses are not reflected in the most important components of production, grain mass and yield, also, a negative reflection for components of grains per ear and spikelets per spike is observed.
1. The increase in sowing density reflected in increase in the number of tiller per m2 of cultivar BRS 208; however, it reduced the number of tiller per plant and increased the number of infertile tiller per m2.
2. Increasing sowing density resulted in a higher number of ears per m2, but reduced the number of spikelets in the ears.
3. The ear length, number of grains in ten ears and mass of one hundred grains reduced as a function of the increase in seeding density.
4. Productivity and hectoliter weight were not influenced by density and spacing.