Full Length Research Paper
ABSTRACT
Kajiado County is mainly Arid and Semi-Arid Lands (ASALs) and as such it is faced with harsh climatic conditions. The county is dominantly inhabited by the Maasai pastoralists who depend on climate-sensitive natural resources for their provisions and production needs. As such, they are faced with low productivity. Therefore, the study investigated historical temperature characteristics combined with surveys on the Maasai pastoralists’ experiences. The study used a mixed-method approach using temperature data along with semi-structured questionnaires. Temperature analysis utilised a mix of ground-based meteorological and satellite data. These temperature data were retrieved from Kenya Meteorological Department (KMD) and Climate Hazards Infra-Red Temperature with Stations (CHIRTS) respectively. The climatology analysis from the T-test showed that both the maximum and minimum temperature increased significantly at p < 0.05. A similar temperature rise was noted for spatial analysis where an overall warming trend was observed across the entire county. The Chi-square analysis affirmed the adverse effects of the temperature rise on the Maasai pastoralists as indicated in the growing numbers of heat-related illnesses and deaths in livestock. The resultant social-economic impacts translated to a decline in livestock population pointing up to the need for enhanced preparedness for the warming trends and better prediction models to enhance both societal and ecosystem resilience.
Key words: Temperature, natural resources, pastoral livelihood system, society, ecosystem, resilience, climate risks.
INTRODUCTION
Rangelands are the hotspots of temperature rise that are associated with adverse impacts on the natural systems (Markalis, 2004; International Fund for Agricultural Development (IFAD), 2009; Morrison et al., 2018). In the last three successive decades, the earth’s surface has increasingly become warmer, especially during the years 1983-2012, which were the worst years globally in terms of temperature rise. Besides the warming trends, we have also had to deal with heatwaves and wildfires. According to Intergovernmental Panel on Climate Change (IPCC) report, natural systems encompass human health, food security and human security, all of which are climate-sensitive (IPCC, 2014). The same report indicates that a temperature rise that exceeds 1.5°C can lead to a substantial loss of terrestrial biomass. Similarly, Sharma et al. (2014) argue that temperature rise is associated with landscape degradation. According to Adams et al. (1998); Schwartz et al. (2005) and Oxford Committee for Famine Relief (OXFAM), 2008). Temperature rise is likely to compromise natural systems contributing to losses of primary sources of livelihood in the ASALs.
Globally, there has been an average temperature rise in recent times (IPCC, 2014). The consensus is that Africa, in particular, is susceptible to a projected temperature rise of 1-2.5°C in the next three decades (Boko et al., 2007). According to IPCC (2007), warming trends will result in low production, widespread food insecurity, emaciation and deaths of herds. Similarly, UNDP (2013) reported that the pastoralists inhabiting the ASALs are likely to face a looming threat to their livelihood. Kajiado County is no exception, for it is dominantly ASALs and its economic mainstay is livestock rearing, which is highly dependent on climate-sensitive natural resources. According to the Ministry of Agriculture, Livestock and Fisheries (MoALF), (2017), the Maasai pastoralists are ill-prepared leading to uncertainties on how they will respond to the projected temperature rise. The MoALF Report further states that temperature rise occurring in the pastoral Social-Ecological System is likely to cause disruptions with multiple adverse social-economic impacts and emphasises the need for the Maasai pastoralists to have a better understanding of climate systems to enhance their preparedness.
Temperature information is a critical weather attribute for pastoralism, yet the extent of temperature rise remains unclear in the County (Milly et al., 2008). Therefore, we needed to analyse historical temperature data as a measure to enhance the Maasai pastoralists’ preparedness for climate-related uncertainties. Other related studies, Behnke (2000); Behnke et al. (1993); Mace (1991); Said et al. (2017) reported that the temperature rise could adversely impact the Maasai pastoralists who are ill-prepared to address the associated climate risks. Similarly, Omondi et al, (2014) projections of warm global average temperatures in the County towards the end of the current century. Therefore, the Maasai pastoralists are likely to face more extreme weather events in the future (Nori and Davies, 2007; Ouma et al., 2001). Besides their increasing vulnerability to climate-risks, the Maasai pastoralists have in recent times experienced bottleneck including loss of biodiversity, low production and declining status of critical resources on both the temporal and spatial scales (Folke et al., 2010). Thus, it was important to investigate historical temperature characteristics to offset the incomplete knowledge. Besides the inevitable loss of natural resources, temperature is also an important climate attribute in livestock production since it influences the recovery of livestock from epidemics as well as the time interval required for restocking.
MATERIALS AND METHODS
Study area
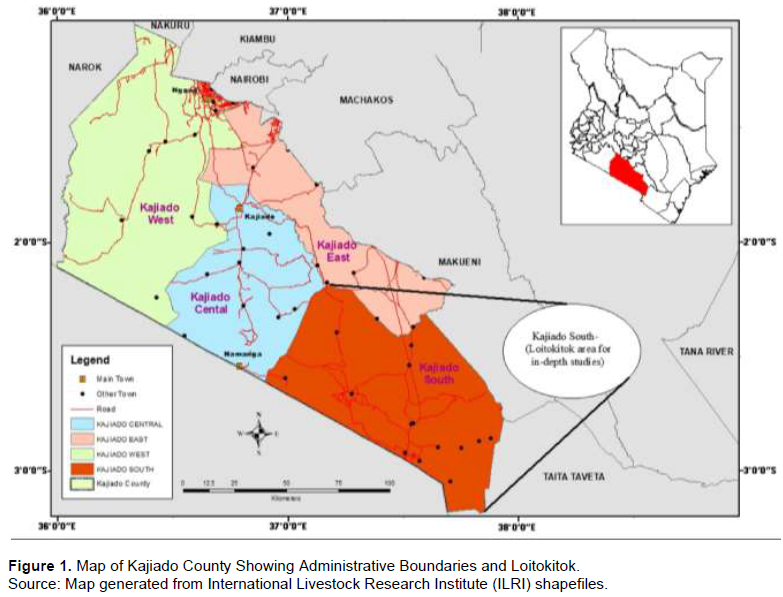
Kajiado County is located in the southern region of Kenya (Figure 1). The County’s area is 21,900 km2 and lies between latitudes 1° 0′ and 3° 0′ S and longitude 36° 5′ and 37° 5′ E. The County’s altitude ranges between 1580 and 2460 m above sea level (GoK, 2016) and it is predominantly occupied by the Maasai pastoralists (Mworia and Kinyamario, 2008). The main economic activity is livestock rearing which is highly dependent on natural vegetation (Reynolds et al., 2007).
Temperature data
Ground-based meteorological temperature data for the period 1970-2014 from Ngong, Magadi, Isinya and Mashuuru weather stations in Kajiado County were retrieved from Kenya Meteorological Department (KMD) archives. In addition, satellite data for the period 1983-2014 from Climate Hazards Infra-Red Temperature with Stations (CHIRTS). These are gridded blended satellite/station-observed temperature dataset at a spatial resolution of 5 km by 5 km (Verdin et al., 2020).
Community perception data
The study focused on gathering in-depth past and recent information from the people’s responses. Therefore, semi-structured questionnaires including 195 household surveys, 8 gender-based Focus Group Discussions (FGDs) and 18 Key Informant Interviews (KIIs) were used. This approach borrowed heavily from Morgan (2006) assertion that shared experiences from diverse points of view enables integration of a wide world view which makes comparison possible. Similarly, Denscombe (2010) supported the use of triangulation methodology. In his assertion, he mentioned that alternative data collection methods created a provision for making a comparison with findings from other methods for easier interpretation. In this context, the household questionnaires were triangulated with FGDs and KIIs while taking into account similar social-economic variables. The use of selected social-economic attributes is in line with Krueger (2002), who asserted the importance of having a guide to the participants. Therefore, based on the theme, the participants narrated their experiences on pertinent issues as the researchers guided them.
Household survey
The questionnaires for households consisted of a closed-ended 5-point Likert scale based on perceptions. The study employed a stratified simple random sampling technique where participants with similar experiences were first grouped then followed by random administration of questionnaires through a drop and pick approach to ensure reliability and maximum response rate on the sampling frame (Murray, 2013). This method is also supported by Mugo (2002) who reported the acceptability of a sample in a population. According to Mugo (2002) the sample is representative of the population and can be used to draw conclusions. To this end, this study adopted the formula suggested for social science research that has a large population (Godden, 2004). Kajiado County has a total population of 1,117,840 (KNBS, 2019). The sample size was determined as given in equations.
Cochran equation
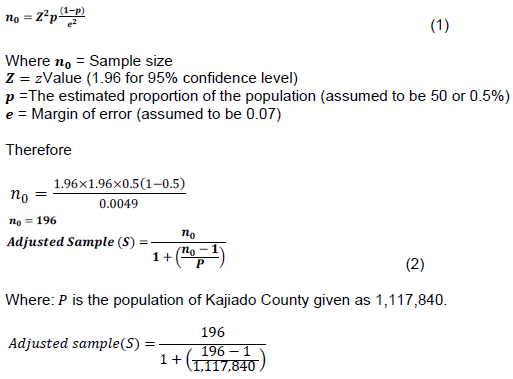
Therefore adjusted samples for an effective result is 196.
The sample size was 196 (Equation 2), which is an acceptable sample size according to Cochran (1971). According to Boniface et al. (2014) response rate is expressed as the fraction of the eligible survey participants who are contacted and interviewed. In this context, 200 questionnaires were distributed, 196 were filled and returned while 4 were returned blank leaving a total of 196 questionnaires whose feedbacks were found satisfactory. This feedback was equated to a response rate of 97.5%. This is in line with Saunders et al. (2007) who asserted that a response rate between 52 and 100% is adequate.
Focus group discussions
Sampling for FGDs was at the village level since this provided equal opportunity for representation. It was important to take into account all the eight villages in Loitokitok (the area of in-depth studies). These analogous villages shared similar biophysical features that are associated with the pastoral livelihood system. All the participants for FGDs were pastoralists who had inhabited the area for at least 10 years thus creating a common base of shared experiences. Each of the gender-based FGD comprised 9 to 11 participants. This is in line with Dilshad and Latif (2013), who recommended that FGDs participants should be within the range of 6 to 12. Besides the number of participants in each of the eight FGDs, fair age distribution and gender-balanced were factored in as the researchers engaged the community.
Key informant interviews
These were experts working for institution having community engagement programmes. In this context, the sampling frame was generated from a consolidated list of 40 institutions. However, only 18 institutions had community aspects focussing climate-adaptation programmes making them suitable for these interviews. This is in line with Ogallo (2014), who asserted the importance of having an expert opinion in social studies. Similar sentiments are supported by Carter and Beaulieu (1992) who asserted the critical role of key informants. According to Bogner et al. (2009), key informant interview as a method of data collection makes it possible for the researchers to acquire first-hand information from experts who are resource persons with special knowledge in a particular field.
Data analysis
Temporal analyses
Reference to 1970 as the starting point for the time series analysis was based on the standard work which reported that since 1970 the global average temperatures have been rising at a rate of 1.7°C and as such the year was the turning point for rising global average temperatures (IPCC, 2014). The temperature data were entered in the Excel spreadsheet in readiness for extraction and further analysis on the STATA statistical package. The outputs were plotted and fitted with the line of best fit producing the Y = β0 + β1X1 + ε line to show temperature trends. The null hypothesis, in this case, was that the slope coefficient β1 = 0 whereby β1 is tested to determine if it is statistically different from zero at p < 0.05. T-test analyses covered the 1983 to 2014 dataset where hypothesis testing involved splitting the period into two equal parts in terms of early years (1983 to 1998) and later years (1999 to 2014). Thereafter, the means were computed for the early and later years compared for significant change at p < 0.05.
Spatial mapping
Ground station data needed to be considered as the first option. However, the distribution of the four weather stations from the KMD data was limited in terms of spatial coverage and time gaps. To compensate for this paucity of information, satellite-based data was used in this analysis. Besides its acceptance as a credible climate data source, its long series, completeness, quality control and homogeneity were also considered. In addition, satellite-based data are consistent and have high resolution at a local scale. Thus, the spatial analysis of temperature was determined from the CHIRTS (1983-2014) since it could not be realised from the ground-based meteorological data.
Thematic analysis, fractions and scores
Raw data from FGDs and KIIs in the form of audio files were transcribed and verified by comparing field notes to the transcribed scripts generated. Data entry, cleaning and coding were done through the use of emerging themes for each category of the social-economic variables which covered all the major issues discussed. Thereafter, NVivo version 10 was used for further analysis to interpret the underlying content.
The responses from the household questionnaires were rated based on 5-point Likert-scale rated on a scale of 2 to -2 (where 2 = very high, 1 = high, 0 = neutral, -1 = low and -2 = never) and triangulated with those of FGDs and KIIs. In this context, in-depth information on past and recent vulnerabilities documented in scripts. The study realised both quantitative and qualitative evaluation for each social-economic variable. The quantitative statistics were computed into fractions and scores based on an attitudinal scale (Hsieh and Sharron, 2005; Bonne, 2012) while the qualitative data were constituted into response summaries based on the themes.
Chi-square test for independence
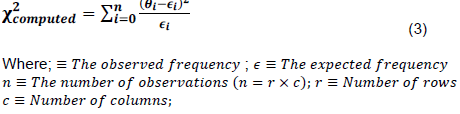
Chi-square test (χ2) was used to analyse the 5-point scale Likert type questions and it measured how the expected variables compared to the actual observed data to test whether the frequencies in each group of respondents was significantly different from what would be expected if the variables studied were independent of each other. The test analysed the variable indicators categorically to investigate the null hypothesis that the attribute represented by the columns is independent of the attribute represented by the rows and vice versa, against a contrary alternative hypothesis.
The test statistic,  computed, was based on the frequencies and is computed as follows:
The critical statistic for the test, is usually obtained from the Chi-Square distribution tables at the specified significance level and the existing degrees of freedom that is,
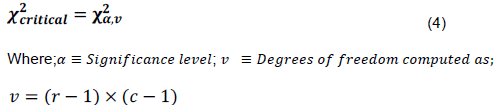
The decision rule of the test requires that the null hypothesis is rejected if 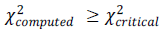
RESULTS
Temporal trends
Temperature trends
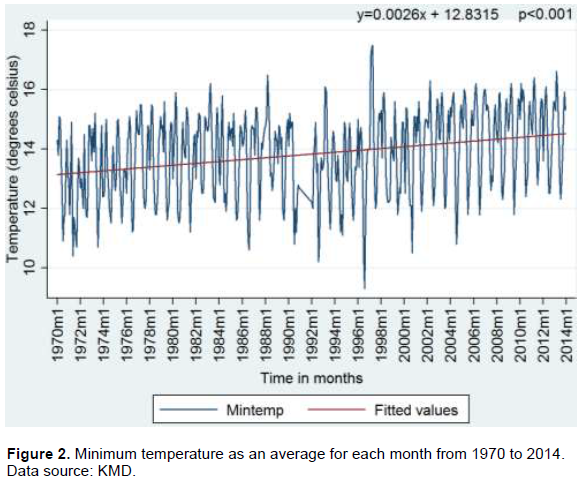
The yearly pattern of the mean minimum temperature from 1970 to 2014 indicates that the change is significant (Figure 2), with an increase of 0.0026° per month or 1.37° over the 44 years. The line of best fit reveals warming trends for Tmin that is statistically significant at p < 0.001. The yearly pattern of the mean maximum temperature from 1970-2014 indicates that the change is significant (Figure 3), with an increase of 0.0011 per month, so 0.58° increase in 44 years. The line of best fit reveals warming trends as well for Tmax that was statistically significant at p = 0.0243.
Comparison of means
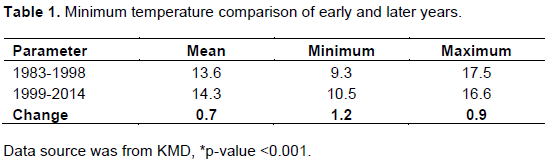
To provide further information on temperature change over time, the study the period (1983 to 2015) was divided into two equal parts (an average of 16 years apart) and their means calculated. Table 1 indicates a notable change in the minimum temperature between early years (1983 to 1998) 13.6°C compared to later years (1999 to 2014) 14.3°C. The t-test analysis at p < 0.05 showed a significant change in Tmin (p < 0.001).
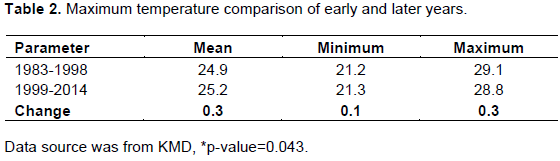
Similarly, the 1983 to 2015 period (32 years) for the maximum temperature was analysed. Table 2 indicates a notable change in the maximum temperature between early years (1983 to 1998) 24.9°C compared to later years (1999 to 2014) 25.2°C. The t-test analysis at p < 0.05 showed a significant change in Tmax (p = 0.043).
Temperature range
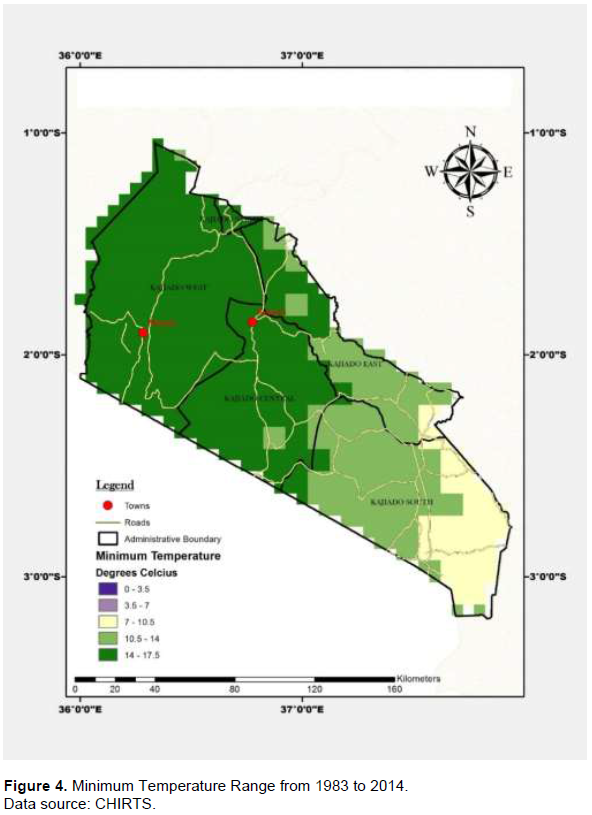
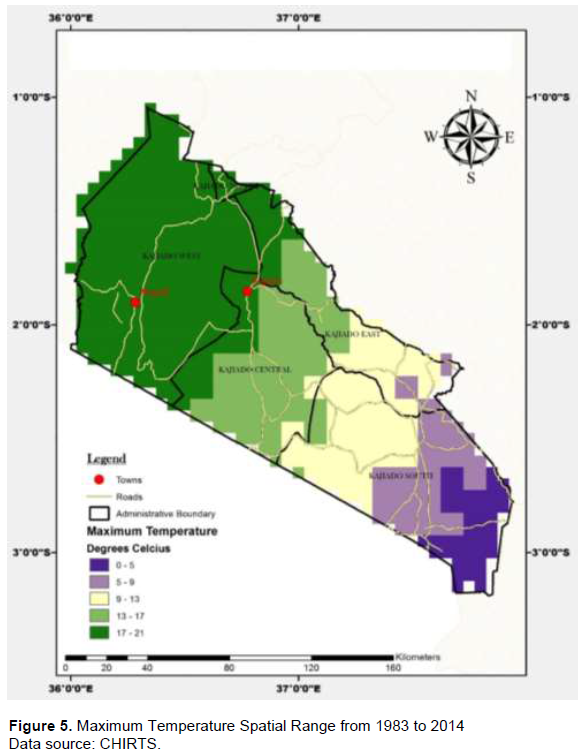
The temperature range for minimum temperature was realised from pixels taken at various points and the output obtained in the form of degrees Celsius in numerals representing the temperature ranges on the map (Figure 4). The spatial patterns formed from the legend in the map indicate that minimum temperatures were rising across the entire County. The temperature range for maximum temperature was realised from pixels taken at various points and the output obtained in the form of degrees Celsius in numerals representing the temperature ranges on the map (Figure 5). The spatial patterns formed from the legend in the map indicate that maximum temperatures were rising across the entire County.
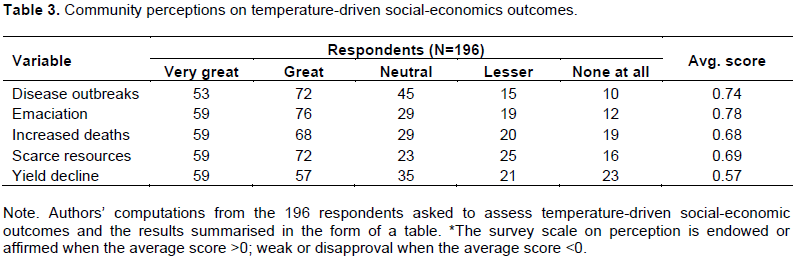
Community perceptions on temperature-driven social-economics outcomes
The warming trend was affecting the pastoral livelihood system in Kajiado County in multiple ways. The study reported (Table 3) disease outbreaks, growing numbers of emaciation and deaths. Besides poor health status, uncertainties on how temperature extremes could be overcome were a major concern among the Maasai pastoralists.
In the FGDs, it was reported that the Maasai pastoralists had of late realised more episodes of hot nights. According to FGDs, such temperature extremes was causing ill-health or even deaths of herds. Therefore, disease outbreaks were inevitable since their livestock were not accustomed to extreme temperatures and as such livestock deaths could rise. It was also reported in the FGDs that under such harsh condition in the County, it would be unrealistic to uphold traditional livestock rearing practices. Besides these uncertainties, natural resources were fast dwindling. It was further reported in FGDs that temperature rise could usher in a radically different future for the Maasai pastoralists as they could be forced to shift to alternative livelihoods which are less dependent on natural resources.
In the KIIs, it was reported that temperature rise was being experienced across the entire County raising concerns over the anticipated adverse outcomes. According to KIIs, more challenges were expected since the warming trend was taking place at a faster pace than there previously. It was further stated in the KIIs that the Maasai pastoralists could probably respond better if they are enlightened on the extent of the temperature rise. It was also reported in the KIIs that on their own, the Maasai pastoralists were ill-prepared to make accurate interpretation to inform tactical decisions.
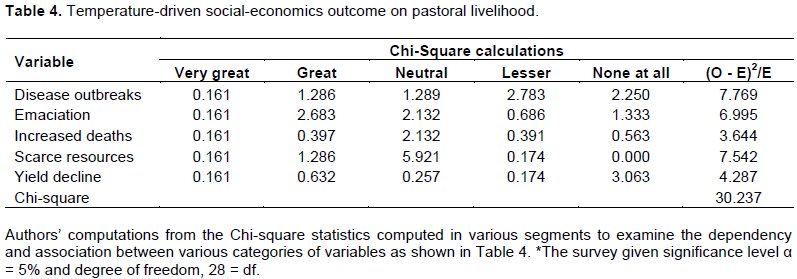
Chi-Square was used to test for independence on whether the relationship among the variables was evident. Therefore, various segments were computed to examine the dependency and association between various categories of variables as shown in Table 4. The χ2 computed (30.237) was greater than χ2 critical (16.928). Therefore, the null hypothesis, “social-economic variables are independent of temperature rise is rejected. It is, therefore, conceivable that social-economic variables were adversely affected by the warming trends.
DISCUSSION
The analysis of temperature trends as was exhibited by the linear slope in Figures 2 and 3 indicated significant temperature rise in Kajiado County. Besides the warming trends, it was important to note that whereas a change is considered as significant by the usual convention of p < 0.05, both the maximum and minimum temperature experienced significant change. Further analysis involved the means for the early and later years as computed. Here there was a realisation of noticeable change in both the minimum and maximum temperatures with a rise of 13.6 to 14.3°C and 24.9 to 25.2°C respectively support the need for further research on scenarios for future projection.
The analysis of change over time realised a notable shift in temperature, a mean difference of 0.73 and 0.32°C for minimum and maximum temperatures respectively as the County was 0.41°C overall warmer than there previously. Other related studies by Christy et al. (2009) and Said et al. (2017) also observed temperature rise in this County. According to GoK (2010), a temperature rise of between 0.5 to 2°C, 0.7 to 2.0°C and 0.2 to 1.3°C had been observed in early and later times for average, minimum and maximum temperatures respectively. Therefore, raising concerns over the sustainability of the pastoral livelihood system.
These warming trends could adversely impact on pastoral livelihood system considering that the County is already resource-scarce. Besides low productivity, pastoral livelihood system high dependence on the natural systems whose variation influences greatly by temperature shift raises concern. According to the Maasai pastoralists who were interviewed affirmation that further disruption by temperature rise was rendering them vulnerable since their herds are not used to such a drastic shift in temperature changes. Similar opinions were shared by Sein et al. (2015) and Said et al. (2017) who reported that such thermal extremes could have devastating impacts on natural resources. Therefore, the Maasai pastoralists could be on the verge of losing their primary source of livelihood.
The findings also revealed a warming trend across the entire Kajiado County as indicated in the resultant pixels taken at various points and the output displayed in numerical degrees Celsius showing the spatial temperature ranges across the entire County. Indeed, the extensive spatial scales at which the temperatures rise were experienced across the County raises concerns. To this end, the high temperatures associated with the warming trend could escalate into heatwaves with the potential of degrading the Maasai pastoralists Social-Ecological System. A similar opinion was shared by Burnsilver et al. (2003) who reiterated that temperature rise could exacerbate the biophysical constraints, yet the Maasai pastoralists were still unwilling to translate these concerns into meaningful personal action. Another related study, Mukuna et al. (2015), reported that the temperature rise could threaten palatable pastures to the point of their extinction adversely impacting the livestock production system. According to Robinson et al. (2014), temperature rise could have adverse ramifications on livestock feed intake, mortality, growth, reproduction, maintenance and production. Similar sentiments were shared by OleSaitabau (2014) who reported that temperature rise could disrupt the sustenance of the pastoral production system.
The responses from the FGDs and KIIs confirmed increased hotter days in recent times. According to the responses, the temperature rise has exacerbated the high diminishing rate of resources, yet Maasai pastoralists were still over-dependent on already scarce natural resources. Moreover, their interaction with temperature rise was not favourable considering the various adverse impacts. Besides disease outbreaks and poor health status, it was also evident that there were growing numbers of emaciated and deaths of livestock resulting in population decline. Other related studies, Catley et al. (2013); Mapiye et al. (2006); Ng’ang’a et al. (2016) and GOK (2012) also reported a decline in herds’ population an observation they attributed to the temperature rise.
CONCLUSION
The pastoral livelihood system is the economic mainstay in Kajiado County. Therefore, temperature rise raises concern over of sustainability of this primary source of livelihood. Besides the Maasai pastoralists being rendered destitute and marginalised, the temperature rise was contributing to the Maasai pastoralists’ vulnerability as was deduced from the findings. Moreover, the temperature rise was at a faster pace in recent times than the Maasai pastoralists could comprehend as was exhibited in the growing numbers of either sick, emaciated or dead animals. These occurrences were rather a clear indication of anticipated adverse impacts global warming is likely to cause on pastoral ecology which is highly dependent on natural pastures.
RECOMMENDATION
These findings point out for enhanced preparedness among the Maasai pastoralists by building their capacities on reliable climate system predictions and tactical decision making in attempts to overcome climate-related uncertainties associated with temperature rise.
CONFLICT OF INTERESTS
The authors have not declared any conflict of interests.
ACKNOWLEDGEMENT
The authors express gratitude to IGAD Climate Prediction and Application Centre (ICPAC) and the Kenya Meteorological Department for their logistic and technical support. This work was supported by the National Council of Science and Technology (NACOSTI) under PhD Grant No. NACOSTI/RCD/ST&I/ 7TH CALL/PHD/066.
REFERENCES
|
Adams RM, Hurd BH, Lenhart S, Leary N (1998). Effects of global climate change on agriculture. Journal of Inter-Research Climate Research 11(1):19-30. |
|
|
Behnke RH (2000). Equilibrium and non-equilibrium models of livestock population dynamics in pastoral Africa: their relevance to Arctic grazing systems. Pastoral Management in Africa 20(2-3):141-152. |
|
|
Behnke RH, Scoones I, Kerven C (1993). Rethinking range ecology. Pastoral Management in Africa 1:1-30. |
|
|
Bogner A, Littig B, Menz W (2009). Interviewing experts: methodology and practices. Basingstoke England: Palgrave Macmillan. |
|
|
Boko M, Niang A, Nyong A, Vogel C, Githeko A, Mendany B, Osman E, Tabo R, Yanda P (2007). Africa: Impacts, Adaptation and Vulnerability. Contribution of Working Group ii to the Fourth Assessment Report of the Intergovernmental Panel on Climate Change. In: Parry M, Canziani F, Palutikof P, Van der L, Hanson, C. (Eds.), Cambridge University Press, Cambridge UK P 433. |
|
|
Boniface S, Kneales J. Shelton N (2014). Drinking patterns is more strongly associated with under-reporting of alcohol consumption on socio-demographic factors: evidence from mixed-method study. BMC Public Health 14(1):1297-1299. |
|
|
Bonne HN (2012). Analyzing Likert data. Journal of Extension 50(2):1-5. |
|
|
Burnsilver SB, Boone RB, Galvin KA (2003). Linking Pastoralists to a Heterogeneous Landscape: The Case of Four Maasai Group Ranches in Kajiado District, Kenya. In: Fox J, Rindfuss RR, Walsh SJ, Mishra V (Eds.), People and Environment: Approaches for Linking Households and Community Surveys to Remote Sensing and GIS. Boston, MA: Kluwer Academia Publisher. |
|
|
Carter KA, Beaulieu LJ (1992). Conducting a Community Needs Assessment: Primary Data Collection Techniques. Gainesville, FL: University of Florida. |
|
|
Catley A, Scoones I, Lind J (2013). Pastoralism and Development in Africa: Dynamic Change at the Margins. Routledge and Earth Scan, London P 295. ISBN-13: 978-0-415-54071-1. |
|
|
Christy JR, Norris WB, McNider RT (2009). Surface temperature variations in East Africa and possible causes. |
|
|
Denscombe M (2010). The Good Research Guide: for Small-Scale Social Research Projects. 4th edn. Open University Press, England P 389. |
|
|
Dilshad RM, Latif MI (2013). Focus group interview as a tool for qualitative research: an analysis. Journal of Social Sciences 33(1):191-198. |
|
|
Folke C, Carpenter S R, Walker B, Scheffer M, Chapin T, Rockström J (2010). Resilience thinking: integrating resilience, adaptability and transformability. Ecology and Society 15(4):20-29. |
|
|
Godden B (2004). Sample size formulas. Journal of Statistics 3:66. |
|
|
Government of Kenya (GoK) (2010). National Climate Change Response Strategy. Government of Kenya, Nairobi. |
|
|
Government of Kenya (GoK) (2012). National Policy for Sustainable Development of ASALs. Government of Kenya, Nairobi. |
|
|
Government of Kenya (GoK) (2016). Kajiado County Statistical Abstract Government of Kenya, Nairobi. |
|
|
Hsieh HF, Sharron SE (2005). Three approaches to qualitative content analysis. Qualitative Health Research 15(9):1277-1286. |
|
|
Intergovernmental Panel on Climate Change (IPCC) (2007). Impacts, Adaptation and Vulnerability. Contribution of Working Group II to the Fourth Assessment Report of the Intergovernmental Panel on Climate Change. In: Parry ML, Canziani F, Palutikof JP, Linden PJ, Hanson CE (Eds.), Cambridge University Press, Cambridge, UK P 976. |
|
|
Intergovernmental Panel on Climate Change (IPCC) (2014). Summary of Policymakers. In: Climate Change 2014. Impacts, Adaptation and Vulnerability: Part A: Global And Sectoral Aspects. Contribution of Working Group II to the Fifth Assessment Report of the Intergovernmental Panel on Climate Change. Cambridge UK and New York, USA: Cambridge University Press. |
|
|
International Fund for Agricultural Development (IFAD) (2009). Livestock and Climate Change. Rome, Italy. |
|
|
Kenya National Bureau of Statistics (KNBS) (2019). Kenya population and housing census. Nairobi, Kenya. |
|
|
Krueger RA (2002). Designing and Conducting Focus Group Interviews. Conference proceedings, University of Minnesota, USA. |
|
|
Mace R (1991). Conservation biology-overgrazing overstated. Nature 349:280-281. |
|
|
Mapiye C, Foti R, Chikumba N, Poshiwa X, Mwale M, Chivuraise C. Mupangwa JF (2006). Constraints to adoption of forage and browse legumes by smallholder dairy farmers in Zimbabwe. Livestock Research for Rural Develo Mapiye pment 18(12):712-724. |
|
|
Markalis J (2004). Pastoralism on the Margin. London: Minority Rights Group International. |
|
|
Milly PC, Betancourt J, Falkenmark M, Hirsch RM, Kundzewicz ZW, Lettenmaier DP (2008). climate change-stationarity is dead: whither water management. Science 319(5863):573-574. |
|
|
MoALF (2017). Climate Risk Profile for Kisumu County. Kenya County Climate Risk Profile Series. The Ministry of Agriculture, Livestock and Fisheries (MoALF), Nairobi, Kenya. |
|
|
Morgan DL (2006). Focus group. In: Jupp V (Eds.), The sage dictionary of social research methods. London: Sage, pp. 121-123. |
|
|
Morrison TA, Estes A, Mduma SR, Maliti HT, Frederick H, Kija H, Mwita M, Sinclair RE, Kohi EM (2018). Informing aerial total counts with demographic models: population growth of Serengeti elephants not explained purely by demographics. Conservation Letters 11(3):1-8. |
|
|
Mugo FW (2002). Sampling in Research. |
|
|
Mukuna GJ, Muthoni KS, Omedo BB (2015). Influences of changes in rainfall patterns on livestock feeding in Kajiado. British Journal of Applied Science 7(2):134-1. |
|
|
Murray J (2013). Likert data: what to use? Parametric or non-parametric? International Journal of Business and Social Sciences 4(11):254-264. |
|
|
Ng'ang'a SK, Van Wijk MT, Rufino MC (2016). Adaptation of agriculture to climate change in semi-arid Borena, Ethiopia. Regional Environmental Change 16 (8):2317-2330. |
|
|
Nori M, Davies J (2007). Change of Wind or Wind of Change? Climate Change, Adaptation and Pastoralism. WISP working paper prepared by IUCN, Nairobi. |
|
|
OleSaitabau H (2014). Impacts of Climate Change on the Livelihoods of Loita Maasai Pastoral Community and the Related Indigenous Knowledge on Adaptation and Mitigation. National Museums of Kenya. Nairobi, Kenya. |
|
|
Omondi PA, Awange JL, Forootan E, Ogallo LA, Barakiza R, Girmaw GB, Fesseha I, Kululetera, V, Kilembe C, Mbati MM (2014). Changes in temperature and precipitation extremes over the Greater Horn of Africa region from 1961 to 2010. International Journal of Climate 34:1262-1277. |
|
|
Ouma R, Mude A, van de Steeg J (2001). Dealing with climate-related risks: some pioneering ideas for enhanced pastoral risk management in Africa. Experimental Agriculture 47(2):375-393. |
|
|
OXFAM (2008). Survival for the Fittest: Pastoralism and Climate Change in East Africa (Vol. 16). Oxfam International. |
|
|
Reynold JF, Smith DM, Lambin EF, Turner BL, Mortimore M, Batterbury SP, Downing TE, Dowlatabadi H, Fernández RJ, Herrick JE, Huber-Sannwald E, Jiang H, Leemans R, Lynam T, Maestre FT, Ayarza M, Walker B (2007). Global Desertification: Building a science for dryland development. Science 316(5826):847-51. |
|
|
Robinson TP, William GR, Conchedda G, Van Boeckel TP, Ercoli V, Palamara G, Simon L, Gilbert M (2014). Mapping global distribution of livestock. PloS One 9(5):1-23. |
|
|
Said MY, Muhwanga J, Bedelian C, Moiko S, Abuya R (2017). Climate Projections for Arid and Semi-Arid Land of Kenya Based on RCP 2.6, RCP4.5 and 8.5. PRISE report. Kenya Markets Trust, Nairobi, Kenya. |
|
|
Saunders M, Lewis P, Thornbill A (2007). Research Methods for Business Students. Essex, Prentice-Hall, UK. |
|
|
Schwartz HJ, Fratkin E, Roth EA (2005). Ecological and Economic Consequences of Reduced Mobility in Pastoral Livestock Production Systems. In: Fratkin E, Roth EA (Eds.), As Pastoralist Settle - Social, Health and Economic Consequences of Pastoral Sedentarisation in Marsabit District, Kenya. New York: Kluwer Academic Publishers pp. 69-84. |
|
|
Sein Z, Ogwang B, Ogou FK, Batebana K (2015). Inter-annual variability of summer monsoon precipitation over Myanmar in relation to IOD and ENSO. Journal of Environmental and Agricultural Sciences Corpus ID: 130298595 |
|
|
Sharma V, Orindi V, Hesse C, Pattison J, Anderson S (2014). Supporting Local Climate Adaptation Planning Implementation through Governance and Decentralized Finance Provision 24(4):579-590. |
|
|
UNDP (2013). Combating Desertification in Kenya; Emerging Lessons from Empowering Local Communities, Nairobi. |
|
|
Verdin A, Funk C, Peterson P, Landsfeld M, Tuholske C, Grace K (2020). Development and Validation of the CHIRTS-daily-quasi-global high resolution daily temperature data set. Science Data 7(1):1-14. |
|
Copyright © 2024 Author(s) retain the copyright of this article.
This article is published under the terms of the Creative Commons Attribution License 4.0


