Full Length Research Paper

ABSTRACT
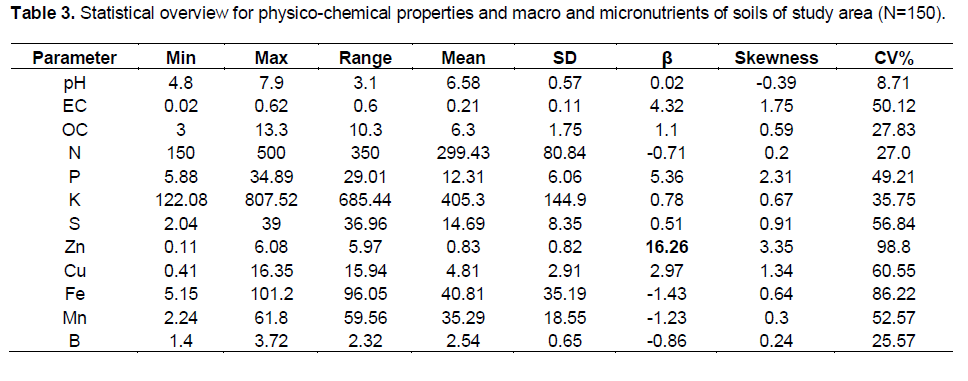
Scientific information concerning spatial variability and distribution of soil properties is critical for farmers attempting to increase fertilization efficiency and crop productivity; fertilization based on maps with recommendations related to soil fertility may lead to reduced fertilizer inputs without reducing yield. In the present study, GPS based one hundred fifty surface soil samples (0-15 cm) were collected from dominant cropping system. After processing, the soil samples were analyzed for different soil characteristics in laboratory using standard procedures. The data obtain from laboratory analysis was statistically and geo-statistical interpreted. The results revealed that the 23.6, 28.30, 48.6, 13.9, 25.5 and 54.7% soil samples were found to be deficient in OC, N, P, K, S and Zn, respectively. None of the soil samples were tested low in Cu, Fe, Mn and B. Exponential model was found as the best fit for considered soil parameters whereas, spherical model was found as the best fit for Mn. The best model was used to generate the spatial distribution maps. Spatial maps showed that the soil pH, EC, organic carbon, available N, P, K, S, Zn, Cu, Fe, Mn and B spatially varied and N, P, K, S and Zn were deficient in major areas. Therefore these maps are more useful for guiding site-specific field management for agricultural production and environmental protection. In addition, reduce the losses of nutrients and could be save time and money for fertilizers.
Key words: Geo-statistical, soil types, land use, semi-variogram, kriging, nutrient status.
INTRODUCTION
MATERIALS AND METHODS
Description study area
Geographical location of study area
Mandla district is located in the east-central part of the Madhya Pradesh, India covering an area of 8771 km2 and consists of a rugged high tableland in the eastern part of the Satpura hills. Geographically, Nainpur is located between 79°56’45.0” to 80°26’15.0” E longitudes and 22°17’31.0” to 22°37’30” N latitudes, having an area of 845.79 km2 of the total geographical area of district.
Climate
The climate of this district is characterized by hot summer season and general dryness except in the southwest monsoon season. May is the hottest month with the mean daily minimum temperature at 41.3°C and the mean daily minimum at 24°C (Figure 1).

Land use and cropping pattern
Land use map prepared by using Indian remote-sensing satellite-P6, linear imaging self-scanning satellite-III (IRS-P6, LISS-III) satellite imagery dated January-2014, October-2013 and April-2013. The satellite data has the characteristics of 23.5 m spatial resolution, four spectral channels green (0.52 to 0.59 µ), red (0.62 to 0.68 µ), NIR (0.77 to 0.86 µ), and SWIR (1.55 to 1.70 µ) and five days temporal resolution with 141 km swath. The statistics reveals area extent of land mainly under agricultural (46.37%), followed by dense forest (19.98%), open forest (9.79%), fallow land (9.23%) waste land- dense (3.22%) and waste land open scrub (6.53%) and others etc. Based on ground truth data collected from local agriculture departments and farmers interviewed, the rice and wheat are major food grain crops. Paddy, maize, kodo, kutki, soybean are important crops during Kharif season and wheat, pea, gram, lentil, and mustard crops during Rabi season in tribal areas of Mandla district (Figure 2).

Soil types
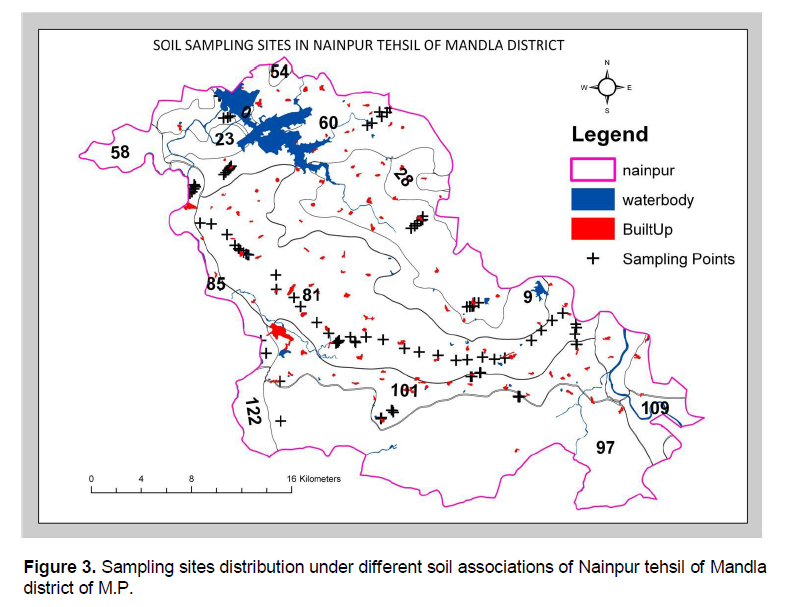
The survey of India topographical maps (1:50000) and the map of soil as a secondary data was used from NBSSLUP Nagpur. The highest area occupied under vertisols followed by inceptisols, entisols and alfisols. These soils are fine montmorillonitic, hyperthermic and having high swell shrink potential (Table 1 and Figure 3).

Soil sampling and analysis
Sampling sites were generated using land use and soil association maps. The sites decided randomly distributed over agricultural land of the study area by considering of topography and heterogeneity of the soil type. Field data collection and soil sampling were carried out by using GPS by navigating those points. One hundred fifty soil samples (0 to 15 cm) were collected from farmer’s field during the 2013 off season from the agricultural land. For each main sampling point, 1.0 kg of representative composite soil sample was collected and logged into properly labeled sample bag.
Laboratory analysis
Soil samples collected from the study area were dried and crushed with the help of wooden rod and passed through 2 mm sieve and then used for the determination of soil pH, electrical conductivity, organic carbon, calcium carbonate and macronutrients like N using Subbiah and Asija (1956), P using Olsen et al. (1954) and K content by adopting standard laboratory methods described in Jackson (1973) (Table 2).

Available micronutrients (Zn, Cu, Fe and Mn) were extracted by DTPA-CaCl2 solution and analyzed using atomic absorption spectrophotometer (Lindsay and Norvell, 1978). Hot water soluble boron in soil was analyzed by azomethine-H method as outlined by Berger and Truog (1939). The available sulphur was extracted by 0.15% CaCl2 solution and the concentration of sulphur was determined by the turbidimetric method using spectrophotometer (Chesnin and Yien, 1951).
Nutrient index calculation
The nutrient index (NI) values for available nutrients present in the soils were calculated utilizing the formula suggested by Parker et al. (1951) and classified this index as low (<1.67), medium (1.67 to 2.33) and high (>2.33).

Where: Nl, Nm and Nh are the number of soil samples falling in low, medium and high categories for nutrient status and are given weight age of 1, 2 and 3, respectively. Nt is the total number of sample.
Statistical and geo-statistical analysis
It is necessary to check whether the available contents of N, P, K and S and micronutrients in soil samples are approximately normally distributed or not because Kriging assumes the normal distribution for each estimated variable. A normal distribution was estimating based on skewness values and the variable datasets
having a skewness ranging between -1 and 1 were considered normally distributed. For non-datasets, a logarithmic transformation was performed to achieve a normal distribution for use in the next step of the statistical analysis.
Geo-statistical methods were used to analyze the spatial correlation structures of the available contents of N, P, K and S and micronutrients in soil and spatially estimate their values at unsampled locations using geo-statistical tool in GIS 9.3.1 software. The spatial dependency of selected soil parameters was analyzed using semi-variogram analyses with normalized data. Semi variogam analyses have been proven as an excellent approach to exploring the structure of spatial variogram in agricultural soils.
The above phenomena is the best accomplished studying the semivariogram (Warrick et al., 1986) which is a plot of semi-variance that characterizes the rate of change of a mapped variable with respect to distance. Semi-variogram ![]() is computed as half the average squared difference between the soil properties of data pairs. The structure of spatial variability was analyzed through semi-variograms (Figure 4).
is computed as half the average squared difference between the soil properties of data pairs. The structure of spatial variability was analyzed through semi-variograms (Figure 4).


A semi variogram was calculated for each soil property. The semi variance γ(h) is estimated as:

where N(h) is the number of data pairs within a given class of distance and direction, z(xi) is the value of the variable at the location xi and z(xi + h) is the value of the variable at a lag of h from the location xi.
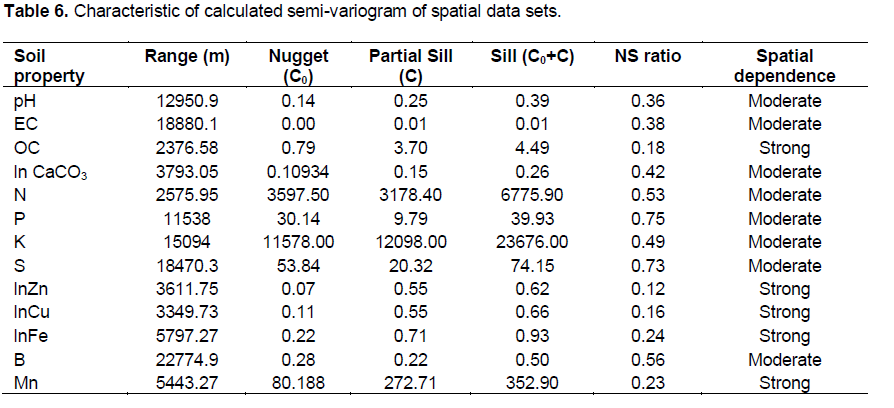
An experimental semi-variogram was calculated using the measured data. Next, this was generally fitted with a theoretical model, such as Exponential, spherical and Gaussian models (Goovaerts, 1999). Choice of the best-fitted model was based on the lowest residual sum of square (RSS) and the largest coefficient of determination (R2). The model provided information about the spatial structure as well as the input parameters (that is, nugget, sill and range) for the Kriging interpolation. Nugget is the variance at distance zero, sill is the semi- variance value at which the Semi-variogram reaches the upper bound after its initial increase, and range is a value (x axis) at which one variable becomes spatially independent.
The nugget to sill ratio was used to define different classes of spatial dependence for the soil properties (Emadi et al., 2008; Zuo et al., 2008). Nugget/sill ratio of 25%, 25 to 75% and >75% were classified as having strong, moderate and weak spatial dependence, respectively, according to Cambardella et al. (1994). Ordinary Kriging was used for the spatial interpolation because it is best at providing an unbiased prediction for specific unsampled locations and minimizing the influence of outliers (Tesfahunegn et al., 2011; Kavianpoor et al., 2012).
Evaluation criteria
Accuracy of the soil maps was evaluated through cross-validation approach (Davis et al., 1987; Santra et al., 2008). Among three evaluation indices used in this study, mean absolute error (MAE), and mean squared error (MSE) measure the accuracy of pre effectiveness of prediction. MAE is a measure of the sum of the residuals (e.g. predicted minus observed)(Voltz and Webster, 1990).

where z is the sample mean. If G = 100, it indicates perfect prediction, while negative values indicate that the predictions are less reliable than using sample mean as the predictors.
RESULTS AND DISCUSSION


CONCLUSIONS
CONFLICT OF INTEREST
The authors have not declared any conflict of interest.
REFERENCES
|
Agterberg FP (1984). Trend surface analysis. In Spatial Statistics and Models (eds Gaile, G. L. and Willmott, C. J.), Reidel, Dordrecht, The Netherlands pp. 147–171. Crossref |
||||
| Athokpam H, Wani SH, Kamei D, Athokpam HS, Nongmaithem J, Kumar D, Singh YK, Naorem BS, Thokchom RD, Devi L (2013). Soil macro- and micronutrient status of Senapati district, Manipur (India). Afr. J. Agric. Res. 8(39):4932-4936. | ||||
|
Berger KC, Truog E (1939). Boron determination in soils and plants. Ind. Eng.Chem. Anal. Ed.11: 540-545. Crossref |
||||
|
Cambardella CA, Moorman TB, Novak JM, Parkin TB, Karlen DL, Turco RF, Konopka AE (1994). Field scale variability of soil properties in Central Iowa soils. Soil Sci. Soc. Am. J. 58:1501–1511. Crossref |
||||
|
Cambule AH, Rossiter DG, Stoorvogel JJ, Smaling EMA (2014). Soil organic carbon stocks in the Limpopo National Park, Mozambique: amount, spatial distribution and uncertainty. Geoderma 213:46–56. Crossref |
||||
|
Cao SK, Chena KL, Cao GC, Zhang L, Ma J, Yang L, Lu BL, Chen L, Lu H (2011).The Analysis of Characteristic and Spatial Variability for Soil Organic Matter and Organic Carbon around Qinghai Lake. Procedia Env. Sci. 10:678 –684. Crossref |
||||
|
Chesnin L, Yien CH (1951). TurbidImetric determination of available suiphates. Soil Sci. Soc. Am. Proc. 15:149-151. Crossref |
||||
|
Davis BM (1987). Uses and abuses of cross-validation in geo-statistics. Math. Geol. 19:241–248. Crossref |
||||
| Eltaib SM, Amin, MSM, Hanfi MM, Sharif, ARM Wayayok A (2002). Spatial variability of N, P and K in rice field in Sawah Sempadan, Malaysia. Songklanakarin J. Sci. Technol. 24:321–328. | ||||
|
Emadi M, Baghernejad M, Maftoun M (2008). Assessment of some soil properties by spatial variability in saline and sodic soils in Arsanjan plain. Southern Iran. Pak. J. Biol. Sci. 11(2):238–243. Crossref |
||||
|
Ferreira V, Panagopoulos T, Andrade R, Guerrero C, Loures L (2015). Spatial variability of soil properties and soil erodibility in the Alqueva reservoir watershed. Solid Earth 6:383–392. Crossref |
||||
| Fraisse CW, Sudduth KA, Kitchen NR, Fridgen JJ (1999). Use of unsupervised clustering algorithms for delineating within Colfield management zones. ASAE Paper 993043, ASAE, Ontario, Canada. | ||||
|
Goovaerts P (1999). Geo-statistics in soil science: state-of-the-art and perspectives. Geoderma 89:1-45. Crossref |
||||
| Gore Yogita D, Nagaraju MSS, Srivastava R, Nasre RA (2012). Spatial variability of soil properties in basaltic terrain for Precision agriculture using geospatial techniques: a case study in savli village of Wardha district of Maharashtra. Proceeding of AIPA. | ||||
|
Hak-Jin K, Kenneth K, Sudduth A, Hummel JW (2009). Soil macronutrient sensing for precision agriculture. J. Environ. Monit.11: 1810-1824. Crossref |
||||
| Hillel D (1980). Fundamentals of Soil Physics. Academic Press, Inc., New York. | ||||
|
Huang B, Sun WX, Zhao YC, Zhu J, Yang RQ, Zhou Z, Ding F, Su JP (2007). Temporal and spatial variability of soil organic matter and total nitrogen in an agricultural ecosystem as affected by farming practices. Geoderma 139:336–345. Crossref |
||||
| Jackson ML (1973). Soil Chemical Analysis. Prentice Hall of India Pvt. Ltd., New Delhi. | ||||
|
Kavianpoor H, Esmali Ouri A, Jafarian Jeloudar Z, Kavian A (2012). Spatial variability of some chemical and physical soil properties in nesho mountainous rangelands. Am. J. Environ. Eng. 2(1):34-44. Crossref |
||||
|
Li XG, Li FM, Zed R, Zhan ZY, Singh B (2007). Soil physical properties and their relations to organic carbon pools as affected by land use in an alpine pastureland. Geoderma 15:98–105. Crossref |
||||
|
Lin JS, Shi XZ, Lu XX, Yu DS, Wang HJ, Zhao, YC, Sun, WX (2009). Storage and spatial variation of phosphorus in paddy soils of China. Pedosphere 19:790–798. Crossref |
||||
|
Lindsay WL, Norvell WA (1978). Development of a DTPA soil test for Zn, Fe, Mn and Cu. Soil Sci. Soc. Am. J. 42: 421-428. Crossref |
||||
|
Liu ZP, Shao MA, Wang YQ (2013). Spatial patterns of soil total nitrogen and soil total phosphorus across the entire Loess Plateau region of China. Geoderma 197–198, 67–78. Crossref |
||||
| Muhr GR, Datta NP, Shankara SN, Dever F, Lecy VK Donahue RR (1963). Soil Testing in India. USAID Mission to India. | ||||
| Nayak AK, Chinchmalatpure AR, Rao G, Khandelwal MK, Tyagi NK (2006). Spatial Variability of DTPA Extractable Micronutrients in the Soils of Bara Tract of Sardar Sarovar Canal Command in Gujarat. J. Indian Soc.Soil Sci.54(2):137-145. | ||||
| Nayanaka VGD, Vitharana WAU, Mapa RB (2010). Geo-statistical Analysis of Soil Properties to Support Spatial Sampling in a Paddy Growing Alfisol. Trop. Agric. Res. 22(1):34–44. | ||||
| Olsen SR, Cole CV, Vatanabe FS, Dean LA (1954). Estimation of available phosphorus in soil by extraction with sodium bicarbonate. Circ. U.S Dept. Agric. 939:1-19. | ||||
|
Page T, Haygarth PM, Beven KJ, Jones A, Butler T, Keeler C, Freer J, Owens PN, Wood GA (2005). The spatial variability of soil phosphorus GA in relation to topographic indices and important source areas: samples to assess the risks to water quality. J. Environ. Qual. 34: 2263-2277. Crossref |
||||
|
Parker FW, Nelson WL, Winter Eric, Miller LE (1951). The broad interpretation of soil test informations. Agron. J. 43:105-112. Crossref |
||||
|
Qu M, Li W, Zhang C (2014). Country-Scale Spatial Variability of Macronutrient Availability Ratios in Paddy Soils. Appl. Environ. Soil Sci. 3:1-10. Crossref |
||||
|
Ruffo ML, Bollero GA, Hoeft RG, Bullock DG (2005). Spatial variability of the Illinois soil nitrogen test: Implications for soil sampling. Agron. J. 97:1485-1492. Crossref |
||||
| Santra P, Chopra UK, Chakraborty D (2008). Spatial variability of soil properties and its application in predicting surface map of hydraulic parameters in an agricultural farm. Curr. Sci. 95(7):937-945. | ||||
| Sanyal SK, Dwivedi BS, Singh VK, Majumdar K, Datta SC, Pattanayak SK, Annapurna K (2015). Phosphorus in relation to dominant cropping sequences in India: chemistry, fertility relations and management options. Curr. Sci. 108:7-10 | ||||
| Shi Z, Li Y, Makeschine F, Wang RC (2005). Assessment of temporal and spatial variability of soil salinity in a coastal saline field. Environ Geo. 48:171-178. | ||||
| Singh D, Chhonkar PK, Dwivedi BS (2007). Manual on Soil, Plant and Water Analysis Westville Publishing House, New Delhi. | ||||
|
Šnajdr J, Valášková V, Merhautová V, Herinková J, Cajthaml T, Baldrian P (2008). Spatial variability of enzyme activies and microbial biomass in the upper layers of Quercus petraea forest soil. Soil Biol. Biochem. 40:2068–2075. Crossref |
||||
| Subbiah BV, Asija GL (1956). A rapid procedure for the determination of available nitrogen in soils. Curr. Sci. 25:259-260. | ||||
|
Tesfahunegn GB, Tamene L, Vlek Paul LG (2011). Catchment-scale spatial variability of soil properties and implications on site-specific soil management in northern Ethiopia. Soil Till. Res. 117:124–139. Crossref |
||||
|
Voltz M, Webster R (1990). A comparison of kriging, cubic splines and classification for predicting soil properties from sample information. J. Soil Sci. 41:473–490. Crossref |
||||
|
Wang YQ, Zhang XC, Zhang JL, Li SJ (2009). Spatial variability of soil organic carbon in a watershed on the Loess Plateau. Pedosphere 19:486-495. Crossref |
||||
| Warrick AW, Myers DE, Nielsen DR (1986). Geo-statistical methods applied to soil science. In: Methods of Soil Analysis, Part 1. Physical and Mineralogical Methods. Agronomy Monograph 9(2):53–82. | ||||
| Wasiullah AU, Bhatti KF, Akmal M (2010). Spatial variability and geo-statistics application for mapping of soil properties and nutrients in semi arid district Kohat of Khyber Pakhtunkhwa (Pakistan). Soil Environ. 29(2):159-166. | ||||
| Webster R, Oliver MA (2001). Statistical Methods in Soil Science and Resource Survey. Oxford University Press, New York, NY. | ||||
|
Weindorf DC, Zhu Y (2010). Spatial variability of soil properties at Capulin Volcano, Mew Mexico, USA: implications for sampling strategy. Pedosphere 20:185–197. Crossref |
||||
| Yang Y, Yang J (2005). The trend variability of soil organic matter content in the salinity region of Yucheng city in Shandong Province. Chin. J. Soil Sci. 36(5):647-651. | ||||
|
Zuo X, Zhao H, Zhao X, Zhang T, Guo Y, Wang S, Drake S (2008). Spatial pattern and heterogeneity of soil properties in sand dunes under grazing and restoration in Horqin Sandy Land. Northern China. Soil Till. Res. 99:202–212. Crossref |
||||
Copyright © 2024 Author(s) retain the copyright of this article.
This article is published under the terms of the Creative Commons Attribution License 4.0


