ABSTRACT
This study aims to evaluate the growth and development of sugarcane under different supplemental irrigation depths. Irrigation treatments were 0.30, 0.60, 0.90 and 1.2 rate of crop evapotranspiration (ETc) and the control (no irrigation). The experimental design was a randomized complete block with six replications. The highest yield was ratoon cane with 190 t ha-1 in the treatment 0.6 of ETc. The difference between the highest and lowest yield were 11 and 7% in plant cane and ratoon cane, respectively. The rate of maximum technical efficiency of yield was 0.78 of ETc. Irrigation water productivity and water productivity was obtained in 35.8 to 146.0 kg m-3 and 18.0 to 70.9 kg m-3, respectively. The total mass and the dry mass showed increase of 20 and 25% in ratoon cane, respectively. The plant height showed no difference between treatments. The highest: number of tillers, leaf area and number of green leaves was treatment 1.2 of ETc. The deficit and excess moisture affect plant development, plant height, leaf area, stem diameter, number of tillers per meter, full mass and dry mass, affects the yield of sugarcane.
Key words: Saccharum, drip irrigation, water deficit, strategies for efficient irrigation, sugarcane.
The sugarcane is one of the most significant crop worldwide, cultivated over 100 countries, and it is considered an important source of jobs in rural areas. Brazil, India, China, Mexico, Thailand, Pakistan, Colombia, Australia, Indonesia, and United States of America hold about 80% of sugarcane production (FAO, 2008). In Brazil, sugarcane is the third crop in terms of cultivated area (9.0045 million of hectares), with an average of production of 71.31 t ha-1. The Southern region has cultivated sugarcane in 0.636 million of hectares (7% of national sugarcane area), and the Southern of Rio Grande do Sul state grows sugarcane in 0.014 million of hectares (2.2% of Brazil sugarcane area), with a production average of 55.22 t ha-1 (CONAB, 2014). Moreover, sugarcane has great socioeconomic importance, provides feedstock to the sugarcane industry for the production of alcohol (hydrous and anhydrous), sugar, brandy, bioplastic, biodiesel, kerosene, fertilizers, paper, animal feeding, and the sugarcane bagasse has been used as an energy source (electricity) (Souza et al., 1999).
The water deficit is the main factor in yield decrease in most crops worldwide (Bray et al., 2000). Strategies for the management and efficient use of irrigation water are the keys for the sustainability and profitability of crops, yet it is the great importance to improve yield and quality, reduce costs, and maximize water use (Padrón et al., 2015a). Thereby, knowing how crops respond to abiotic stresses is a prerequisite to choose the best variety, management strategies, and the use of natural resources (Smit and Singels, 2006).
Sugarcane yield is limited by edaphoclimatic factors such as water and nitrogen deficiency (Gava et al., 2011). Moreover, sugarcane growth and development are directly related to evapotranspiration, and water availability is considered the main factor that causes production variability (Dalri, 2004). According to Inman-Bamber (2004), the duration of water deficit negatively affects leaf production and increases leaf senescence of whole plant, yet it may reduce light interception, water use efficiency, photosynthesis, as well as increase transmitted radiation to the soil surface. Furthermore, the amount of water consumed daily by sugarcane depends on the variety, growth stage, and evapotranspiration demand, which varies according to the region and season of the year (Bernardo, 2006). Although some regions have high precipitation rates, its irregular distribution may sometimes prevent plant growth (Ometto, 1980). Therefore, the management of irrigation water is essential to maximize yield, growth, stem density, leaf area index, increase sugar content, sugarcane life, and the farmer profits (Bernardo, 2006; Neto et al., 2006; Dalri et al., 2008; Farias et al., 2008a).
The evaluation of the phenology behavior provides knowledge and definition of the period that each vegetative phase occurs, and may help in the choice of management strategies, such as the best harvesting and planting time (Larcher, 2004). Sugarcane crop can tolerate some water deficit, however it highly responds to irrigation management (Singh et al., 2007). Effective management of water resources is the key to the sustainability and profitability of the crop, thus encouraging the development of new techniques for the analysis and efficient water management (Padrón el al., 2015b).
Thereby, the aim of this study was to evaluate the growth, development, and sugarcane yield submitted to different irrigation levels as an additional source of water for efficient use of irrigation water.
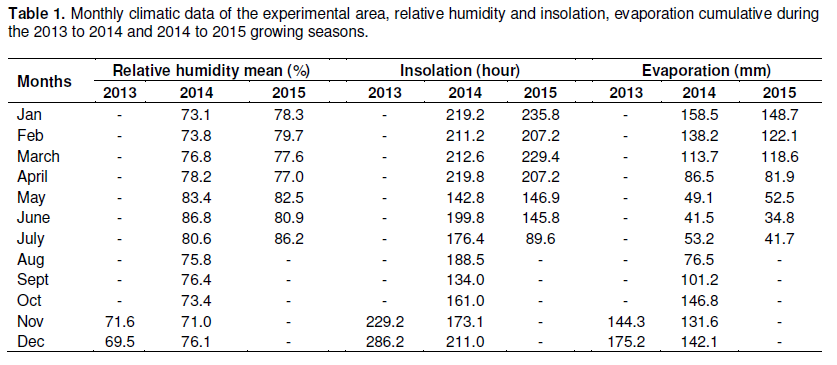
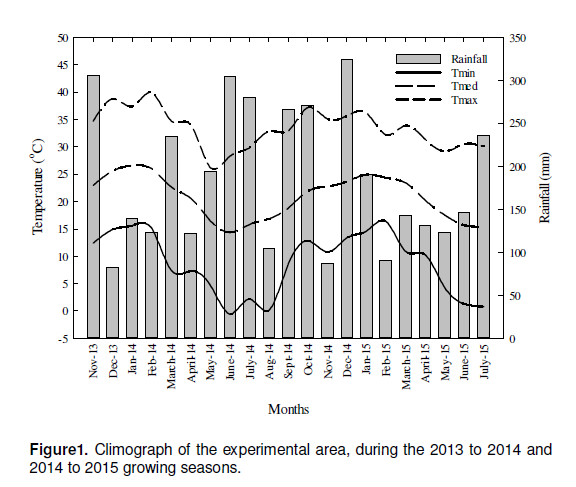
This field study was conducted at the experimental area of the Polytechnic School of the Federal University of Santa Maria (altitude of 110 m, and 29°41'25" S, and 53°48'42" W), during the Spring-Summer seasons of 2013 to 2014 and 2014 to 2015. The soil is classified as typical dystrophic yellow argissolo, with a loam texture. The climate of the region, according to the Köppen classification is subtropical humid (Cfa). During the both growing seasons, air relative humidity ranged (69.5 to 86.8%), insolation (134 to 286.2 h), and evapotranspiration (41.5 to 175.2 mm; Table 1). The precipitation, maximum, minimum, and average temperatures are shown in Figure 1. In the growing season 2013 to2014 and 2014 to 2015, minimum, average, and maximum temperatures were 0.6, 21.2, 40.0, 0.1°C, 20.5 and 37.2°C respectively, with greater variation in the first growing season. Maximum and minimum precipitation occurred in November and June, and December, respectively in the 2013 to 2014 growing season. In the second growing season, maximum and minimum precipitation occurred in December and November, respectively.
Treatments (0.3, 0.6, 0.9 and 1.2 of crop evapotranspiration) and a control treatment (rainfed) were arranged in a randomized complete block design with six repetitions. Each experimental unit had 20 m2 (4x5m), and 600 m2 of total experiment area, with plants on the edge. We used the variety RB93-5581, planted on November 14, 2015, row space of 1m, and continuous distributions of stems (3 to 4 buds per stem, totalizing 18 buds per meter) inside the furrow. The harvest occurred on 20 July 2014 and 8 June 2015 in the first and second growing season, respectively. In order to reduce experimental errors, sugarcane stems were divided into top, middle, and bottom parts, and each part was planted in two blocks.
Drip irrigation system was used, with drippers spaced 0.2 m and a flow rate of 0.8 L h-1. In each experimental unit was installed a gate valve and a pressure control valve in order to control irrigation time and obtain regular pressure, respectively. Moreover, irrigation system uniformity and soil wetted volume tests were performed, following the results reported by (Padrón et al., 2015c). From day one up to 29 days after planting, water management was performed based on 1.0 of evapotranspiration for all treatments in order to have uniform emergence of the sugarcane. Subsequently, the irrigation treatments were started, performed every seven days and irrigation was finished 30 days before harvest.
The reference evapotranspiration was calculated on a daily scale, based on this results, different percentages were applied to set the irrigation by the formula of Penman-Monteith/FAO (Equation 1), and the crop evapotranspiration at a standard condition (Equation 2) (Allen et al., 1998). Climate data were obtained from the weather station of the Federal University of Santa Maria, National Institute of Meteorology, localized approximately 2000 m from the experimental area. Precipitation (mm), maximum and minimum temperature (°C), maximum and minimum air relative humidity (%), insolation (hours) and wind speed (m s-1) were collected daily.
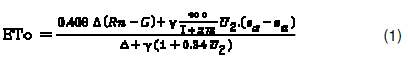
where ETo is the reference evapotranspiration (mm day-1), Rn, G, and T are net radiation value at crop surface (MJ m-2 day-1), soil heat flux density (MJ m-2 day-1), and daily mean air temperature at 2 m height (°C), respectively. Also, u2, es ea, (es - ea), Δ and γ represent wind speed at 2 m height (m s-1), saturation vapor pressure (kPa), actual vapor pressure (kPa), saturation vapor pressure deficit (kPa), slope of the saturation vapor pressure curve (kPa/°C) and psychrometric constant (kPa/°C), respectively.
Where ETc crop evapotranspiration (mm), kc single crop coefficient and ETo reference crop evapotranspiration (mm). Single crop coefficient values used were: Kcini= 0.40-25 day; Kcmed= 1.25-70 day and Kcfin= 0.75-50 day (Allen et al., 1998).
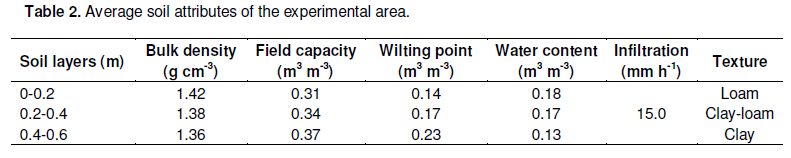
Soils parameters such as chemical analysis, texture, the apparent density of soil, field capacity, and infiltration test were performed (Table 2) (Padrón et al., 2015c). Fertilizers were applied according to the chemical analysis of the soil and crop requirements to obtain a production of 80 to 100 t ha-1. Moreover, 3.5 t ha-1 of lime was applied (Broadcast on the soil surface and disked) to correct soil pH.
The number of tillers was evaluated monthly, by counting in a linear meter. Samplings were performed in the central rows, evaluating 2 meters per row and three rows per experimental unit (six meters per plot). Plant height, number of green leaves, and leaf area were evaluated monthly on six randomized plants per plot, marked along the experiment. Plant height was measured from the base of soil up to leaf A+1, with a measuring tape. The number of green leaves was determined by counting fully expanded leaves, with a minimum of 20% of green area, counted from the leaf A+1. The leaf area was calculated using the methodology determined by Hermann and Câmara (1999) (Equation 3), numbering the leaves of each plant according to Kuijper and Van Dillewijn (1952). Measurements were performed by counting green leaves and with the long and width of the leaf+3, at the mid part. In each plot, leaf area was determined by the multiplication of the number of tillers in a linear meter.

where: LA – Leaf area; C – Length of +3 leaf (m); L – Width of +3 leaf (m); 0.75 - correction factor for crop leaf area; N - number of open leaves with at least 20% of green area; 2 - correction factor. The total mass and dry matter content were determined in both harvests by selecting six randomized plants in each experimental unit. To determine total mass, plants were divided into top, leaves, and stem parts, measured individually using an analytical scale.
Subsequently, each stem was identified; juice extraction performed with a sugarcane mill machine, and the juice volume of each stem was measured using a graduated cylinder of 1000 ml. The bagasse mass, top, and plant leaves were oven dried at 75°C for 72 h, or until they reached a constant mass. Ten randomized plants per plot were used to determine sugarcane yield by measuring the base diameter (between first and second node from bottom) and stem height, with a graduated ruler and a Pocotest micrometer, respectively. The total yield of each experimental unit was determined according to Landell and Silva (2004) (Equation 4)
where: TSH – Tons of sugarcane per hectare (t ha-1); D – Base stem diameter (mm); C – Number of stem per linear meter; H – Stem height (m); E – Row space (m); 0.007854 – Correction factor.
Water productivity (WP) and irrigation water productivity (IWP) were calculated with the fresh total yield (kg ha-1) divided by crop evapotranspiration (ETc) Equation 5 and total irrigation water applied Equation 6, respectively (Padrón et al., 2015c).
Weeds were controlled either by herbicides application or by manual pulling. Moreover, insecticides and fungicides were used to control insect pests and diseases, respectively. Statistical analysis were performed using the SPSS software package (SPSS V17.0).
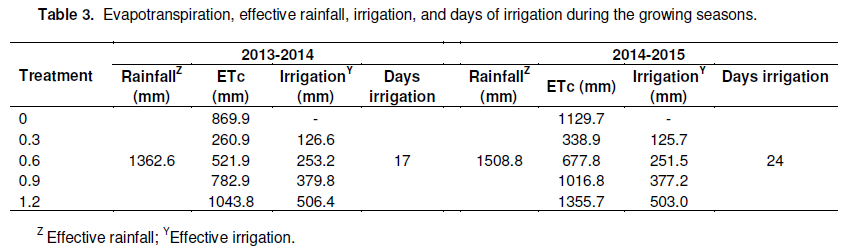
Evapotranspiration, effective rainfall, irrigation applications and days of irrigation are shown in Table 3. The cycle of sugarcane in the growing season 2013 to 2014 and 2014 to 2015 was 237 and 323 days, respectively, with a difference of 86 days. The evapotranspiration, precipitation, and days of irrigation were greater in the 2014 to 2015 growing season, with a difference of 312 mm, 147 mm, and 7 days, respectively. These differences might be attributed to the climate conditions of the region and crop cycle of the crop, once the irrigation levels were similar.
Dalri and Cruz (2008) studying ratoon cane reported that 26 irrigations were necessary, with a level of 520 mm for the growth period of the crop, performed on an average of 13.1 days. Yet, for the second ratoon cane 37 irrigations (740 mm for the life cycle), performed every 13.1 (average) days were necessary.
The study results are similar to those found by Nogueira et al. (2016), who determined the water demand for sugarcane production for a historic period of 20 years, using supplementary irrigation in Santa Maria-RS, (average of 645 mm and evapotranspiration of 1,310.75 mm). Several studies have demonstrated similar values of water demand in sugarcane: Neto et al. (2006) 1,164.0 mm; Almeida et al. (2008) 1,584.0 mm; Alves et al. (2008), 1,105.7 mm; Gava et al. (2011) for plant cane (1,095.0 mm) and ratoon cane (1,121.0 mm) and Silva et al. (2011), 1,710.0 mm for the whole cycle of production.
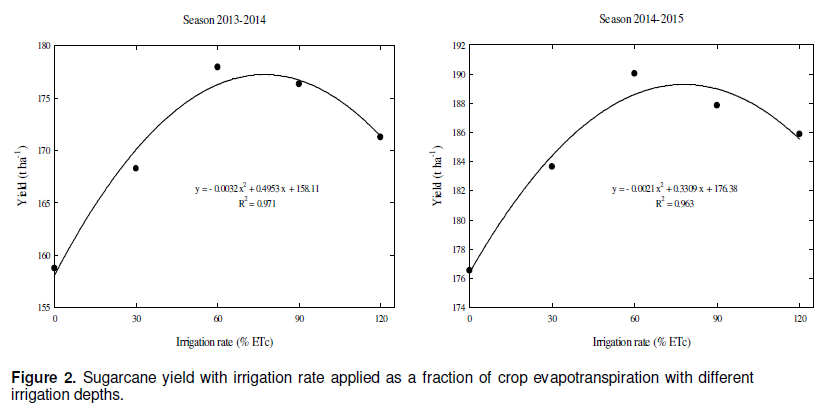
The relationship between yield and irrigation rates is shown in Figure 2. No significant results were found for the treatments in the same year; however, a significant difference at 5% of probability level was found between the years, which the second growing season had a greater yield. The difference between greater and lower yield in the first and second growing season was 11 and 7%, respectively. The maximum yields were 177.3 and189.4 t h-1, with a 0.77 and 0.79 of crop evapotranspiration in the first and second growing season, respectively.
Moreover, the maximum technical efficiency in yield were 177.3 and 189.4 t h-1, with 0.77 and 0.79 of evapotranspiration in the first and second growing season, respectively. The second crop cycle had an increase in yield (6.4%) and evapotranspiration (1.4%) when compared to the first crop cycle, being attributed to a longer life cycle.
Nogueira et al. (2015) studied 11 sugarcane varieties in Santa Maria-RS (dryland cropping system), had a minimum and maximum plant cane yield of 27.22 to66.30 t ha-1, and ratoon cane yield of 35.3 to 149.22 t ha-1, respectively. This small difference may be influenced by the row space (1.4 m) and varieties used. Raskar and Bhoi (2003) studied plant cane and ratoon cane found that yield with 0.9 m row space was significantly greater when compared to 0.3 and 0.6 m row space. Dalri et al. (2008) reported an increase in yield (48.57%) in treatments submitted to irrigation compared to rainfed treatments. Júnior et al. (2012) applying fertigation, reported an increase (49.5 t ha-1; 33%) in irrigated conditions compared to rainfed treatments. Furthermore, Gava et al. (2011) studying three varieties, plant and ratoon cane with drip irrigation system reported an increase in yield of 20 and 28%, respectively. Similar yield results comparing irrigation and rainfed treatments were reported by Neto et al. (2006), Dalri and Cruz (2008) and Farias et al. (2008b).
Sánchez-Román et al. (2015) studying different water depths had highest yields with water replacement of 100% of field capacity. Wiedenfeld and Enciso (2008) studied different water managements and did not increase yield with water depths below the soil water storage capacity. Moreover, Vieira et al. (2014) reported that yield increased when water applied is increase with a maximum value of 112.3 t ha-1 (150% of evapotranspiration and of 1,537.2 mm; rainfall and irrigation). Yet, Farias et al. (2009) had sugar yield per unit area of less than 12.99 t ha-1, with a total irrigation level of 1.221 mm (precipitation + irrigation), which corresponds to 100% of evapotranspiration. Oliveira et al. (2014) reported that 100% of water replacement increased productivity by 40% when compared with drought-stricken area management (water replacement of 0%) of 178 t ha-1, and maximum curve peak had gross alcohol yield of 25.34 m3 ha-1, obtained with 79.7% of water replacement.
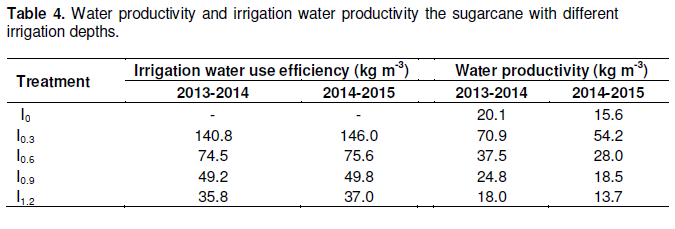
Carvalho et al. (2014) reported that an irrigation depth of 75% of evapotranspiration in ratoon cane increased (21.34%) when compared to 50% of evapotranspiration. Conversely, irrigation depth of 100% of evapotranspiration reduced yield by 53.4%. Water productivity and irrigation water productivity are shown in Table 4. Water productivity (WP) and irrigation water productivity (IWP) decreased as irrigation rates increased. The IWP was greater in the second growing season due to weather conditions and increase in yield. Conversely, WP was lower in the second growing season affected by the crop cycle. In both growing seasons, the IWP was similar, being attributed to the same irrigations levels, temperature variation, and evapotranspiration. Moreover, the WP was lower (both growing seasons) in the treatment of 1.2 of evapotranspiration, being similar to the rainfed treatment.
Oliveira et al. (2011a) reported an increase in water use efficiency (69.8% on average) when comparing rainfed and irrigated treatments, obtaining values of 70.1 kg m-3 and 140.3 kg m-3, respectively. Doorembos and Kassam (1994) reported that sugarcane under irrigated conditions in the dry tropics and subtropics, in soils with 80% of available water, might yield between 5 to 8 kg m-3. Farias et al. (2008b) determined the WP with the total volume of water applied (rainfall + irrigation), and found a difference of 3.23 kg m-3 between sugarcane treatments submitted to 100% of evapotranspiration (7.22 kg m-3) and rainfed (3.99 kg m-3) .
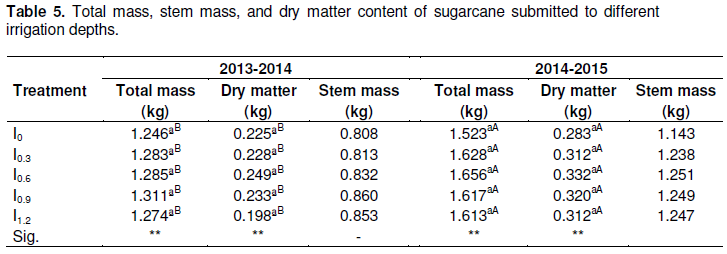
The total mass, stem mass, and dry matter content are shown in Table 5. No significant differences were found between the treatments, however, significant results were found between the growing seasons, with highest values for ratoon cane. The greater values for total mass were found in the treatments of 0.9 and 0.6 (cane plant and ratoon cane, respectively), an increase of 20% for ratoon cane. The dry mass content was greater in both growing season for the treatment of 0.6, with an increase of 20% for ratoon cane. The treatment of 0.9 (0.860 kg) and 0.6 (1.251 kg) had greater stem mass in the first and second growing season, respectively.
The study results are similar to those found by Neto et al. (2006), who studied levels of irrigation and nitrogen dose associated with potassium in ratoon cane, and concluded that growth parameters and the quality of ratoon cane were more influenced by fertilization than by irrigation. Yet, the same authors reported an average stem weight for the highest and lowest dose of fertilizer applied of 1,077.50 and 918.42 g, respectively. Moreover, Azevedo (2002) reported a mean weight of 917.00 g per stem in sugarcane plant. Likewise, Silva (2002) studying irrigated sugarcane under different fertilizer levels, reported an average stem weight of 1,384.17 g.
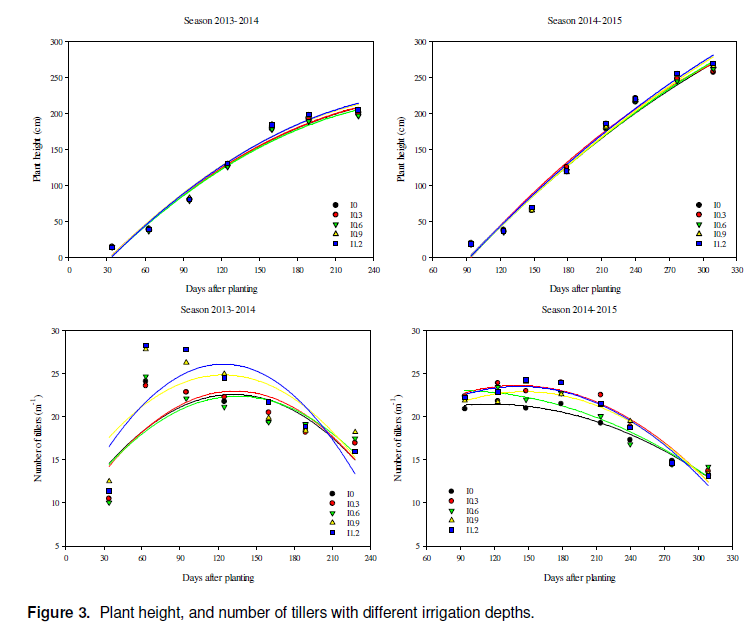
Plant height and number of tillers are shown in Figure 3. These variables did not differ between treatments, but had interaction between the years of study, having the highest value for ratoon cane. Maximum plant height was 269.5 and 205 cm in plant cane and ratoon cane, respectively, in the treatment submitted to 0.9 of evapotranspiration. The difference between maximum and minimum height was 3% for the plant cane and 5% for ratoon cane, (increased 24.1% over the seasons), which might be influenced by the crop cycle.
Neto et al. (2006) reported an average plant height of 227 and 196 cm for ratoon cane submitted to different doses of fertilizer. Moura et al. (2005) studied ratoon cane under different irrigation levels, reported that irrigation increased plant growth (25%) when compared to the rainfed treatments (2.34 and 1.87 m, respectively). Oliveira et al. (2011b) studied different varieties of sugarcane, fertilizer doses, and water deficit found that plant height (average of 3.083 m) did not have a significant difference between treatments. Yet, the average stem height was 359.1 cm (Carmo et al., 2010). Silva et al. (2008) analyzing plant cane growth found values of 280.7 cm, whereas, Farias et al. (2008a) studying the same variety in irrigated and rainfed system, reported that cane plant growth stabilized after 193.85 days (irrigation condition; height of 152. 80 cm), and 236.20 days (rainfed; height of 148.19 cm). Souza et al. (2015) reported that increasing irrigation level to 100% of evapotranspiration increased plant height when compared to the rainfed treatments, yet with total irrigation depths of 1, 177.33 and 568 mm, plant height were 2.66 m and 1.99 m, respectively.
The highest number of tillers per meter was 28 in plant cane, at 63 days after planting and 24 in ratoon cane (148 days after cutting) in the treatment I1.2. The lowest value was in the rainfed treatment, cane plant (23 tillers) and ratoon cane (21 tillers). At harvest of each cycle, the greatest number of tillers (18) in plant cane (treatment I0.9) and 14 in ratoon cane (treatments I0.6 and I1.2).
The lowest were 16 and 13 in the plant cane and ratoon cane, respectively. Watering early in the cycle increased the number of tillers, and at the end of the sugarcane cycle, the excess of moisture affects development. Thereby, Carmo et al. (2010) reported that in early development, under irrigated system and high availability of solar radiation, there is an intense tillering at the beginning of the cycle since there is water, energy, and space for plant growth. Yet, the number of tillers was greater at the beginning of sugarcane cycle, but fell abruptly when the culture demonstrated a tendency toward stabilization in the number of tillers, which occurred about 327 days after cutting.
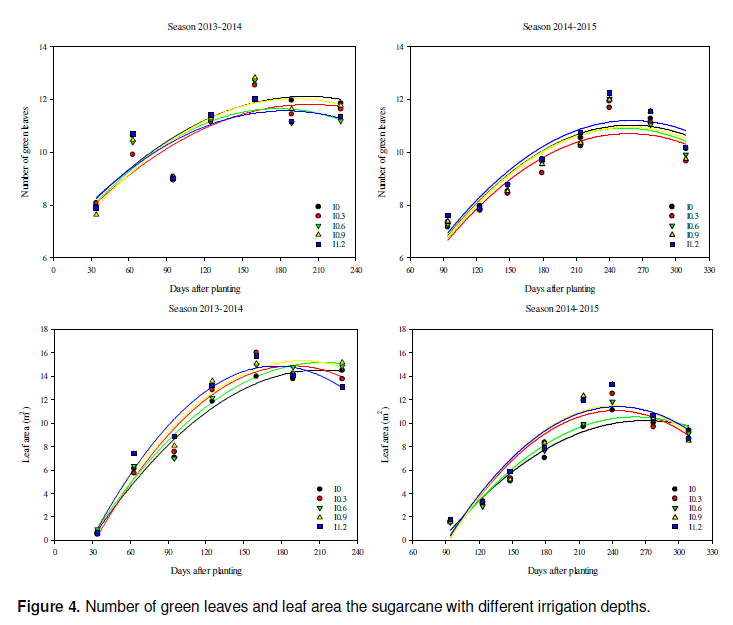
The number of green leaves and leaf area are shown in Figure 4. The largest number of green leaves (13 in plant cane) was at 160 days after planting (treatment I0.9), and it was 12 green leaves in ratoon cane, at 240 days after cutting (I1.2 treatment). At each harvest cycle, the number of green leaves demonstrated homogeneity in all treatments, with values of 11 to 12 and 10 in plant cane and ratoon, respectively. No significant effect of irrigation was observed for the number of green leaves, yet it was greater for plant cane. Silva et al. (2015) highlight that the mature sugarcane has a number of green leaves per plant around ten, depending on the variety and growing conditions. Pincelli (2010) states that the variable number of green leaves is important because through this we can observe the photosynthetic efficiency of the plant in advance of the stresses (deficit or water excess). In addition, Machado et al. (2009) observed that water deficit causes leaf senescence and restriction to the emergence of new leaves. However, the degree of these changes is due to the intensity of water stress and depends on the genotype (Smit and Singels, 2006).
The irrigation treatments influenced leaf area and leaf development in both growing seasons. The treatment I1.2 had the greatest development at the beginning of the cycle and decrease towards the end. Conversely, rainfed treatments had reduced development at the beginning and increase towards the end. The rate of the plant and ratoon cane growth were 7.5 dm2 day-1 and 3.6 dm2 day-1, respectively. There was a decrease in both growing seasons, by 15% in the development of the crop, and 33% at harvest, being the ratoon cane lower. Silva et al. (2015) reported similar results with great values to the plant cane.
Machado et al. (2009) found that for irrigation purposes, the period of greatest susceptibility to water deficit is the rapid development of the crop. At this time, the plants have great leaf area and require more water to make the gas exchange with the atmosphere (Pires et al., 2008). Farias et al. (2008a) reported that leaf area ranged significantly over the growing season for rainfed sugarcane, with a maximum leaf area of 5,168.04 dm2 (at 166.68 days and growth rate of 31.00 dm2 d-1).
In addition, the sugarcane cultivated under irrigated conditions reached the point of maximal leaf area (5,359.65 dm2) at 152.63 days (growth rate of 35.11 dm2 d-1). Souza et al. (2015), reported the greatest leaf area was obtained in the treatment submitted to 100% of evapotranspiration (LA = 2,461.62 cm2). According to the climatic conditions of the region, comparing rainfed and irrigated sugarcane, there was an increase in sugarcane yield under irrigation system, thereby justifying investments in irrigation system as a supplementary strategy for the agriculture.
Furthermore, studies on optimizing water resources and maximization of crop yields ensuring economic returns in agriculture are necessary. The deficit and the excess of moisture affect the vegetative development of sugarcane, affecting plant height, leaf area, stem diameter, the number of tillers per meter, total and dry mass content, which might have negative effects on sugarcane yield. Moreover, the experimental design adopted for planting sugarcane, dividing the stem in the tip, mid and base parts, reduced experimental errors and homogenized the blocks. Yet, stem tip had highest emergence and development at initial phase and middle part stem had the greatest development at the end of the cycle in the first growing season, and no differences were observed for ratoon cane.
The irrigation affects positively the vegetative growth of sugarcane, increasing plant height, stem diameter, the number of tillers per meter, and leaf area. The determination of the evapotranspiration rate increases yield, ensuring the efficient use of irrigation water and the profitability of the crop. The irrigation rate of 78% of evapotranspiration as an irrigation strategy for sugarcane production might be adopted to obtain stable yields.
The author has not declared any conflict of interests.
The author thank the Polytechnic School of the Federal University of Santa Maria for their support.
REFERENCES
|
Allen RG, Pereira LS, Raes D, Smith M (1998). Crop evapotranspiration: guidelines for computing crop water requirements. FAO-Irrigation and Drainage Paper 56, Rome: FAO 323 p.
|
|
|
|
Almeida ACS, Souza JL, Teodoro I, Barbosa GVS, Moura Filho G, Ferreira Júnior RA (2008). Desenvolvimento vegetativo e produção de variedades de cana-de-açúcar em relação à disponibilidade hídrica e unidades térmicas. Ciênc. Agrotecnol. 32(5):1441-1448.
Crossref
|
|
|
|
|
Alves MJF, Andrade SJ, Menezes EP, Alcântara LM (2008). Quantificação da demanda hídrica da cana-de-açúcar (variedades RB 83-5486; RB 86-7515; SP 79-1011 e SP 81-3250) na região de Ituiutaba - MG. Rev. Intercursos 7(1):43-48.
|
|
|
|
|
Azevedo HM (2002). Resposta da Cana-de-açúcar a níveis de irrigação e de adubação de cobertura nos tabuleiros costeiros da Paraíba. 112 f. Tese (Doutorado em Recursos Naturais) - Curso de Pós-graduação em Recursos Naturais, Universidade Federal de Campina Grande, Paraíba.
|
|
|
|
|
Bernardo S (2006). Manejo da irrigação na cana-de-açúcar. Rev. Alcoolbrás 106:72-80.
|
|
|
|
|
Bray EA, Bailey-Serres J, Weretilnyk E (2000). Response to abiotic stress. In: Buchanan BB, Gruissem W, Jones RL (Eds). Biochemistry and molecular biology of plants. Rockville: American Society of Plant Physiologists. 1158-1203.
|
|
|
|
|
Carmo JFA, Moura MSB, SILVA TGF, Campos CO, Brandão EO, Soares JM (2010). Análise biométrica da cana-de-açúcar irrigada em relação aos graus-dia acumulados no Submédio do São Francisco. Embrapa Semiárido, Petrolina, Pernambuco.
|
|
|
|
|
Carvalho JJ, Bastos AVS, Souza KB, Oliveira RC, Favareto R, Teixeira MB (2014). Viabilidade Econômica da Cana-de-Açúcar, sob Diferentes Lâminas de Irrigação no Sudoeste Goiano. II INOVAGRI International Meeting, Fortaleza.
Crossref
|
|
|
|
|
CONAB, COMPANHIA NACIONAL DE ABASTECIMENTO (2014). Acompanhamento da safra brasileira: Cana-de-açúcar, terceiro levantamento, Safra 2014/2015, Dezembro/2014. Brasília.
|
|
|
|
|
Dalri AB (2004). Avaliação da produtividade da cana-de-açúcar irrigada por gotejamento subsuperficial nos três primeiros ciclos. 89 f. Tese (doutorado) - Universidade Estadual Paulista "Júlio de Mesquita Filho", Faculdade de Ciências Agronômicas, Botucatu: São Paulo.
|
|
|
|
|
Dalri AB, Cruz RL (2008). Produtividade da cana-de-açúcar fertirrigada com N e K via gotejamento subsuperficial. Rev. Engenharia Agríc. 28(3):516-524.
Crossref
|
|
|
|
|
Dalri AB, Cruz RL, Garcia CJB, Duenhas LH (2008). Irrigação por gotejamento subsuperficial na produção e qualidade de cana-de-açúcar. Irriga 13(1):1-11.
|
|
|
|
|
Doorembos J, Kassam AH (1994). Efeito da água no rendimento das culturas. Estudos FAO. Irrigação e drenagem 33:306.
|
|
|
|
|
FAO - Food and Agriculture Organization of the United Nations (2008). FAOSTAT, Rome. Disponível em: http://faostat.fao.org/ Acesso em: 03 dez. 2015.
|
|
|
|
|
Farias CHA, Fernandes PD, Azevedo HM, Neto JD (2008a). Índices de crescimento da cana-de-açúcar irrigada e de sequeiro no Estado da Paraíba. Rev. Bras. Engenharia Agríc. Ambient. 12(4):356-362.
|
|
|
|
|
Farias CHA, Fernandes PD, Neto JD, Gheyi HR (2008b). Eficiência no uso da água na cana-de-açúcar sob diferentes lâminas de irrigação e níveis de zinco no litoral paraibano. Rev. Engenharia Agríc. 28(3):494-506.
Crossref
|
|
|
|
|
Farias CHA, Fernandes PD, Gheyi HR, Neto JD (2009). Qualidade industrial de cana-de-açúcar sob irrigação e adubação com zinco, em Tabuleiro Costeiro paraibano. Rev. Bras. Engenharia Agríc. Ambient. 3(4):419-428.
|
|
|
|
|
Gava, GJC, Silva MA, Silva RC, Jeronimo EM, Cruz JCS, Kölln OT (2011). Produtividade de três cultivares de cana-de-açúcar sob manejos de sequeiro e irrigado por gotejamento. Rev. Bras. de Engenharia Agríc. Ambient. 15(3):250-255.
|
|
|
|
|
Hermann ER, Câmara GMS (1999). Um método simples para estimar a área foliar de cana-de-açúcar. Revista da STAB, Açúcar, Álcool e Subprodutos 17:32-34.
|
|
|
|
|
Inman-Bamber NG (2004). Sugarcane water stress criteria for irrigation and drying off. Field Crops Res. 89(1):107-122.
Crossref
|
|
|
|
|
Júnior ASA, Bastos EA, Ribeiro VQ, Duarte JAL, Braga DL, Noleto DH (2012). Níveis de água, nitrogênio e potássio por gotejamento subsuperficial em cana-de-açúcar. Pesqui. Agropecuária Bras. 47(1):76-84.
Crossref
|
|
|
|
|
Landell MGA, Silva MA (2004). As estratégias de seleção da cana em desenvolvimento no Brasil. Visão Agríc. 1:18-23.
|
|
|
|
|
Larcher W (2004). Ecofisiologia vegetal. São Carlos, SP: RiMa 531 p.
|
|
|
|
|
Machado RS, Ribeiro RV, Marchiori PER, Machado DFSP, Machado EC, Landell MGA (2009). Respostas biométricas e fisiológicas ao deficit hídrico em cana-de-açúcar em diferentes fases fenológicas. Pesqui. Agropecuária Bras. 44(12):1575-1582.
Crossref
|
|
|
|
|
Moura MVPS, Farias CHA, Azevedo CAV, Neto JD, Azevedo HM, Pordeus RV (2005). Doses de adubação nitrogenada e potássica em cobertura na cultura da cana-de-açúcar, primeira soca, com e sem irrigação. Ciênc. Agrotecnol. 29(4):753-760.
Crossref
|
|
|
|
|
Neto JD, Figueredo JLC, Farias CHA, Azevedo HM, Azevedo CAV (2006). Resposta da cana-de-açúcar, primeira soca, a níveis de irrigação e adubação de cobertura. Revista Brasileira de Engenharia Agrícola e Ambiental. 10(2):283-288.
Crossref
|
|
|
|
|
Nogueira HMCM, Nogueira CU, Fantinel AL, Müller I, Hoffmann R, Padrón RAR (2015). Avaliação da produção e resistência à geada de cultivares de cana-de-açúcar. Espacios 36(24):15.
|
|
|
|
|
Nogueira HMCM, Peiter MX, Padrón RAR, Kopp LM, Bem LHB, Vivan GA, Nogueira CU (2016). Produção e demanda hídrica da cana-de-açúcar sob lâminas de irrigação suplementar. Espacios 37(7):17.
|
|
|
|
|
Oliveira ECA, Freire FJ, Oliveira AC, Simões Neto DE, Rocha AT, Carvalho LA (2011a). Produtividade, eficiência de uso da água e qualidade tecnológica de cana-de-açúcar submetida a diferentes regimes hídricos. Pesquisa Agropecuária Brasileira. 46(6):617-625.
Crossref
|
|
|
|
|
Oliveira FM, Aspiazú I, Kondo MK, Borges ID, Pegoraro RF, Vianna EEJ (2011b). Crescimento e produção de variedades de cana-de-açúcar influenciadas por diferentes adubações e estresse hídrico. Rev. Tróp. Ciênc. Agrárias Biol. 5(1):56-57.
|
|
|
|
|
Oliveira ECA, Oliveira AC, Oliveira RI, Costa SA, Simões Neto DE, Freire FJ (2008). Rendimento de colmo e atributos tecnológicos de cultivares de cana-de-açúcar, plantadas no Nordeste, sob dois sistemas de irrigação. In: Congresso Nacional Da Stab, Maceió. Anais... Maceió: STAB pp. 756-761.
|
|
|
|
|
Oliveira RA, Daros E, Zambon JLC, Weber H, IOT, Bespalhok-filho JC, Zuffellato-Ribas KC, Silva DKT (2007). Área foliar de três cultivares de cana-de-açúcar e sua correlação com a produção de biomassa. Pesqui. Agropecuária Trop. 37(2):71-76.
|
|
|
|
|
Oliveira RC, Cunha FN, Silva NF, Teixeira MB, Soares FAL, Megguer CA (2014). Productivity of fertirrigated sugarcane in subsurface drip irrigation system. Afr. J. Agric. Res. 9(11):993-1000.
Crossref
|
|
|
|
|
Ometto JC (1980). Parâmetros meteorológicos e a cultura da cana-de-açúcar. Escola Superior de Agricultura "Luiz de Queiroz", Piracicaba, São Paulo 17 p.
|
|
|
|
|
Padrón RAR, Ramírez LR, Cerquera RR, Nogueira HMCM, Mujica JLU (2015a). Desenvolvimento vegetativo de pimentão cultivado com lâminas e frequências de irrigação. Tecnol. Ciênc. Agropecuária 9(2):49-55.
|
|
|
|
|
Padrón RAR, Guedes JVC, Swarowsky A, Nogueira CU, Cerquera RR, Díaz-Pérez JC (2015b). Supplemental irrigation levels in bell pepper under shade mesh and in open-field: Crop coefficient, yield, fruit quality and water productivity. Afr. J. Agric. Res. 10(44):4117-4125.
Crossref
|
|
|
|
|
Padrón RAR, Nogueira HMCM, Cerquera RR, Albino GD, Nogueira CU (2015c). Caracterização físico-hídrica do solo argissolo amarelo para estabelecimento de projeto e manejo da irrigação. Acta Iguazu 4(1):36-47.
|
|
|
|
|
Pincelli RP (2010). Tolerância à deficiência hídrica em cultivares de cana-de-açúcar avaliada por meio de variáveis morfofisiológicas. 65 f. Dissertação (Mestrado) - Universidade Estadual Paulista, Faculdade de Ciências Agronômicas, Botucatu, São Paulo.
|
|
|
|
|
Pires RCM, Arruda FB, Sakai E (2008). Irrigação e Drenagem. In: Dinardo-Miranda LL, Vasconcelos ACMde, Landell MGdeA (Eds.). Cana-de-açúcar. Campinas: Instituto Agronômico, São Paulo 1:631-670.
|
|
|
|
|
Raskar BS, Bhoi PG (2003). Effect of intra-row spacings, fertilizer levels and planting materials on yield and economics of pre-seasonal sugarcane under drip irrigation. Sugar Technol. 5(4):305-309.
Crossref
|
|
|
|
|
Sánchez-Román RM, Silva NF, Cunha FN, Teixeira MB, Soares FAL, Ribeiro PHP (2015). Produtividade da cana-de-açúcar submetida a diferentes reposições hídricas e nitrogênio em dois ciclos. Irriga, Edição Especial, 20 anos Irriga + 50 anos FCA pp.198-210.
Crossref
|
|
|
|
|
Silva AB (2002). Resposta da cana-de-açúcar irrigada sob diferentes doses de adubação. 64 f. Dissertação de Mestrado. Universidade Federal de Campina Grande, Campina Grande, Paraíba.
|
|
|
|
|
Silva MA, Silva JAG, Enciso J, Sharma V, Jifon J (2008). Yield components as indicators of drought tolerance of sugarcane. Sci. Agric. 65(6):620-627.
Crossref
|
|
|
|
|
Silva NF, Cunha FN, Teixeira MB, Soares FAL, Moura LC (2015). Crescimento vegetativo da cana-de-açúcar submetida a lâminas de irrigação e fertirrigação nitrogenada via gotejamento subsuperficial. Rev. Bras. Agric. Irrigada 9(2):79-90.
Crossref
|
|
|
|
|
Silva TGF, Moura MSB, Zolnier S, Soares JM, Souza LSB, Brandão EO (2011). Variação do balanço de radiação e de energia da cana-de-açúcar irrigada no semiárido brasileiro. Revista Brasileira de Engenharia Agrícola e Ambiental. 15(2):139-147.
Crossref
|
|
|
|
|
Singh PN, SHUKLA SK, Bhatnagar VK (2007). Optimizing soil moisture regime to increase water use efficiency of sugarcane (Saccharum spp. Hybrid complex) in subtropical India. Agricultural Water Management. 90(1):95-100.
Crossref
|
|
|
|
|
Smit MA, Singels A (2006). The response of surgarcane canopy development to water stress. Field Crops Res. 98(2):91-97.
Crossref
|
|
|
|
|
Souza EF, Bernado S, Carvalho JÁ (1999). Função de produção da cana-de-açúcar em relação à água para três variedades em Campos dos Goytacazes. Rev. Engenharia Agríc. 19(1):12-28.
|
|
|
|
|
Souza JKC, Mesquita FO, Neto JD, Silva MBR, Farias CHA, Lima YB (2015). Crescimento da cana-de-açúcar submetido a diferente es lâminas de irrigação e adubação com zinco. Agropecuária Cient. no Semiárido 11(1):114-119.
|
|
|
|
|
Van Dillewijn C (1952). Botany sof sugarcane. Chronica Botanica. Stechert-Hafner, New York, Massachussets Waltham 371 p.
|
|
|
|
|
Vieira GHS, Mantovani EC, Sediyama GC, Delazari FT (2014). Produtividade e rendimento industrial da cana-de-açúcar em função de lâminas de irrigação. Biosci. J. 30(3):55-64.
|
|
|
|
|
Wiedenfeld B, Enciso J (2008). Sugarcane responses to irrigation and nitrogen in semiarid south Texas. Agron. J. 100(3):665-671.
Crossref
|
|