ABSTRACT
The aim of this research was to evaluate the spatial variability of soil properties of a haplic cambisol under cassava cultivation in Humaitá County, AM - Brazil. The mapping of a cassava growing area was made and a 70 × 70 m square mesh designed. In the mesh, soil samples were performed in a regular spacing of 10 m at a 0.0 to 0.2 m depth, being a total of 64 sample points. Physical analyses were made (texture, soil bulk and particles density, macro and microporosity, total porosity and aggregates stability in water). Descriptive statistics and geostatistical analyses were performed. Except for the clay fraction, all remaining physical attributes presented strong and moderate spatial dependence. The searched variables showed a higher “reach” range than those established in the area, which indicates that larger spacing between points can be applied for future studies. Geostatistical techniques have presented as an efficient tool for soil attribute studies under cassava cultivation in Humaitá-AM, Brazil.
Key words: Kriging, geostatistics, spatial dependence.
The cassava plant (Manihot esculenta) originated from the Americas and has been cultivated in many other countries, from 30° North latitude to South. The economic importance of this plant in the Amazon region, in the traditional agriculture, being a main species, is as an important source of calorie for the native people. Brazil occupies the second position in the world in production of cassava (23.1 million tons), with Nigeria coming first (IBGE, 2015). It can be grown under a great variety of conditions. According to Carvalho et al. (2007), its capacity to grow and produce over low fertility soils may be the main characteristic of this plant.
Moreover, the appropriate management of production factors has favored high yield productivity rates and less
environment impact. In addition, the knowledge about the crop being used as adaptability potential and productivity, are essential to understand the spatial distribution of soil attributes (Campos et al., 2008). To that end, the use of mathematical modeling, such as geostatistics has become fundamental among others, as an input application over the right place by using the appropriate amount, and not only promoting crop yield increase but also decreasing the environmental contamination risks (Cavalcante et al., 2007). Additionally, it is possible to better understand the multiple embedded factors in the productive process. As aspects like low relief variations are also causes of soil attributes changes which are being influenced by time and space (Souza et al., 2004a, b), the studying of spatial variability of soils becomes important since in agriculture, soil structure information are basic to the knowledge of physical attributes, which are fundamental basis in decision making regarding changes in soil and crop management practices (Assis and Lanças, 2005). The failure to comply to these concepts can lead to errors in sampling and soil management.
Thus, various technologies are brought into the field, aiming to use a management system that considers spatial variability of factors related to crop production and soil attributes (Goovaerts, 2001). Among these technologies, the use of Geostatistics, which is based on the theory of regionalized variables can be highlighted. Few studies of variability were carried out in the region, highlighting the work of Oliveira et al. (2013, 2014, 2015) and Aquino et al. (2015). The spatial variability maps of soil attributes offer important information about the choice of appropriate techniques of soil and crop management, considering that plant growth tends to follow the spatial distribution and nutrient variation in the soil (Campos et al., 2009).
Due to lack of work done in the region, little is known about the variability of soil attributes, such as the a haplic cambisol, which are frequent in the region and these soils have low fertility, with very high levels of aluminum in them which significantly affect the development roots, as defined in SiBCS (EMBRAPA, 2013). In this sense, the aim of this research was to investigate the spatial variability of physical attributes in a haplic cambisol under cassava cultivation, in the Southern Amazonas State, Brazil.
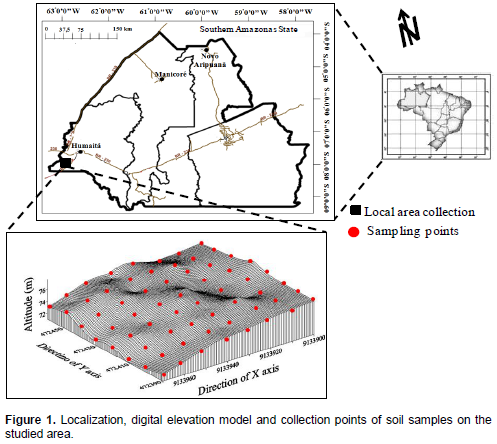
Description of the study area and plane of sampling
The experiment was installed on a Plinthic alitic haplic cambisol (EMBRAPA, 2013) (Inceptsoils), which according to Campos (2009), are predominant in high lands of the Southern Amazonas. The study area is located in the surrounding of BR 119 road, in Humaitá County, Amazonas State, Brazil, at 7° 30’ 24” S latitude and 63° 04’ 56” W longitudes. The region presents a “tabuleiro” relief type, with little unevenness and slightly dished edges, with slight variations that change the behavior of soils. It presents a transitional vegetation between fields and forests, which is complemented by areas with field formation where short woody-grass vegetation alternating with small single trees and jungle gallery forests along rivers prevails (Braun and Ramos, 1959). The regional climate, according to Köppen classification, is tropical rains, which presents a short dry period (Am), temperature range from 25 to 27°C and the annual mean rainfall of 2,500 mm, with the rainy period beginning in October to June and relative humidity from 85 to 90%.
Experimental design and data collection
Mapping of a cassava growing area was performed approximately 120 days after planting. Over this area, a 70 × 70 m grid mesh had been established in June, 2011, with the soil sampled in the mesh cross points with regular spacing of 10 m, at a depth of between 0.0 to 0.2 m, totalizing an amount of 64 sample points (Figure 1). These points were geo-referenced by a Global Positioning System (GPS) Garmin Etrex equipment (South American´69). The soil sample, with preserved structures to physical analyses, were performed using volumetric ring, with a 0.045 m height and 0.0405 m diameter, between 0.0 to 0.2 m depth.
Analysis of soil attributes
The particle-size analysis was performed by pipette method, utilizing a NaOH 0.1 N solution with chemical dispersant and mechanical agitation in a high speed rotation equipment for 15 min, as proposed by Brazilian Agricultural Research Corporation (EMBRAPA) (1997). The clay fraction was separated by sedimentation, sand determined by screening and silt calculated by their difference. The soil samples from the volumetric rings were saturated through gradual water blade elevation until it reached 2/3 of the ring height. The total porosity (Pt) was obtained by calculating the difference between the weights of water saturated soil and dry soil (which was dried in kiln at 105°C for 24 h). The microporosity was measured on the sand tension table according to methodology of EMBRAPA (2011). From the difference between total porosity and microporosity was obtained the macroporosity. The soil bulk density (Ds) was measured by the relationship between dry mass of the soil sample and its volume in the volumetric ring at 105°C for a period of 24 h. The particle density was determined by the volumetric flask (EMBRAPA, 2011).
At each sample point, preserved structure samples were collected at the depth of 0.0 to 0.2 m in order to determine the soil aggregate stability. The sample had been slightly crushed manually and sifted in a sieve of 9.51 mm mesh diameter and retained in the 4.76 mm sieve. This was immediately followed by shade drying to perform the aggregate stability analyses. The aggregate separation and stability were determined with changes in the following diameter classes: > 2.0 mm; 2.0 to 1.0 and < 1.0 mm (Kemper and Chepil, 1965). The aggregates were put into contact with the water over the 2.0 mm sieve for fifteen minutes; the mass of the material retained in each sieve was placed in a 105°C kiln. The results were presented as percentage of aggregates retained in the sieves of > 2.0; 2.0 to 1.0 and < 1.0 mm geometric mean diameter (GMD) and length-weighted geometric mean diameter (LWGMD).
Statistical analyses
The soil variability was primarily evaluated by data exploratory analysis calculating mean, median, standard deviation, variance, variation coefficient, asymmetry coefficient, kurtosis coefficient and normality test. The data normality hypothesis was tested by Kolmogorov-SmirnovSurfer test (Golden Software Inc., 1999). In order to perform the spatial characterization, the geostatistic analysis was applied (Vieira et al., 1983). The experimental semivariograms were estimated under the intrinsic hypothesis theory using the following equation:
Where: γ(h) is the semivariance between two points separated by distance h; N(h) is the number of experimental data pairs separated by vector h; Z(xi) is the measured values for soil and crop attributes at xi position; and Z(xi+h) – Z is the attribute value separated by h distance and at xi position
Since a mathematical modeling adjustment to γˆ (h) is performed, the theoretical modeling coefficients for semivariogram are defined (the nugget effect, C0; structural variance, C1; level, C0 + C1; the reach of spatial dependence, a). The nugget effect is obtained when a semivariogram is extrapolated back to zero distance which represents the random variation component; the level is a semivariance value when there is the curve stabilization under a constant value; the reach is the distance from the origin to the level stable values, expressing the distances after which the samples are not correlated (Vieira et al., 1983; Trangmar et al., 1985).
In order to determinate the occurrence of spatial dependence, the semivariogram test was applied through GS+ program (Robertson, 1998). In case of doubt among more than one model for the same semivariogram, the greater R2 was considered (adjusted coefficient of determination). In mapping the spatial distribution of the variables, the Surfer software (Golden Software Inc., 1999) was used.
The results referring to the descriptive analysis for physical attributes are presented in Table 1. The mean and median presented roughly, the values that indicated that the data had a symmetric distribution, being similar to those found by Campos et al. (2007b) who studied the spatial dependence of physical and hydric attributes from a Spodosol in the “Zona da Mata” of Pernambuco State. It was also observed that the silt content were higher than the other particle fractions (282.41, 558.65 and 158.93 g kg-1 for clay, silt and sand, respectively), which can be attributed to the origin material influence, and according to Brasil (1978) consisted of clay, silt and very fine sand.
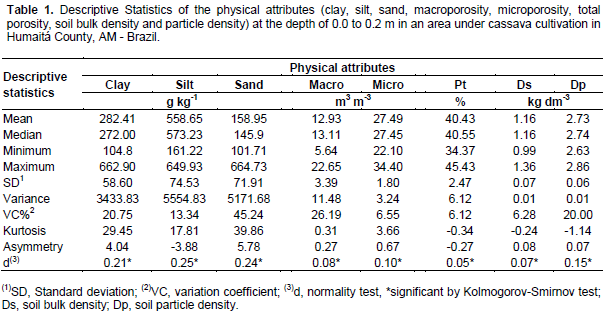
In accordance with variation coefficient (VC) classification, which had been proposed by Warrick and Nielsen (1980), the VC values to soil variable classification (CV < 12 %), (12 % < CV >60 %) and (CV > 60 %) indicated low, moderate and high variability, respectively. All the studied attributes (Table 1) presented variation coefficient (VC) showing a low to moderate data variability which was in agreement with those found by Eguchi et al. (2002). On the other hand, according to Souza (1999), the VC and the standard deviation gave an idea of the variability magnitude of soil chemical and physical properties, however, they do not infer about the spatial dependence of these properties, which is only possible through geostatistical techniques.
The asymmetry and kurtosis coefficients are down to nearly zero (Table 1), for the same studied variables, which characterized symmetric distribution that are justified by mean and median values. Similar trend was observed by Campos et al. (2007a) who evaluated the spatial variability of the soil texture from various starting materials in Pereira Barreto, SP. Apart from clay, silt, sand and microporosity which presented higher kurtosis coefficient values, how can one shows that these variables do not follow the same standard curve of distribution.
Due to the aggregate stability, it was observed that the variables: GMD, LWGMD, > 2 mm, 2 to 1 mm and < 1.00 mm aggregate classes presented a normal distribution (Table 2). The mean and median values were almost similar for all the studied variables, which show that the data follows a symmetric distribution. Similar values for these variables were found by Souza et al. (2004c) who evaluated the spatial variability of aggregates stability and organic matter from different soil and relief types. The asymmetry and kurtosis coefficients approached zero for all studied variables, thus characterizing a symmetric distribution which justifies the mean and median values.

The LWGMD and aggregates in > 2.00 mm class presented a low variation coefficient, but the aggregate variables of 2 to 1 and < 1.00 mm presented high VC and only the GMD presented a medium VC value. Lacerda et al. (2005) by studying the aggregate stability observed a medium VC to GMD, and the following treatments were assessed: native forest (MA), continuous conventional tillage for ten years followed by no-tillage for twelve years (PC/SD) and continuous conventional tillage for twenty two years (PC).
The Normality test or Kolmogorov-Smirnov test indicated a normal distribution for all evaluated variables (Tables 1 and 2) of the original data. Meanwhile, according to Cressie (1991), the data normality was not a Geostatistics requirement, but it was convenient such that in the normal distribution graphic, the attribute did not present their distribution edges much elongated, which can compromise the analysis. The geostatistical data for physical attributes are represented in the Figure 2. Except for the clay fraction, all other studied attributes presented spatial dependence which was expressed through adjustments of semivariogram models. The adjustment of the found soil variables values allowed for a better semivariogram adjustment, which better represented the variable. Hence, the exponential modeling adjusted to the data of almost all the studied variables except for those of silt and total porosity, which adjusted to the spherical model (Figure 2), thereby supporting the values found by Souza et al. (2001). Within this context, Grego and Vieira (2005) had affirmed that the mathematical spherical model was prevalent in soil science. According to Mcbratney and Webster (1986), the semivariogram models that better adjusted to the soil attributes were the spherical and the exponential.

The nugget effect (C0) represents the unexplained variability, considering the used sample distance (Vieira, 2000). Among the studied variables, only the clay content had the nugget effect (Figure 2); similar results had also been found by Lima et al. (2007) in a Red-Latosol area under black pepper cultivation. For the spatial dependence degree [(C0/(C0+C1)] (SDG) analysis of the studied variables, a classification performed by Cambardella et al. (1994) was used, in which EDG values being lower than 25% were considered to have strong spatial dependence, SDG values between 25 to 75% indicated moderate spatial dependence while SDG values greater than 75% were of weak spatial dependence. The SDG relationship analysis came up with many variables which presented moderate spatial dependence, except for microporosity (Figure 2) that presented weak spatial dependence. What is ideal here is the intensification of the grid sampling.
Souza et al. (2001), in studying the spatial variability of the physical attributes in a dystrophic red-latosol, under direct sowing in Selvíria (MS), found moderate dependence for physical and hydric attributes, and this was similar to our study. In contrast, Eguchi et al. (2002), in evaluating the spatial variability of the texture and the particle density in an alluvial soil in Lavras County, MG found strong spatial dependence values for granulometric attributes; this was due to the difference among these results related to the soil type.
Almost all the analyzed variables presented coefficient (R2) above 0.80 (Figure 2), that is at least 80% of the variability in the estimated semivariance values were explained by the adjusted models (Campos et al., 2007a). These values agreed with those found by Campos et al. (2007b) who evaluated the spatial dependence of physical and hydric attributes in an Espodosol from the “Zona da Mata” in Pernambuco State. The evaluated values presented different reach values (Figure 2) which were superior to the mesh spacing used in the sampling for the variables, indicating that samples were spatially related, thereby enabling greater continuity in the spatial distribution of soil properties under cassava cultivation and allowing interpolations (Vieira, 2000). This also corroborated with Mendes et al. (2008) who evaluated the spatial variability of texture in two soil types of saline desert, in Rio Grande do Norte State.
According to Trangmar et al. (1985), the reach established the spatial dependence limit among samples, this was however, distances equal to or shorter than the reach. It was concluded that the close values of a variable were spatially correlated and could be used to estimate values in any point among them.
The adjusted semivariogram model parameters were used to set values in non-sampled places through kriging. Thus, the kriging maps of the granulometric, physical and hydric attributes are presented in Figure 3. It was observed that there was a relationship among the granulometric fractions, where the silt and sand content had contrary behavior when compared between themselves, that is, when higher values for sand was observed, the silt values were supposed to be lower at both evaluated depths. Similar results have been observed by Eguchi et al. (2002).

When the granulometric, physical and hydric attribute maps was observed (Figure 3), ii was seen that the topographical behavior in the area interfered in the variable behavior. It was also observed that sand content was higher in the intermediate altitudes; on the other hand, higher macroporosity values were seen at these same places. For silt, higher contents was seen in the same altitudes where the microporosity reached higher values, which can be explained by its smaller particle size which resulted in an increase in the soil micropore concentration at this grid point.
Figure 4 shows the geostatistical values for the variables: GMD, LWGMD, aggregates in > 2 mm, 2 to 1 mm and < 1.00 mm classes. It was observed that all stability attributes of the aggregates presented spatial dependence which was expressed through semivariogram adjustments. The found adjustments of soil variables allowed a better semivariogram adjustment which also better represented the variable and the applied statistical modeling. By these, the spherical model was adjusted to LWGMD, with aggregate classes of >2.00 mm and <1.00 mm, while all other variables adjusted to the exponential one. This was in agreement with Souza et al. (2004b) who evaluated the spatial variability, aggregate stability and organic matter in different soil relief and shape.
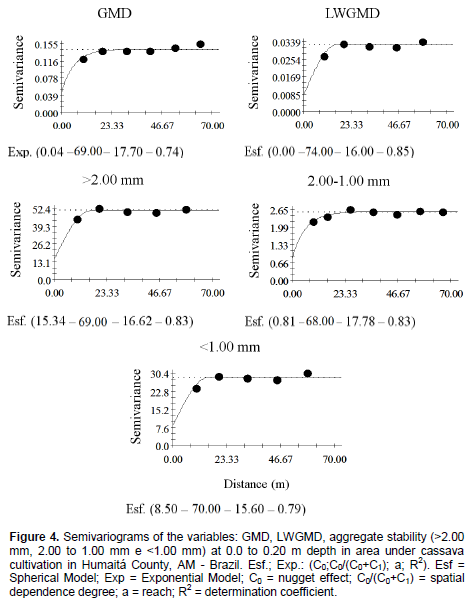
The analysis of the spatial dependence [(C0/(C0+C1)] showed that variables of aggregate stability presented a moderate spatial dependence (Figure 4) and these data corroborated with the data found by Souza et al. (2004b). Regarding the fact that the determination coefficient (R2) was above 0.80 (Figure 4), it implies that at least 74% of the existing variability in the estimated semivariance values are explained by the adjusted models.
The studied attribute presented varied level values (Figure 4) higher than grid spacing value for the sampling grid to the variables which indicated that the samples were spatially related and then, presented a greater continuity in the spatial distribution of soil properties under cassava cultivation, allowing interpolation (Vieira, 2000). The parameters of the adjusted semivariogram models were used to stipulate the values over non-sampled locations through kriging. In this way, the kriging maps of the variables: GMD, LWGMD, aggregates in the class >2.00 mm, 2.00–1.00 mm, <1.00 mm and soil bulk density are presented in Figure 5.
1. Except for the clay fraction, all the other physical attributes presented moderate to strong spatial dependence;
2. The studied variables showed a higher level value than the one established for the area, indicating higher grid spacing between points for oncoming studies;
3. The geostatistical techniques represent an efficient tool in the soil attributes studies under cassava cultivation in Humaitá County, AM - Brazil.
The authors have not declared any conflict of interests.
The authors would like to thank the FAPEAM, SECTI-AM and FAPESP for financial support.
REFERENCES
|
Aquino RE,Campos MCC, Marques JJ, Oliveira IA, Teixeira DB,Cunha JM (2015). Use of scaled semivariograms in sample planning of soil physical attributes in southern Amazonas. R. Bras. Ci. do Solo. 39(1):21-30.
Crossref
|
|
|
|
Assis RL, Lanças KP (2005). Avaliação dos atributos físicos de um Nitossolo vermelho distroférrico sob sistema plantio direto, preparo convencional e mata nativa R. Bras. Ci. do Solo. 29(4):515-522.
Crossref
|
|
|
|
|
Brasil. Ministério das Minas e Energia. Projeto Radambrasil. (1978).
|
|
|
|
|
Braun EHG,Ramos JRA (1959). Estudo agroecológico dos campos Puciarí-Humaitá (Estado do Amazonas e Território Federal de Rondônia). R. Bras. Geografia 21(4):443-497.
|
|
|
|
|
Cambardella CA, Moorman TB, Novak JM, Parkin TB, Karlen DL, Turco R, Konopka AE (1994). Field-scale variability of soil properties in Central Iowa Soil. Soil Sci. Soc. Am. J. 58(5):1501-1511.
Crossref
|
|
|
|
|
Campos MCC (2009). Pedogeomorfologia aplicada a ambientes Amazônicos do Médio Rio Madeira. [thesis] Recife, PE: Universidade Federal Rural de Pernambuco.
|
|
|
|
|
Campos MCC, Ferraz FB, Freitas EVS, Souza ZM (2007b). Dependência espacial de atributos físicos e hídricos de um espodossolo da zona da mata de Pernambuco. R. Biol. Ci. Terra. 7(1):84-91.
|
|
|
|
|
Campos MCC, Marques JJ, Martins FMV, Pereira GT, Souza ZM, Barbieri DM (2008). Variação espacial da perda de solo por erosão em diferentes superfícies geomórficas. Ciênc. Rural 38(9):2485-2492.
Crossref
|
|
|
|
|
Campos MCC, Marques JJ, Pereira GT, Montanari R,Siqueira DS (2007a). Variabilidade espacial da textura de solos de diferentes materiais de origem em Pereira Barreto. SP. R. Ci. Agron. 38(2):149-157.
|
|
|
|
|
Campos MCC, Marques JJ, Pereira GT, Souza ZM, Montanari R (2009). Planejamento agrícola e implantação de sistema de cultivo de cana-de-açúcar com auxílio de técnicas geoestatísticas. Rev. Bras. Eng. Agríc. Ambiente. 13(3):297-304.
|
|
|
|
|
Carvalho FM, Viana AES, Matsumoto SN, Rebouças TNH, Cardoso CEL, Gomes IR (2007). Manejo de solo em cultivo com mandioca em treze municípios da região sudoeste da Bahia. Ciênc. Agrotec. 31(2):378-384.
Crossref
|
|
|
|
|
Cavalcante EGS, Alves MC, Pereira GT, Souza ZM (2007). Variabilidade espacial de MO, P, K e CTC do solo sob diferentes usos e manejos. Ciênc. Rural 37(2):394- 400.
Crossref
|
|
|
|
|
Cressie N (1991). Statistics for spatial data. New York: John Wiley.
|
|
|
|
|
Eguchi ES, Silva EL, Oliveira MS (2002). Variabilidade espacial da textura e da densidade de partículas em um solo aluvial no Município de Lavras, MG. Rev. Bras. Eng. Agríc. Ambiente 6(2):242-246.
|
|
|
|
|
EMBRAPA - Empresa Brasileira de Pesquisa Agropecuária (2011) Manual de métodos de análise de solo. Rio de Janeiro, Centro Nacional de Pesquisa de Solos.
|
|
|
|
|
Golden Software Inc. (1999). SURFER for Windows: realese 7.0: contouring and 3D surface mapping for scientist's engineers, user's guide, New York.
|
|
|
|
|
Goovaerts P (2001). Geostatistical modeling of uncertainty in soil science. Geoderma 103(1-2):3-36.
Crossref
|
|
|
|
|
Grego CR, Vieira S (2005). Variabilidade espacial de propriedades físicas do solo em uma parcela experimental. R. Bras. Ci. do Solo. 29(2):169-177.
Crossref
|
|
|
|
|
IBGE - Instituto Brasileiro de Geografia e Estatística (2015). Levantamento Sistemático da produção agrícola. Available em< http://www.sidra.ibge.gov.br/> consultado em 05/06/2015.
|
|
|
|
|
Kemper WD,Chepil WS (1965). Aggregate stability and size distribution. In: Black CA. Methods of soil analysis. Madison: Asa, Cap. 39:499-510.
|
|
|
|
|
Lacerda NB, Zero VM, Barilli J, Moraes MH, Bicudo SJ (2005). Efeito de sistemas de manejo na estabilidade de agregados de um Nitossolo Vermelho. Eng. Agric. 25(3):686-695.
Crossref
|
|
|
|
|
Lima JSS, Oliveira RB, Quartezani WZ (2007). Variabilidade espacial de atributos físicos de um Latossolo Vermelho-Amarelo sob cultivo de pimenta-do-reino. Eng. Agric. 15(2):290-298.
|
|
|
|
|
Mcbratney AB, Webster R (1986). Choosing functions for semi-variograms of soil properties and fitting them to sampling estimates. J. Soil Sci. 37(4):617-639.
Crossref
|
|
|
|
|
Mendes AMS, Fontes RLF, Oliveira M (2008). Variabilidade espacial da textura de dois solos do Deserto Salino, no Estado do Rio Grande do Norte. R Ci. Agron. 39(1):19-27.
|
|
|
|
|
Oliveira IA, Campos MCC, Marques JJ,Aquino RE, Teixeira DB, Silva DMP (2015). Use of scaled semivariograms in sample planning of soil chemical attributes in southern Amazonas. R. Bras. Ci. do Solo 39(1):31-39.
Crossref
|
|
|
|
|
Oliveira IA, Campos MCC,Aquino RE, Soares MDR, Marques JJ,Nascimento EP (2013). Variabilidade espacial de atributos físicos em um Cambissolo Háplico sob diferentes usos na região sul do Amazonas. R. Bras. Ci. do Solo 37(4):1103-1112.
Crossref
|
|
|
|
|
Oliveira IA, Marques JJ, Campos MCC, Aquino RE, Siqueira DS, Freitas L (2014). Spatial variability and sampling density of chemical attributes in archaeological black earth soil and native forest in Manicoré, AM. Floresta 44(4):735-746.
Crossref
|
|
|
|
|
Robertson GP (1998). GS+ geostatistics for the environmental sciences: GS+ user's guide. Plainwell: Gamma Design Software.
|
|
|
|
|
Souza LC (1999). Variabilidade espacial da salinidade de um solo aluvial no semi-árido paraibano. Campina Grande: Universidade Federal da Paraíba.
|
|
|
|
|
Souza ZM, Marques JJ, Pereira GT (2004b). Variabilidade espacial da estabilidade de agregados e matéria orgânica em solos de relevos diferentes. Pesq. Agropec. Bras. 39(5):491-499.
Crossref
|
|
|
|
|
Souza ZM, Marques JJ, Pereira GT, Bento MJC (2004a). Variabilidade espacial de atributos físicos de um Latossolo Vermelho sob cultivo de cana-de-açúcar. Rev. Bras. Eng. Agríc. Ambiente 8(1):51-58.
|
|
|
|
|
Souza ZM, Marques JJ, Pereira GT, Moreira LF (2004c). Variabilidade espacial do pH, Ca, Mg e V% do solo em diferentes formas do relevo sob cultivo de cana-de-açúcar. Ci. Rural. 34 (6):1763-1771.
Crossref
|
|
|
|
|
Souza ZM, Silva MLS,Guimarães GL, Campos DTS, Carvalho MP, Pereira GT (2001). Variabilidade espacial de atributos físicos em um Latossolo Vermelho Distrófico sob semeadura direta em Selvíria, MS. R. Bras. Ci. do Solo 25(3):699-707.
Crossref
|
|
|
|
|
Trangmar BB, Yost RS, Uehara G (1985). Application of geostatistics to spatial studies of soil properties. Adv. Agron. 38:54-94.
|
|
|
|
|
Vieira SR, Hatfield JL, Nielsen DR, Biggar JW (1983). Geoestatiscal theory and application to variability of some agronomical properties. Hilgardia 51(3):1-75.
Crossref
|
|
|
|
|
Vieira SR.Geoestatística em estudo da variabilidade espacial do solo (2000). In: Novais RF, Alvarez VVH, Schaefer CE. G. R. (Ed.) Tópicos ciência do solo Campinas. Soc. Bras. Ciênc.Solo 1:1-54.
|
|
|
|
|
Warrick AW, Nielsen DR (1980). Spatial variability of soil physical properties in the field. In: Hillel, D. (ed.). Applications of soil physics. New York: Academic.
Crossref
|
|