ABSTRACT
The objective of this study was to select soybean genotypes derived from crosses between conventional and transgenic lines Roundup Ready (RR), using jointly Restricted Maximum Likelihood/Best Linear Unbiased Prediction (REML/BLUP) approaches, factors analysis and principal components analysis, processed with favorable agronomic traits, during the 2013/2014 growing season. Three agronomic selection processes were identified to select genotypes that discriminate genotypes containing more specific properties. Process 1 (insertion height of first pod, HFP; number of branches, NB; number of pods, NP; number of nodes, NN; and grain yield, GY) was efficient to select earlier, smaller genotypes with good yield/production components and lodging resistance. The junction between mixed model via REML/BLUP and the applied multivariate statistic using factor analysis helped to select suitable genotypes with high performance to carry on the soybean plant-breeding program.
Key words: Glycine max, Restricted Maximum Likelihood/ Best Linear Unbiased Prediction (REML / BLUP), factor analysis, principal components.
Soybean (Glycine max (L.) Merrill), with its expanding commercial crop areas, has become very important in the world scenario (Cavalcante et al., 2010). The species have a complex production, storage, processing and marketing structure, where they are grown on a large scale (Rezende and Carvalho, 2007).
In Brazil, soybean growth and productive capacity improving are tied to advances in breeding programs and environmental conditions (Klahold et al., 2006). Genetic improvement has contributed to increase soybean production, and genetic gains resulted from traditional methods involving hybridization and con-sequent phenotypic selection. Currently, it is combined with the use of transgenic and molecular markers (Peluzio et al., 2009).
One of the most important features of soybean breeding programs is searching for cultivars with favorable traits to obtain significant productivity gains. However, genetic gains have become increasingly difficult to achieve for species submitted to long selection processes (Maia et al., 2009).
More accurate statistical methodologies should be employed to obtain highly effective estimates of the genetic gain, which is expected in each selection cycle. Besides, plant breeding has a strong link with statistics, therefore, in addition to selection methods, good field trials, and relevant resources for choosing genetic designs, the more recent trend uses more refined statistical analytical procedures for a more detailed study of components of the average and variance of a character (Maia et al., 2009).
For many years, plant breeding programs depended on selecting genotypes by analyzing each agronomic variable individually, estimating genetic parameters, applying selection indices for traits and analyzing the environments to check the genotype x environment interaction. In recent years, multivariate methods and mixed models have become more important due to advances in computer software, and are being applied to evaluate genetic divergence (Costa et al., 2006; Oliveira et al., 2008; Bizari et al., 2014), select genotypes and progenies (Vianna et al., 2013; Dallastra et al., 2014), study adaptability and stability of genotypes (Maia et al., 2006; Mendonça et al., 2007; Borges et al., 2010b; Gomez et al., 2014), estimate genotypic values ​​and study genetic parameters (Duarte et al., 2001; Lopes et al., 2008).
In view of the positive aspects of mixed models and multivariate analyses, this study aimed to select superior soybean genotypes that originated from crosses between conventional and transgenic lines (Roundup Ready®) (RR), using the REML/BLUP methods, factors analysis and principal components analysis.
Genetic material, experimental site and agronomic traits
This study evaluated soybean segregating populations that resulted from crosses between conventional lines of the College of Agricultural and Veterinary Sciences/UNESP, Jaboticabal. These genotypes are widely adapted, and the commercial cultivars carry the RR gene of the MSOY RR group.
The trial evaluated 202 soybean genotypes from the generation F6 during the 2013/2014 growing season, in the Experimental Farm of Education, Research and Production (FEPE), of Agricultural and Veterinary Sciences College/UNESP, Jaboticabal, SP.
The experimental design was augmented Federer blocks, containing 13 blocks, with 5 m long rows of plants spaced 0.45 m as the plots. Four standard cultivars were used as additional checks, two conventional ('CODETEC-216' and 'Vmax') and two carriers of the RR gene ('BMX-Força RR' and BRS 'Valiosa RR').
The following agronomic traits were evaluated in six plants per parcel, in beginning flowering stage (R1) till full flowering stage (R2): a) days to flowering (DF) - number of days elapsed from plant emergence up to when 50% of the flowers opened; b) Plant height at flowering (PHF) – the distance between plant insertion in the soil and the apex of the main stem, in centimeters (cm).
The following traits were evaluated at full mature stage (R8): a) days to maturity (DM) (Fehr and Caviness, 1977)- period elapsed between sowing and the date when 50% of the plants displayed 95% of mature pods; b) plant height at maturity (PHM) – distance measured on the stem between plant insertion in the soil and the insertion of the uppermost pod, (cm); c) insertion height of first pod (HFP) - distance between the soil surface and the insertion of the first pod (cm); d) Lodging (LD) - evaluated by a visual score, ranging from 1 (all plants standing) to 5 (all plants lodging); e) agronomic value (AV) - assessed by a visual score, ranging from 1 (plants with poor agronomic traits) to 5 (plants with optimal agronomic traits). The scores evaluated a set of visual adaptive traits: plant architecture, number of filled pods, vigor and plant health, premature pod threshing and leaf retention at maturity; f) Number of branches per plant (NB) - total number of branches attached to the main stem of the plant; g) Number of nodes (NN) – total number of internodes per plant; h) Number of pods (NP) - total number of pods with formed seeds per plant; i) Grain yield (GY) - grain weight per individual plant obtained after plant harvesting, processing and drying of the grains (up to 13% moisture), expressed as grams per plant (g plant -1); j) Hundred seeds (grains) weight (HSW) – the average weight of four samples of hundred seeds determined using a precision balance (1 g).
ESTIMATION OF GENETIC PARAMETERS
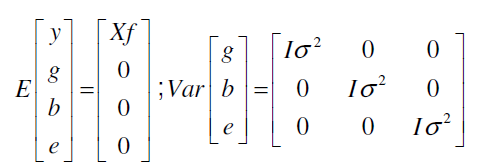
Genetic parameters were estimated by restricted maximum likelihood (REML) and genotypic means (generation F6) adjusted and estimated by Best Linear Unbiased Prediction (BLUP). In the analysis of mixed models with unbalanced data, the model effects are not tested via F tests as is done in the analysis of variance method. In this case, for the random effects, the scientifically recommended test is the likelihood ratio test (LRT) (Resende, 2007b). The likelihood ratio test (LRT) was used to evaluate the traits significance in the experiment which was determined by the chi-square at 5% and 1% probability with one degree freedom (Nelder and Wedderburn, 1972). Considering the experimental augmented blocks of Federer, the matrix data was analyzed according to the statistical model (Resende, 2007b):
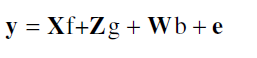
Where: y is the data vector; f, vector of fixed effects (general average); g, vector of genotypic effects (assumed to be random); b, vector of block environmental effects (assumed to be random); e, vector of errors and residues (random); X, Z and W are the incidence matrices for these effects (f, g, ande, respectively).
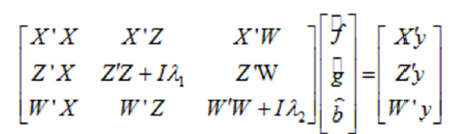
The distribution and structures of means and variances are given below according to Barreto and Resende (2011):
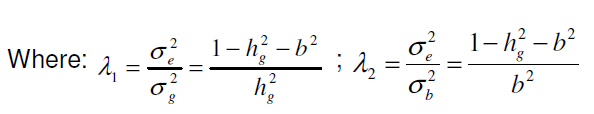
The mixed model equations for the model adopted are (Barreto and Resende, 2011):
= Heritability of individual parcels, = Determination coefficient of block effects, = Genotypic variance between lines, = Variance between blocks, = Residual variance between parcels.
Statistical analysis for mixed models was performed using the linear analysis procedure of the PROC MIXED software (SAS Institute, 2011).
The genotypes were selected using exploratory multivariate statistical techniques due to the structure of dependence in the original set of variables. The multivariate technique known as factor analysis used the method of principal components, calculated from the correlation matrix. This study used varimax rotation method (Manly, 2008).
Each process is identified in the factor according to traits with the most representative loads (greater than 0.50). The processes identified in the factors are called agronomic selection processes.
The traits considered in the processing of factor analysis were the genotypic averages estimated by BLUP, as follows: DF, PHF, DM, PHM, HFP, LD, AV, NB, NN, NP, GY and HSW in the studied F6 generation.
The discrimination of genotypes was performed by principal component analysis taking into account all traits, followed by each individual case (Cruz et al., 2012). The Kaiser criterion (1958) was used to select the main components, those whose eigenvalues ​​were above unity since they generate components with relevant amount of the original information.
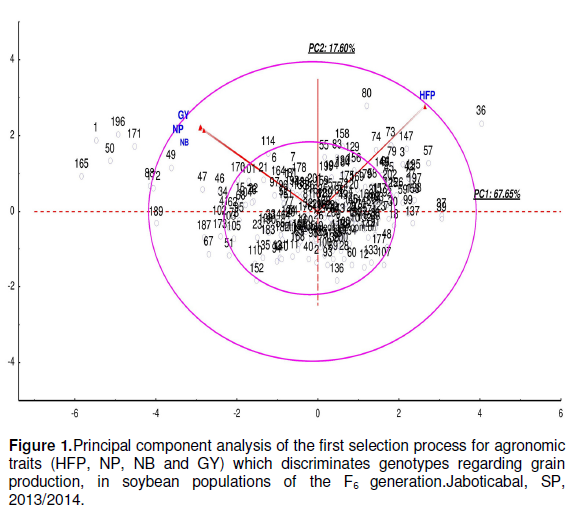
Each graph displays two circles that resulted from the principal component analysis: a smaller one with diameter between -2 and 2 (α ≈ 5%), and a larger one with diameter between -4 and 4 (α < 0.01). Values located outside each circle were considered genotypes with properties specific for selection.
After standardizing the variables (mean = 0 and variance = 1), the analyses were performed using the STATISTICA Version 7 software (StatSoft, 2004).
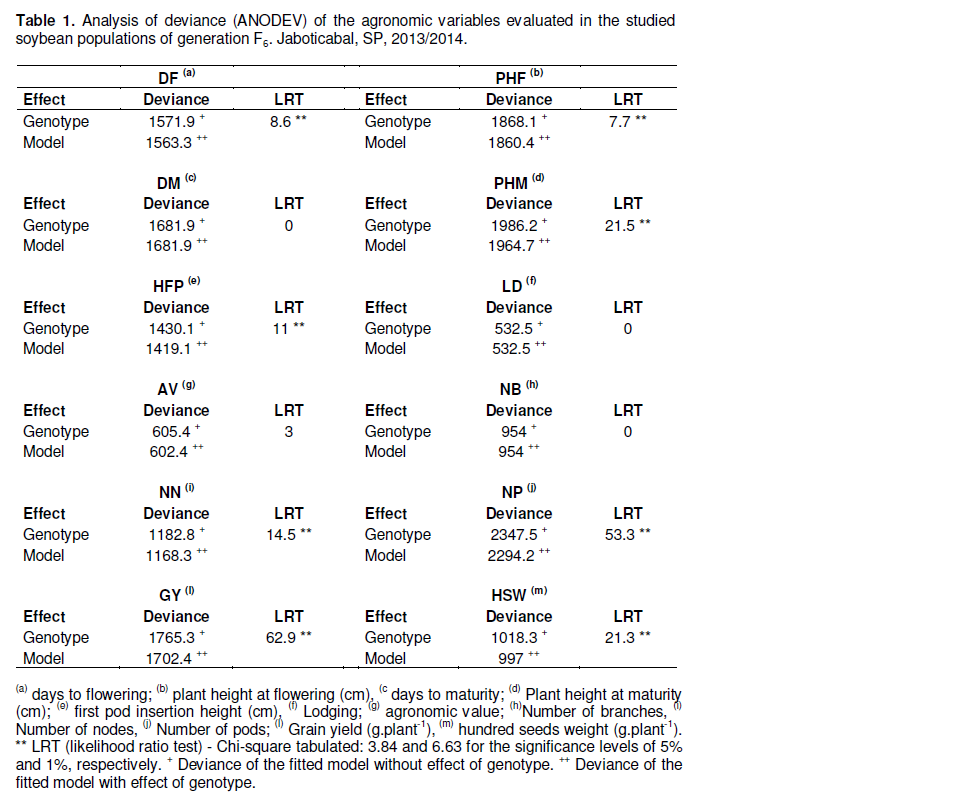
The analysis of deviance, ANODEV (Nelder and Wedderburn, 1972), detected significant differences by Chi-square test (LRT) at 1% probability for the following agronomic traits: days to flowering (DF), plant height at flowering (PHF), plant height at maturity (PHM), insertion height of first pod (HFP), number of nodes (NN), number of pods (NP), grain yield (GY) and hundred seeds weight (HSW) (Table 1). GY and NP showed greater variations (LRT = 62.9 and LRT = 53.3, respectively). However, the agronomic traits, days to maturity (DM), lodging (LD), agronomic value (VA) and number of branches (NB) were not significant by chi-square at 5% probability.
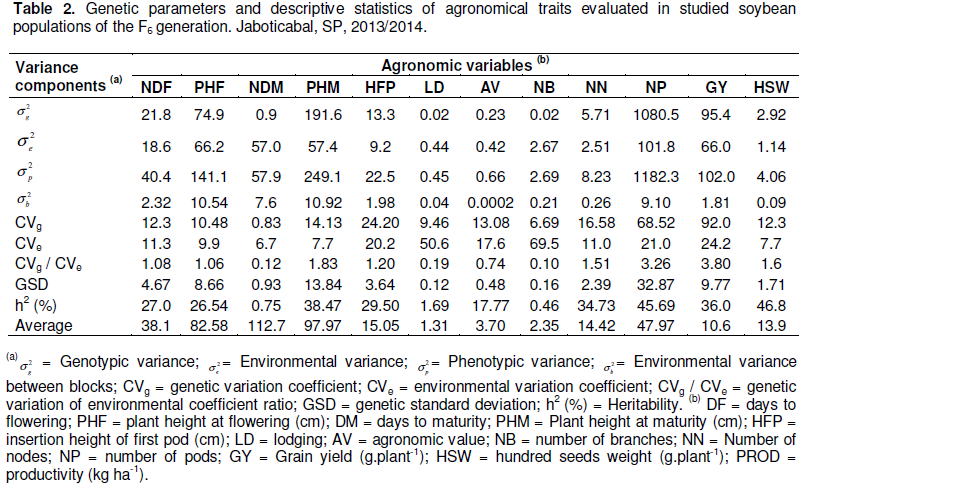
The genetic parameters and genotypic means of the traits estimated by REML/BLUP indicated that the coefficients of genetic (CVg) and environmental (CVe) variation ranged from 0.83 to 92.0% and 6.70 the 69.5%,respectively (Table 2). The CVg/CVe ratio was greater than one for the following traits: NDF, PHF, PHM, HFP, NN, NP, GY and HSW. However, this ratio was not greater than one for traits that were not found significant by the analysis of deviance (chi-square test): DM, LD, AV and NB.
The estimated heritability coefficients (h2) were low for all studied traits, which is undesired in the breeding program. Overall, the isolated variables of this study had either little or no variability to characterize a genotypic selection, and very low heritability estimates, considering each one individually, especially the important soybean agronomic traits of (DM, AV and LD). Consequently, genetic gains were low due to the fact that the studied population had undergone various selection processes, making it difficult to select for genotypes selection index. Nevertheless, factor analysis and principal components identified specific and important genotypes for breeding program.
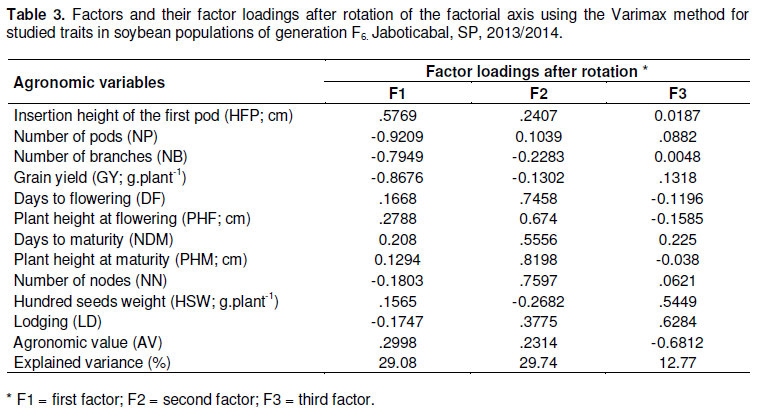
Data at Table 3 showed the results of factor analysis while three agronomic processes with distinct patterns in the selection of genotypes were characterized, according to the suitability of the information traits acting together in the process.
The first factor (F1), accounting for 29.08% of the original variability, identified a process which aggregated only production traits. In this process, NP, NB and GY were inversely correlated with HFP. The second factor (F2), accounting for 29.74% of the remaining variability, aggregated the traits DF, PHF, DM, PHM and NN, associated with plant cycle and size, which were directly correlated. The third factor (F3), accounting for 12.77% of the remaining variability, aggregated the traits HSW (yield component), LD (lodging), which were directly correlated, but inversely correlated with VA (visual score of genotype quality).
Principal component analysis of Process 1 formed by HFP, NP, NB and GY, which discriminated genotypes regarding grain production was presented by Figure 1. In PC1, genotypes located outside the large circle to the left have higher yield, although displaying lower HFP (1, 50, 88, 165, 171, 172, 189 and 196) contrasting with the genotype 36, located to the right which displayed lower yield and greater insertion height of the first pod.
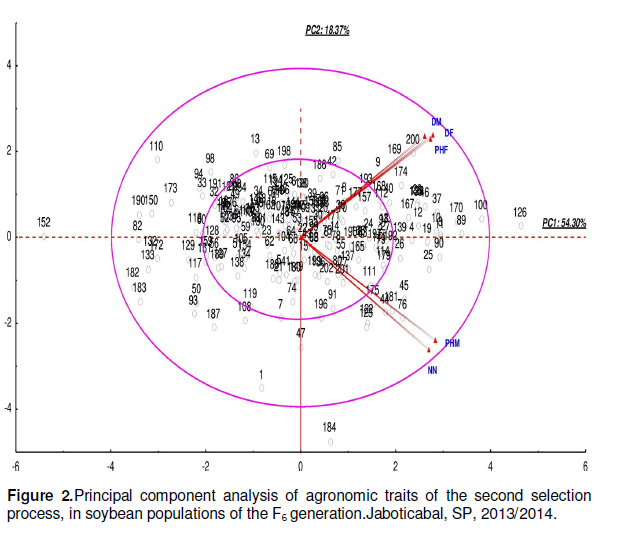
Data in Figure 2 showed that the second process (DF, PHF, DM, PHM and NN), to the right of PC1, outside the larger circle, characterized genotype 126, with higher PHF and DM, contrasting with genotype 152, located on the left near the zero reference line of PC1. Genotype 184 also located on the outer region of the circle, characterized by lower DF, PHF and DM and with greater PHM and NN. The goal was to determine earlier genotypes with height ranging from 0.80 to 1.0 m and the results indicated that genotype 152 is the closest to the ideal.
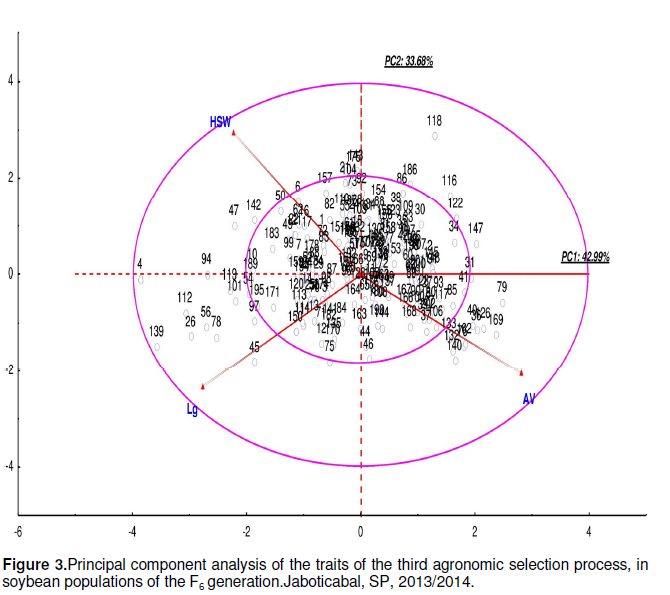
Figure 3 results indicated that genotypes 4, 26, 47, 56,78, 94, 101, 112, 119 and 139, which located in the region between the two circles to the left of PC1, had more specific traits: more lodging, higher HSW and lower visual scoring. Among them, Genotypes 4 and 139 were highlighted. In contrast, Genotypes 31, 36, 40, 79, 126, 147 and 169 had good visual traits, low LD, but lower HSW. Genotype 118 had high HSW, lower AC, but low AV.
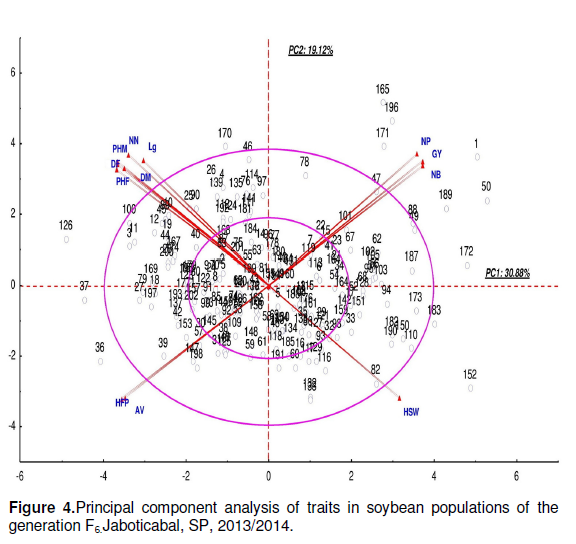
A principal component analysis without separation process had been performed with all variables to seek for specific genotypes (Figure 4). In PC1 Genotypes 36, 37, 126 and 170 which differentiated in the outer region of the larger circle, were characterized by greater DF, PHF, DM, PHM, NN, LD, HFP and AV in addition to lower grain yield. In contrast, Genotypes 1, 47, 49, 189, 50, 88, 152, 165, 171, 172, 183 and 196 displayed higher grain yield and lower HFP and AV. Moreover they were earlier, shorter and more resistant to lodging.
The significant differences of DF, PHF, PHM, HFP, NN, NP, GY and HSW detected by ANADEVI indicated a high variability among studied population. They also indicated that the variance components and their respective coefficients of determination were significantly different from zero in agreement with Resende (2007a).
However, the non-significance of: DM, LD, AV and NB may indicate a narrowing of genetic variation as a result of lower divergence between the parents, being little contrasting to the characteristics analyzed. LRT equal to zero was observed for DM, LD and NB, which corresponded to a lack of genetic variability.
The variability of DF trait may be explained by the presence of early and late cultivars in the preparation of the crossings. However, DM is as important as DF, which did not vary significantly. It is noteworthy that, the estimates of flowering date and other soybean growth stages are highly relevant for culture management, and for growth and yield modeling. This information can assist crop management under adverse conditions, such as lack of water and lodging (Rodrigues et al., 2001). Therefore, according to the climatic conditions of the region, it is possible to stagger planting and harvesting (Almeida et al., 2011).
Evaluation of PHF is associated with searching for earlier cultivars with good productivity. Genotypes with the greatest height at flowering tend to have higher productivity and shorter cycles when accompanied by lower DF
Carvalho et al. (2002) reported that this trait may help to select for yield, and being very effective in the selection of more productive strains. Moreover, they also noted that PHM displayed positive correlation with productivity, but PHF showed slightly higher correlation values with productivity.
Furthermore, the ideal HFP of soybean crops, under most conditions, is about 15.0 cm, although most modern harvesters can harvest well when the first pod insertion is as low as 10.0 cm (Rocha et al., 2012). However, this trait did not show significant correlation with grain yield (Muniz et al., 2002).
In addition, there is positive correlation between the PHM and LD. Buezzello et al. (2013) observed that the reduction of height of soybean plants was strongly associated to the lodging reduction, contributing to the increase in grain yield of the crop.
Studies have shown that NN and NP display positive correlation with grain yield (Muniz et al., 2002; Arshad et al., 2006; Dalchiavon and Carvalho, 2012), also contributing to indirect selection of genotypes.
The traits GY and HSW are highly correlated (Arshad et al., 2006), where GY is the plant individual output and HSW is related to the vigor of seeds and consequently of the plant, and being a production/yield component, as well.
Regarding to the studied traits, the ideal genotype sought should have high GY and AV. It should be earlier (lower DF and DM), resistant to lodging (LD = 1) while PHM should range from 0.80 to 1.0 m, and PHF higher or equal to 10.0 cm. The other studied traits (NDF, PHF, NB, NN, NP and HSW) are expected to enhance the selection of genotypes through correlations with more important genotypic traits.
The low values ​​obtained for the CVg/CVe ratio when studying the genetic parameters may indicate lower experimental precision or higher number of genes controlling the trait. The fact that they are smaller than unity indicates unfavorable conditions for the selection of genotypes for these traits (Mistro et al., 2004). The heritability (h2), on the other hand, shows potential for selection within experiments (Borges et al., 2010a). However, the values of h2 in this study were obtained by REML, which avoids the overestimation of h2.
The desirable characteristics for a soybean breeding program, in addition to selecting the most productive genotypes, are the earlier genotypes and heights that do not cause lodging. However, if inadequate tools are used there is the risk of selecting genotypes with poor agronomic traits, such as lower AV scores and lower pod insertion heights, which are not desired.
The characteristics number of days to flowering, plant height at flowering, plant height at maturity, insertion height of first pod, number of nodes, number of pods, grain yield and hundred seeds weight are suitable for the selection process, once they showed high genetic variability. Three agronomic selection processes were identified to select genotypes that discriminate genotypes containing properties that are more specific.
The selection strategy containing the variables insertion height of first pod, number of branches, number of pods, number of nodes and grain yield allowed the selection of soybean genotypes with good yield components, more early, smaller sizes and lodging resistance.
The junction between mixed model via REML/BLUP and the applied multivariate statistic using factor analysis helped to select suitable genotypes with high performance to carry on the soybean plant-breeding program.
The authors have not declared any conflict of interests.
The authors are thankful to all coworkers, to Universidade Estadual Paulista “Júlio de Mesquita Filho”, FAPESP (Fundação de Amparo à Pesquisa do Estado de São Paulo) and CAPES (Coordenação de Aperfeiçoamento de Pessoal de Nível Superior) for the financial support.
REFERENCES
|
Almeida RD, Peluzio JM, Afférri FS (2011). Divergência genética entre cultivares de soja, sob condições de várzea irrigada, no sul do Estado Tocantins. Rev. Ciênc. Agron. 42:108-115.
|
|
|
|
Arshad M, Ali N, Ghafoor A (2006). Character correlation and path coefficient in soy bean Glycine max (L.) Merrill. Pak. J. Bot. 38:121-130.
|
|
|
|
|
Barreto JF, Resende MDV (2011). Avaliação genotípica de acessos de mandioca no Amazonas e estimativas de parâmetros genéticos. Rev. Ciênc. Agrár. 53:131-136.
Crossref
|
|
|
|
|
Bizari EH, Unêda-Trevisoli SH, Vianna VF, Meyer AS, Mauro AA (2014). Genetic diversity in early-maturing soybean genotypes based on biometric and molecular parameters. Int. J. Food Agric. Environ. 12:259-265.
|
|
|
|
|
Borges V, Ferreira PV, Soares L, Santos GM, Santos AMM (2010a). Seleção de clones de batata-doce pelo procedimento REML/BLUP. Acta Sci. Agron. 32:643-649.
Crossref
|
|
|
|
|
Borges V, Soares AA, Reis MS, Resende MDV, Cornélio VMO, Leite NA, Vieira AR (2010b). Desempenho genotípico de linhagens de arroz de terras altas utilizando metodologia de modelos mistos. Bragantia 69:833-841.
Crossref
|
|
|
|
|
Buezzello GL, Trezzi MM, Marchese JA, Xavier E, Miotto Júnior E, Patel F, Debastiani F (2013). Action of auxin inhibitors on growth and grain yield of sybean. Rev. Ceres. 60:621-628.
Crossref
|
|
|
|
|
Carvalho CGP, Arias CAA, Toledo JFF, Oliveira MF, Vello NA (2002). Correlações e análise de trilha em linhagens de soja semeadas em diferentes épocas. Pesqui. Agropecu. Bras. 37:311-320.
Crossref
|
|
|
|
|
Cavalcante AK, Sousa LB, Hamawaki OT, Araujo GO, Romanato FN (2010). Variabilidade genética de genótipos de soja de ciclo precoce no município de Uberaba-MG. Rev. Verde Agroecol. Desenvolv. Sustent. 5:115-119.
|
|
|
|
|
Costa M, Pereira WE, Bruno RLA, Freire EC, Nóbrega MBM, Milani M, Oliveira AP (2006). Divergência genética entre acessos e cultivares de mamoneira por meio de estatística multivariada. Pesqui. Agropecu. Bras. 41:1617-1622.
Crossref
|
|
|
|
|
Cruz CD, Regazzi AJ, Carneiro PCS (2012). Modelos biométricos aplicados ao melhoramento genético. 4 Ed. UFV. Viçosa.
|
|
|
|
|
Dalchiavon FC, Carvalho MP (2012). Correlação linear e espacial dos componentes de produção e produtividade da soja. Semin. Ciênc. Agrár. 33:541-552.
|
|
|
|
|
Dallastra A, Unêda-Trevisoli SH, Ferraudo AS, Mauro AOD (2014). Multivariate approach in the selection of superior soybean progeny which carry the RR gene. Rev. Ciênc. Agron. 45:588-597.
|
|
|
|
|
Duarte JB, Vencovsky R, Dias CTS (2001). Estimadores de componentes de variância em delineamento de blocos aumentados com tratamentos novos de uma ou mais populações. Pesq. Agropec. Bras. 36:1155-1167.
Crossref
|
|
|
|
|
Fehr WR, Caviness CE (1977). Stages of soybean development. Iowa State University of Science and Technology. Ames.
|
|
|
|
|
Gomez GM, Unêda-Trevisoli SH, Pinheiro JB, Mauro AO (2014). Adaptative and agronomic performances of soybean genotypes derived from different genealogies through the use of several analytical strategies. Afr. J. Agric. Res. 9:2146-2157.
Crossref
|
|
|
|
|
Kaiser HF (1958). The varimax criterion for analytic rotation in factor analysis.Psychometrika. 23:187-200.
Crossref
|
|
|
|
|
Klahold CA, Guimarães VF, de Moraes Echer M, Klahold A, Contiero RL, Becker A (2006). Resposta da soja (Glycine max (L.) Merrill) à ação de bioestimulante. Acta Sci. Agron. 28:179-185.
|
|
|
|
|
Lopes VR, Bespalhok Filho JC, Oliveira RA, Guerra EP, Zambon JLC, Daros E (2008). Genetic divergence and parent selection of sugarcane clones. Crop Breed. Appl. Biotechnol. 8:225-231.
Crossref
|
|
|
|
|
Maia MCC, Resende MDV, Paiva JR, Cavalcanti JJV, Moura Barros L (2009). Seleção simultânea para produção, adaptabilidade e estabilidade genotípicas em clones de cajueiro, via modelos mistos. Pesqui. Agropecu. Trop. 39:43-50.
|
|
|
|
|
Maia MCC, Vello NA, Rocha MM, Pinheiro JB, Silva Júnior NF (2006). Adaptabilidade e estabilidade de linhagens experimentais de soja selecionadas para caracteres agronômicos através de método uni-multivariado. Bragantia 65:215-226.
Crossref
|
|
|
|
|
Manly BFJ (2008). Métodos estatísticos multivariados: uma introdução. 3° ed. Bookman. Porto Alegre.
|
|
|
|
|
Mendonça O, Carpentieri-Pípolo V, Garbuglio DD, Fonseca Junior NS (2007). Análise de fatores e estratificação ambiental na avaliação da adaptabilidade e estabilidade em soja. Pesqui. Agropecu. Bras. 42:1567-1575.
Crossref
|
|
|
|
|
Mistro JC, Fazuoli LC, Gonçalves PdS, Guerreiro Filho O (2004). Estimates of genetic parameters and expected genetic gains with selection in robust coffee. Crop Breed. Appl. Biotechnol. 4:86-91.
Crossref
|
|
|
|
|
Muniz FRS, Mauro AOD, Unêda-Trevisoli SH, De Oliveira JA, Bárbaro IM, Arriel NHC, Costa MM (2002). Parâmetros genéticos e fenotípicos em populações segregantes de soja. Rev. Bras. Ole. Fib. 6:609-616.
|
|
|
|
|
Nelder JA, Wedderburn RWM (1972). Generalized Linear Models. J. Roy. Stat. Soc. 135:370-384.
Crossref
|
|
|
|
|
Oliveira ACB, Sediyama MAN, Pedrosa MW, Garcia NCP, Garcia SLR (2008). Divergência genética e descarte de variáveis em alface cultivada sob sistema hidropônico-DOI: 10.4025/actasciagron. v26i2. 1894. Acta Sci., Agron. 26:211-217.
|
|
|
|
|
Peluzio JM, Vaz-de-Melo A, Afférri FS, Silva RR, Barros HB, Nascimento IR, Fidelis RR (2009). Variabilidade genética entre cultivares de soja, sob diferentes condições edafoclimáticas. Pesq. Apl. Agrotec. 2:21-40.
|
|
|
|
|
Resende MDV (2007a). Matemática e estatística na análise de experimentos e no melhoramento genético. 1° ed. Embrapa Florestas, Colombo.
|
|
|
|
|
Resende MDV (2007b). SELEGEN-REML/BLUP: sistema estatístico e seleção genética computadorizada via modelos lineares mistos. Embrapa Florestas, Colombo.
|
|
|
|
|
Rezende PM, Carvalho EA (2007). Avaliação de cultivares de soja [Glycine max (L.) Merrill] para o sul de Minas Gerais. Ciênc. Agrotec. 31:1616-1623.
Crossref
|
|
|
|
|
Rocha RS, Silva JAL, Neves JA, Sediyama T, Teixeira RC (2012). Desempenho agronômico de variedades e linhagens de soja em condições de baixa latitude em Teresina-PI. Rev. Ciênc. Agron. 43:154-162.
|
|
|
|
|
Rodrigues O, Didonet AD, Lhamby JCB, Bertagnolli PF, Luz Jd (2001). Resposta quantitativa do florescimento da soja à temperatura e ao fotoperíodo. Pesqui. Agropec. Bras. 36:431-437.
Crossref
|
|
|
|
|
SAS Institute (2011). SAS 9.3 Output Delivery System: User's Guide. SAS institute, Cary, NC.
|
|
|
|
|
StatSoft I (2004). STATISTICA (data analysis software system), version 7. View
|
|
|
|
|
Vianna VF, Unêda-Trevisoli SH, Desidério JA, Santiago S, Charnai K, Ferreira Júnior JA, Ferraudo AS, Mauro AO (2013). The multivariate approach and influence of characters in selecting superior soybean genotypes. Afr. J. Agric. Res. 8:4162-4169.
|
|