ABSTRACT
Agriculture plays a key role in the economy and quality of life. How to best employ available resources in order to improve productivity, profitability and sustainability of these processes has been the subject of many studies. This study aims to analyse by multi-index methodology the expected return and risks associated with investment in agribusiness, particularly on what concerns the implantation viability of a vegetable-washing machine. It thus listed the production and maintenance costs of carrot and cucumber cultures, as well as cleaning costs and the profitability and inherent risks of the implementation. Having in mind that this research requires empirical and analytical evidences as well as a case study, a company located in South-eastern Brazil was chosen by means of an applied research. Data from a Minimum Acceptable Rate of Return (MARR) of 6% per year was collected by documental research and semi-structured interviews systematized in a cash flow projected within the respective deadlines. Results indicate an Additional Return Over the Investment (AROI, 16.06%) higher than the MARR for carrots and 14.94% higher for cucumbers. These results show that when a competitive strategy of vegetable cleaning through a machine is employed, with expectation for return in 24 months, the impacts are positive, signalling high profitability and compatible risks with the expected return, reinforcing the soundness of such an investment in agribusiness.
Key words: Agribusiness, agriculture, investment, multi-index methodology.
Agriculture is one of the most important segments in the global economy. Agriculture is by far the biggest user of water, accounting for more than 70% of all water utilization worldwide and 90% of water utilization in developing countries (Dwivedi et al., 2015). The agriculture development strategies of most of these countries depend on the possibility of maintaining, improving, and expanding irrigated agriculture (Siebert et al., 2006). However, as the pressure on water resources increases, irrigation is facing growing competition from other water-use sectors and becoming a threat to the environment in an increasing number of regions. Despite the current problems and negative perceptions in many sectors of society (Hoffman and Evans, 2007), it is certain that irrigation and the proper use of water will continue to be essential to the welfare and development of the world.
A part of this segment, the vegetable sector, is a branch of agribusiness in rapid growth, mobilizing millions of Brazilian reais (BRL) annualy throughout all of its supply chain, from the production to the final customer (Kureski et al., 2015; Zhong et al., 2015). In Brazil, according the Instituto Brasileiro de Geografia e Estatística – IBGE, annual vegetable consumption per capita is around 27.08 kg, split in three groups: (i) leafy and floral vegetables: average 3.22 kg, (ii) fruity vegetables: average 12.60 kg, and (iii) root bulb vegetables and others: average 11.26 kg (IBGE, 2008). The southern region, a focal point of this study, is according to the IBGE Data (2008), a region that is more highlighted, having an average annual consumption of 38.60 kg per capita, followed by the south-eastern region with 27.99 kg, central-western with 26.65 kg, north-eastern with 22.07 kg, and northern region with 19.41 kg (IBGE, 2008).
The vegetables commercialized in Paraná’s state in 2012 amounted to 552,418.70 tons, which were worth R$ 705,797990.00, at an average price of R$1.27/kg (CEASA-PR, 2012). The fruit group amounted to 512,196.30 tons, with average price of R$1.57/kg and the total value of R$ 804,534.560.00 (CEASA-PR, 2012). Even with a tendency for growth in the region, a city located in South-eastern Paraná, Campo do Tenente, had a significant reduction in its production (58.71%), caused by the waver and/or reduction in the amount of local products, particularly, roots and tubercles, which are no longer commercialized in CEASA-PR Units (2012). It was in this context that the problem which guides this study arose: how to increase vegetable sales in this region? Considering the growth of the vegetable sector in other regions, measures to increase and/or modernize available machinery and equipment are necessary, aimed at increasing revenue and consequently the growth of companies operating in the sector. The adoption of irrigation technologies and water-management practices and their resulting costs, with wise resource usage, can affect the production of goods, farm profitability, and environmental quality, as well as customer satisfaction with regard to product price and quality.
This study has the objective of analysing the return expectations and risks related to the investment in a vegetable-washing machine, looking at the main indicators, verifying which benefits this investment will bring to the company under analysis and if the acquisition of such a machine can add value to the production sale.
The main contribution of this study for the literature and practical implications is the importance in indicating what is the most convenient among investments in agribusiness, in the vegetables sector, with evidences of practical information that help the managers take decisions. This way, it presents options that will bring a higher return in a reduced timespan, with the implementation of competitive strategies based on the internal resources of the firm.
The market of fruits, greenery and vegetables (FGV)
The concern with the consumption of fresh and healthy food has been rapidly increasing, in the same rate at which concerns with beauty and mainly health, increase. The costumers are ever more aware of medicinal and nutritional discoveries of food, seeking quality in what is consumed, which in turn collaborates with the sale increase in the FGV sector (Bublitz and Peracchio, 2015).
A research from Agriculture and Livestock Confederation of Brazil about the consumption of fruits and vegetables showed that a reduced rate of only 18.2% of Brazilians ingest the recommended amount of fruits proposed by the World Health Organization (WHO), that is 400 g per day or 146 kg per year. Another data from the research is that Brazilians spend, on average, only 6.2% of their income with the acquisition of fruits, greenery, and vegetables. The habit of consuming fruits is not very strong even though Brazil is the world’s third largest fruit producer (CNA, 2011).
The retailers have some barriers to overcome to get better results in the FGV’s trading, starting from the difficulties found in their own products supply, where the quality, the variety, and the prices are often below expectations. In the products' delivery, flaws worthy of note include products harvested out of season and their resulting inferior quality in the form of poor size and appearance; poor harvests that raise the products’ price and faulty supplying that makes the product unavailable to the customer, among others (SEBRAE, 2012). A research from Associação Paulista de Supermercados (APAS, 2006) showed that the sale of FGV grew up much in the retail and currently, represents between 8 and 12% of the supermarket’s revenue, which can become an opportunity for the retailer who knows how to take advantage from assortment and strategies of sector trading.
The process of food washing
The process of food washing consists in the activity post-crop, aiming to add value to the product sale. The washing is the operation where the vegetables pass by a detailed process of cleaning made by specific machines and equipment.
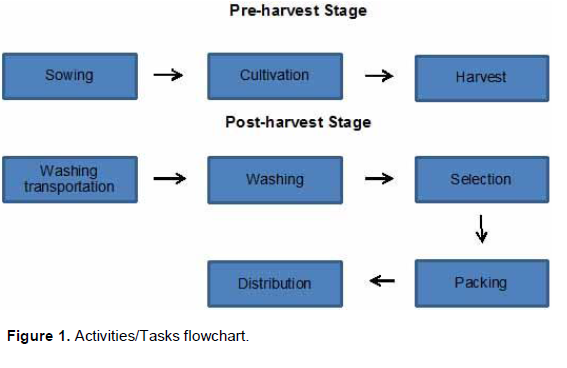
The process occurs in the following way: the vegetables harvested are forwarded to a deposit as they are. In this deposit lie the cleaning machines where the cleaning is done and vegetables are packed for transportation up to consumer centres, as shown in the flowchart Figure 1.
Picture 1: Activities/Tasks flowchart
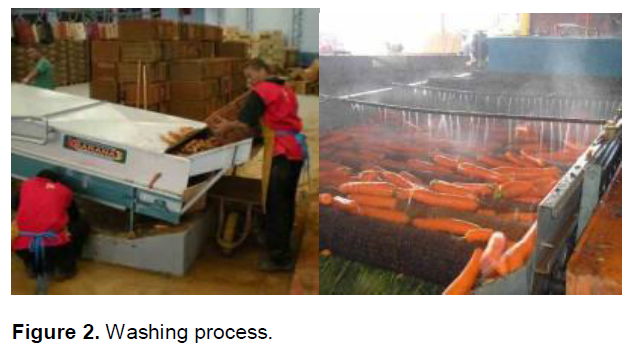
In the first stage, the washing process happens when the products to be washed are inserted in a conveyor belt, as shown in Figure 2. The washing system consists of brushes with soft nylon bristles; such as, brushes overlap and are accompanied by a water shower, both being responsible for the cleaning, while the items are in movement. This process allows the products to undergo complete cleaning before proceeding to the classification belts.
Picture 2: Washing process
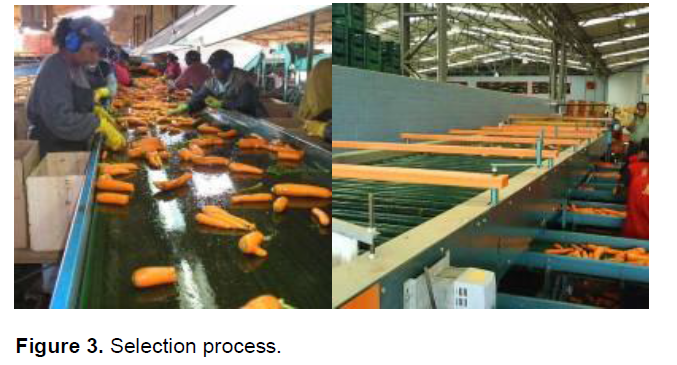
In the second stage, the products go by the belt towards manual selection, where they are handpicked for good quality and presentation before being forwarded for sale. Products with poor quality are disposed, as shown in Figure 3.
Picture 3: Selection process
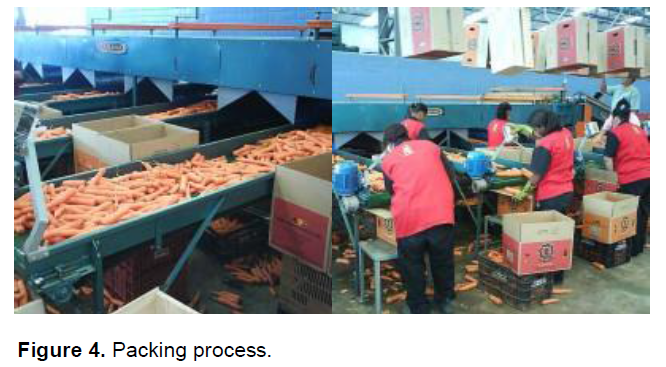
In the third stage, the products are packed, usually in boxes, and
forwarded to consumption centres, as shown on Figure 4.
Picture 4: Packing process
With the investment and implantation of vegetable-washing machines, the producer can: (i) wash; (ii) classify; (iii) pack and trade the produce. As an added benefit, the producer can create his own brand and packages, a fact that can add value and allow better control and significant reduction of waste in the production.
Competitive strategies
Because of the competitiveness, strongly boosted by globalization, companies must be flexible in order to react quickly to changes in the competition and market in general. The basis for a competitive strategy is to create differentials from the main competitors in the market. It means to choose in a deliberate way a different group of activities to provide a higher value mix (Porter, 2005). In this respect, it is necessary to know that the adoption of incorrect competitive strategies can compromise the results of an industry.
Nevertheless, to prevent this, Porter (2005, p. 46) affirms it is fundamental that the companies foster essential competences in the race to remain ahead of other market competitors.
In the search for market participation, the competition does not only happen in relation to the contestant, but in all of the supply chain. The competition's state in a sector depends on five basic powers, which are: (i) bargaining power with clients and (ii) suppliers; (iii) threats of new entrants and (iv) surrogate products. Lastly, the (v) rivalry among the contestants. The set of these competitive powers determines the profitability and/or maximum potential profit of a sector (Porter, 2005).
In the context of this research, the competitive strategy applied will be the internal resources implantation (Barney, 1991) controlled by the companies; a vegetable-washing machine through which the producer can add value to the final product sale, distinguishing oneself among the main competitors of the sector.
Rural accounting
Rural accounting is still little used by rural entrepreneurs as well as accountants. This often happens due to the lack of knowledge regarding the importance of information obtained by means of accountancy, and how this information can help in decision-taking (Abib et al., 2015; Freitas Filho et al., 2002).
The importance of rural accounting is given by supplying information about expansion conditions, about urges for cost and expense reduction, needs in resource gathering having planning strategies as the objective. Furthermore, the accounting information is interesting for the investors, suppliers, banks, financial institutions, clients, and rural companies’ managers too. This information can tell if the investment is safe and if there is possibility of a rapid return (Crepaldi, 2012).
Accountancy can be studied in a general way, for all the companies, or in a particular one, being applied in a determined field of activity or economy sector. When applied in a specific field, it is usually denominated according to the activity of that field. Thus, rural accounting is the general accounting applied to rural companies. The rural companies are those that explore the soil’s productive capacity by means of land cultivation, livestock farming and the transformation of determined agricultural products (Marion, 2014).
Costs and expenditures in agricultural activity
Agricultural accounting needs, in any system, to distinguish between costs and expenditures. The distinction is easy: costs are expenses (or economic sacrifices) relating with assets transformation, for example, the consumption of inputs or salary payments. The expenditure consists of expenses that provoke reduction of patrimony, for example taxes, sales commissions, among others (Crepaldi, 2012). In Marion's (2014) opinion, the difference between crop costs and periodic expenditures to the agricultural activity is based on: (i) the crop costs, (ii) period's expenditure, (iii) harvest, (iv)storage, and (v) losses.
Investment projects
An investment project can be interpreted as an effort to raise the information level regarding all the implications, whether desirable or undesirable, in order to reduce the risk level (Souza and Clemente, 2008). The development and improvement of the project aims primarily at the reduction of the uncertainty level, but may also result in the alteration of estimated gains of each opportunity and even in the spotting of new opportunities. Regarding investment, the term can be defined in a wide way like money application in insurances, shares, properties, machinery, among others, with the purpose of obtaining gain (Hoji, 2011).
An investment for a company is a disbursement made aiming at a flow of future benefits, usually more than a year away from the present time. In a broad sense, the term is employed in the purchase of machines, equipment and properties for the installation of productive units, as well as for the purchase of financial titles, for example (Souza and Clemente, 2008). The objective of an investment analysis is to compare investment options and observe which present a better return, with the lower possible risk for the organization. The investment is always made with the intention of generating profit and bringing some improvement for the company, mainly long term ones.
Risk and return
The risk can be understood as an uncertainty measure associated with expected returns of an investment decision. Therefore, the risk is a cost always involved in the business, so it must be quantified (Assaf Neto, 2010). The word risk is used when the available information is enough to determine the possible events and assign them probabilities. That is why the decisions of investments never happen under conditions of full certainty. The analysis will be in confrontation with situations of uncertainty and risk, in bigger or smaller levels (Abib et al., 2015; Souza and Clemente, 2008).
Every rational financial decision is taken based on analysis between risk and return. The investments do not offer certainty related to their future results, and can generate high and low returns. When the results do not float so much, it is understood that the decision presents a lower risk. For example, applications in fixed income insurances produce more stable and predictable returns than the returns in shares; because of this, they are admitted as having a lower risk.
The return is the amount of resources that one receives or expects to receive when making any capital expenditure, in other words, investments (Ross et al., 2011). There is no possibility for expecting high returns in assets of low risk. A major level of risk must offer major return to the investor, in such a way as to compensate for the high risk business. The relation between risk and return is proportional, and an additional compensation should always be provided for running greater risks (Assaf Neto, 2010).
Multi-index methodology
The multi-index methodology applied in this study was proposed by Souza and Clemente (2008). It consists of supporting the decisive process related to acceptance or rejection of certain investment projects by means of using many indicators. The first group consists of the indicators: PV (present value), NPV (net present value), ANPV (annual equivalent net present value), BCI (benefit/cost index and Aditional Return Over the Investment (AROI)). The additional return resulting from the investment is used to improve the perception of projected financial returns. The second group is formed by: Decison Risk (MARR/IRR as a proxy of P(NPV <=0). Period of Return on Investment/Period (Payback/N), Degree of Revenue Commitment (DRC), Risk Management (RM), and Business Risk (BR), used to improve the project risk perception. The essence according to Souza et all (2015), of multi-index methodology consists of:
- Not incorporating the risk premium as a spread about the MARR;
- Expressing the project profitability by means of AROI as an additional return beyond what would be earned by applying the capital in low risk insurances;
- Using the environmental analysis to deepen the evaluation about involved risks;
- Confronting the expected gains with the risks perception in each project.
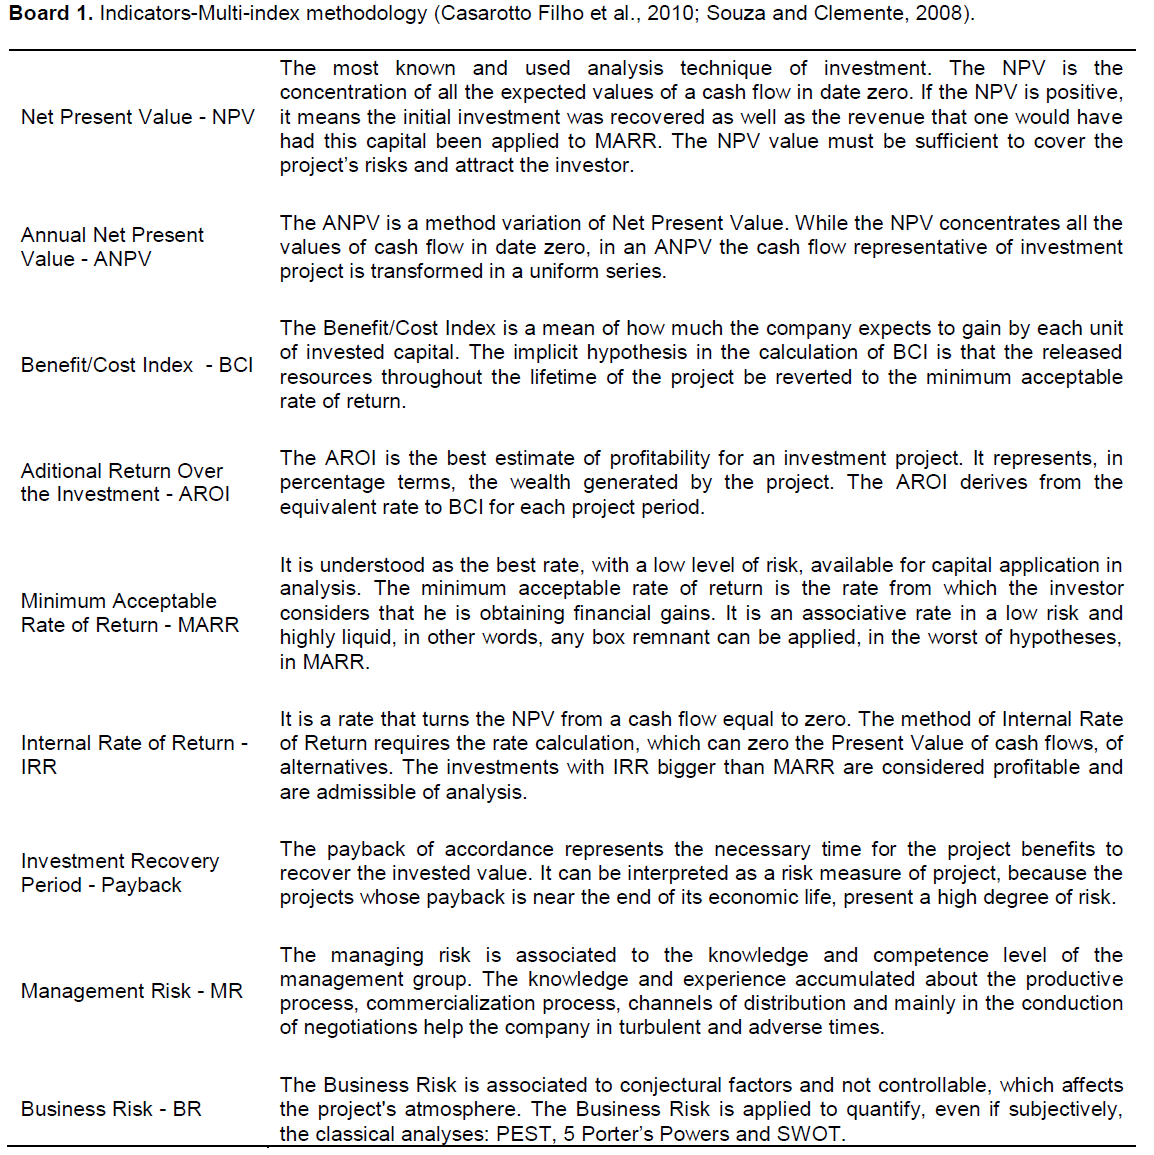
In the multi-index methodology, five risk indicators are used to evaluate the perceived project’s risk: (i) Index MARR/IRR as probability's proxy to get bigger return in financial applications of low risk than in the project; (ii) Pay-back index as probability's proxy of not recovering from the loss of invested capital; (iii) Degree of Revenue Commitment to evaluate the operational risk, in other words, to evaluate the perception of maximum revenue that is compromised with the payment of costs and expenditures; (iv) Management Risk to evaluate the manager group competence level to accomplish the enterprise successfully; (v) Business Risk for quantifying, even subjectively, the classical analyses: PEST, 5 Porter’s Powers, and SWOT. These indicators help in the perception of expected behaviour between risk and return; in other words, bigger risks may increase the expected return. These indicators have their concepts presented in Board 1.
Monte Carlo simulation: Crystal ball
The Crystal Ball software runs predictions and risk analysis by probability, removing the uncertainty in decision-taking. By means of a technique called Monte Carlo simulation, Crystal Ball predicts all the possible results for the analysed situation and also shows its levels of confidence so that one can know the probability of occurrence of any specific event. The Monte Carlo simulation is a sort of simulation in spreadsheet that generates random values to uncertain variables repeatedly, simulating thus a model. The analysis of a risk spreadsheet uses the model and also the simulation to analyse the variation effects of entrances in results of the modelled system (Charnes, 2007). This analysis tool helps in taking decisions through simulations in models of spreadsheet. The predictions which result from these simulations help quantify the risk areas; decision takers can thus have all possible information to take the best decisions. With the Monte Carlo simulation, Crystal Ball demonstrates the results' forecast chart that shows us all the possible results and the probability of achieving each one of these results, and presents all the possible predicted scenarios.
RESEARCH CHARACTERIZATION
In this study, the research related with its nature is revealed as applied research, because it is focused on the solution of specific problems (Gil, 2010). Regarding the objectives, the research presents a descriptive content, because it has as its objective the description, interpretation, and analysis of the data about the expectations of return and risk on investing in a vegetable-washing machine. The approach strategy used in this study has as typology a case study, having as its objective informing the researcher about the situation, facts, values, and behaviours in the analysed cases. On what concerns the technical procedures for data gathering, the research can be defined as documental (Beuren, 2008). For the time section, the research tells about a longitudinal study and temporal aspect, framing in the analysis of quantitative data, because it was made with an application for study of risk variables and return, survey calculations and analysis of the investment return (Richardson, 1999).
Collection, treatment and data analysis
For the data collection, a checklist was elaborated prior to all, else guiding the data survey process (Beuren, 2008). For effective data collection, interviews with the rural producer were conducted, within the studied property, during the months of August, September, October, and November of 2014. After the interviews, electronic spreadsheets were created with the EXCEL software to ascertain and calculate the indicators PV, NPV, ANPV, AROI, BCI, IRR, and Payback, used in the analysis survey of investment in an asset; in this case, the vegetable-washing machine.
This study highlights the application of Multi-Index Methodology proposed by Souza and Clemente (2008), which consist of supporting the decision process related to the acceptance or rejection of investment project using many indicators. For the study composition, the Crystal Ball software, which runs predictions and risk analysis by probability, was used, thus eliminating the uncertainty in decision-taking, therefore achieving the presented results.
The current study identifies the production costs of carrot and cucumber crops and subsequently the value-enhancement by implantation and purchase of a vegetable-washing machine. This research comprehends, initially, the operational cost of labour and equipment to prepare the land, sowing and post-planting care and consumed inputs. These were measured for the production of 1 hectare of carrots and 1 hectare of cucumber.
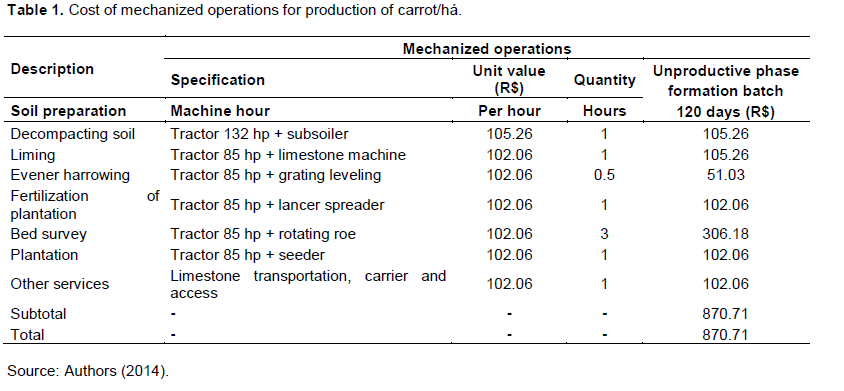
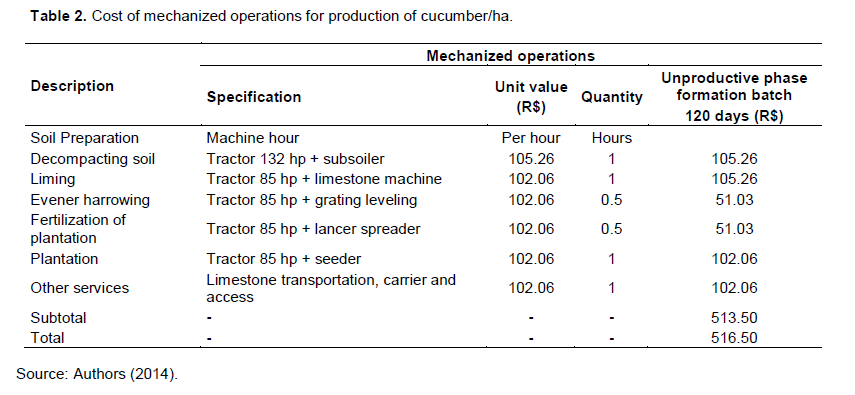
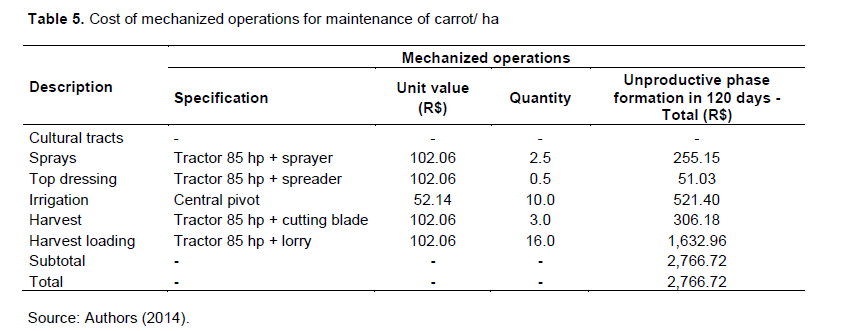
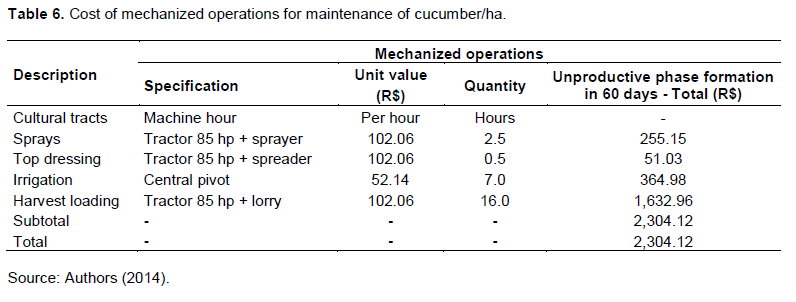
For the production and maintenance costs survey, mechanized and manual operations were separated from the production itself. The mechanized operations were calculated from tractor use, based in the cost per hour, according to Marion (2014), added of depreciation and other inputs as shown in Tables 1 and 2.
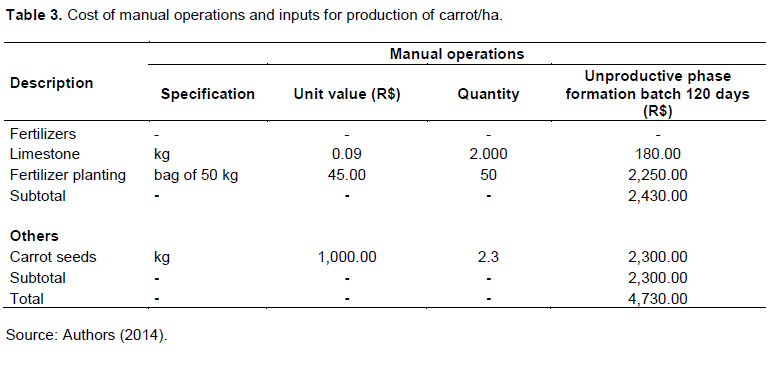
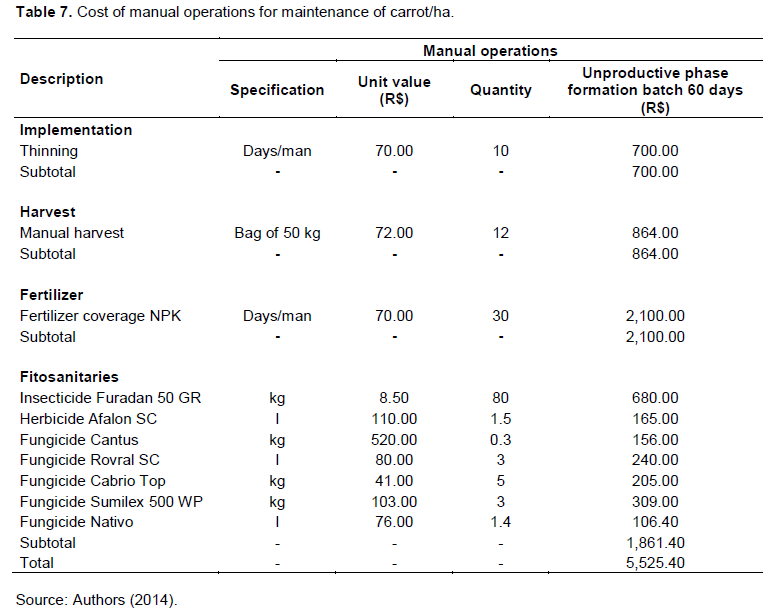
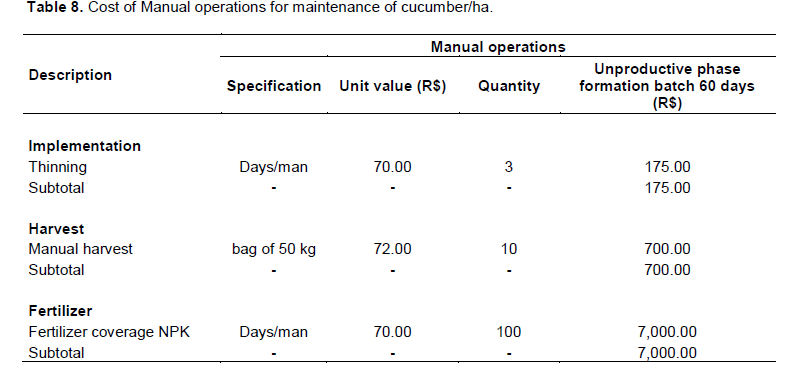
The manual operations were calculated from working hours, based in the hour/man cost, according to Marion (2014), added of charges. Also aggregated were the inputs applied in this stage, displayed on Tables 3 and 4.
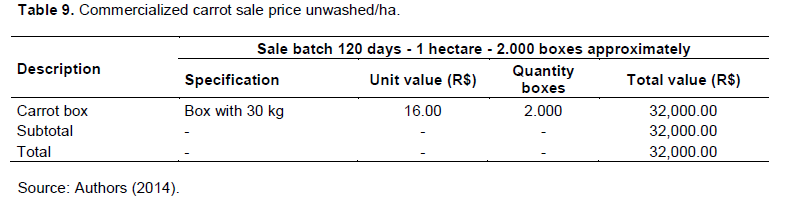
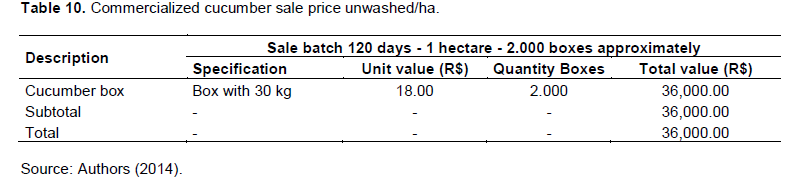
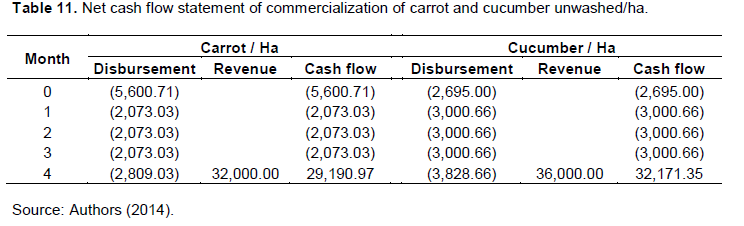
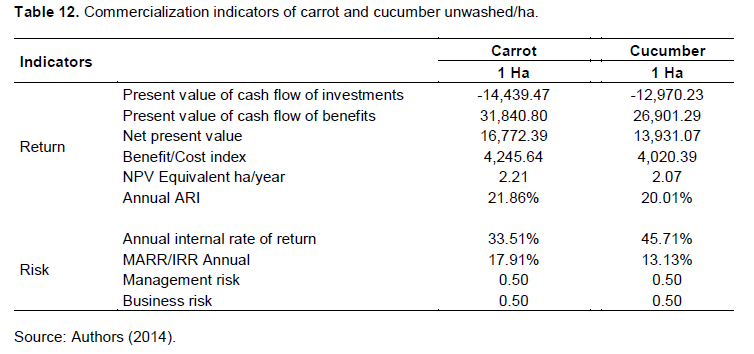
In Tables 5 and 6, the mechanized operations for carrots and cucumber maintenance, for example, spraying, top dressing, among others, are displayed. In Tables 7 and 8, there is a demonstration of the cost for manual operations for carrot and cucumber maintenance, for example, thinning/slashing harvest and also the inputs that are applied in this stage. Discriminated on Tables 9 and 10 is the sale price practiced for commercialization of unwashed carrots and cucumbers. Table 11 shows the cash flow with the results of the commercialization of unwashed carrots and cucumbers. In Table 12, the indicators found for the commercialization of unwashed carrots and cucumbers are listed.
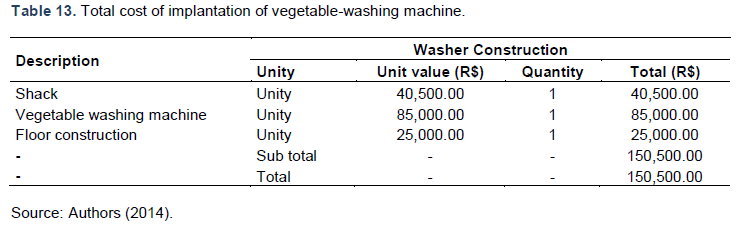
With the objective of implementing a competitive strategy, based on investments in firm’s internal resources, the acquisition of a vegetable-washing machine was conducted. The implantation costs were calculated from the expenditures related to the equipment acquisition itself, to the shack and the floor construction, demonstrated in Table 13.
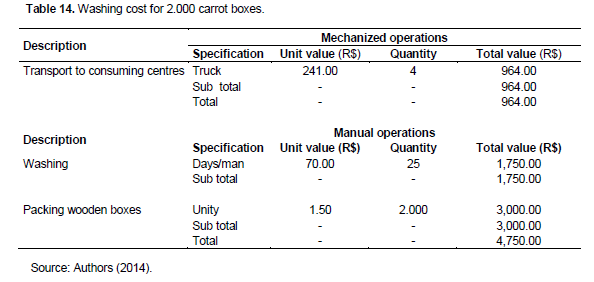
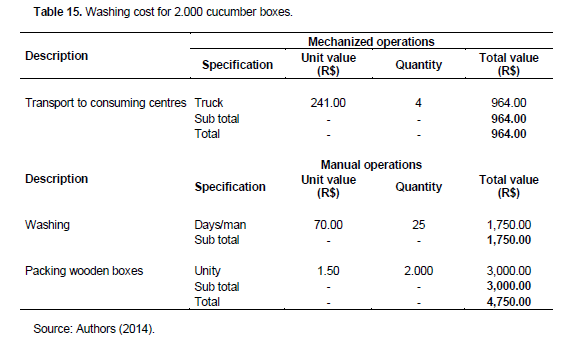
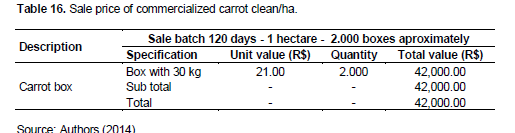
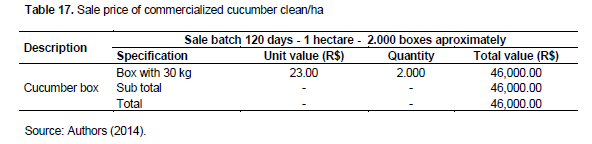
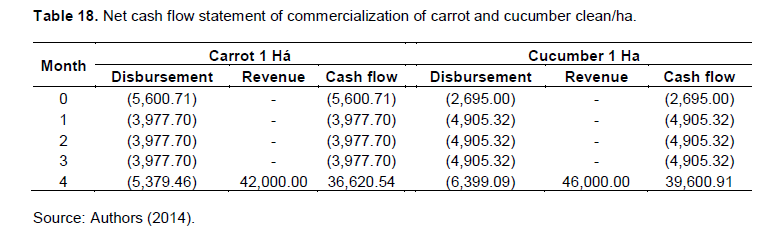
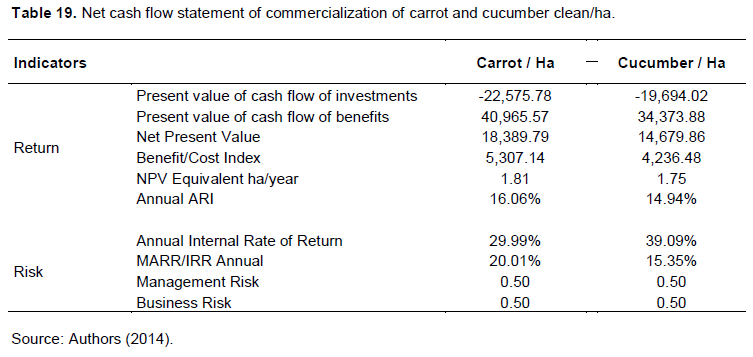
Tables 14 and 15 bring the washing costs of 2.000 carrot boxes and 2.000 cucumber boxes and they are: (i) washing, (ii) crate for packing and the (iii) transportation to consumer’s centres according to Tables 16 to 19. Tables 16 and 17 show sale prices practiced for the commercialization of clean carrots and cucumbers. Table 18 presents the cash flow of clean products, adding the value of production cost, maintenance, and washing. Finally, Table 19 demonstrates the indicators found for commercialization of carrots and cucumbers clean/washed.
Result analysis
The investment analysis in a vegetable-washing machine was elaborated having as base an initial investment of R$ 125,500.00 from a MARR of 6% per year. It is important to highlight that although the machine has a long service life; these indicators were calculated having as base a return expectation in 24 months. Regarding return indicators, when opting for the investment in a vegetable-washing machine, from a MARR of 6% per year, the expectation of recovery of the investments made is confirmed, from a Present Value of R$ 40,965.57 for carrots and R$ 34,373.88 for cucumbers, generating a Net Present Value of R$ 18,389.79 and R$14,679.86 respectively.
The Benefit/Cost Index (BCI), an indicator which measures the return expectation for each capital unity invested; the results show that R$ 1.81 is made for every R$1.00 invested in carrot washing and R$ 1.75 for every R$ 1.00 invested in cucumber washing. The Additional Return of Investment (AROI) associated with implantation of the vegetable-washing machine estimated at 16.06% for carrots washing and 14.94% for cucumbers washing.
Related to the risk indicators, the Internal Rate of Return (IRR) found was 29.99% for carrots and 39.09% for cucumbers, overcoming the MARR used. The index MARR/IRR found were 20.01% for carrots and 15.35% for cucumbers.
The management risk that is associated to experiences and knowledge of the production and commercialization process that the producer has about the issue, can be considered 0.50, in relation to the availability of public or private technical orientation in this segment. Regarding business risk, the levels was also that of 0.50 due mainly to the weather, because the lack of rain can hinder the vegetable production.
Viability analysis by means of Monte Carlo simulation
In the simulation, the uncertain variables utilized were the number of produce boxes (2.000 in the observed harvest) and their respective sales price in each situation (unwashed and washed), denominated presupposition. For the definition of variables: box quantity/ha, the density and triangular probability functions were chosen, being the originally surveyed values considered the most likely ones, with the minimum and the maximum estimated at 10%, there being no need to use the historical data to support the distribution.
On the variable sale price, the probability density function was chosen, attributing the minimum value of R$ 18.90 and the maximum of R$ 23.10 for commercialization of cleaned vegetables, since all the values between the minimum and the maximum are equally probable of occurring, characterizing such as a distribution of uninterrupted probability. For prediction variables, the NPV, IRR and AROI were chosen. The quantity of repetitions considered for the result executed was of 5,000.00. After the simulation execution, it was possible to obtain the frequency graphics, with the minimum values, medium and maximum of variables, median, variance and standard deviation, among other information.
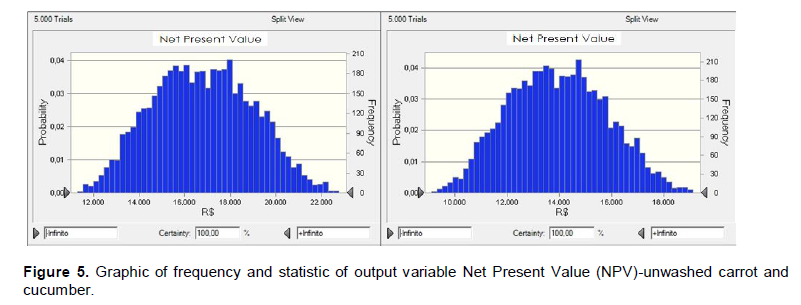
In the next pages, one can visualize the graphics related to the sales price practiced for commercialization of unwashed carrots and cucumbers. Figure 5 demonstrates that the average for the NPV is R$ 16,775.00 for carrots and R$ 13,925.00 for cucumbers, and these values are very near from those found in the Multi-index which are R$16,772.39 and R$13,931.07 respectively. The minimum value was R$11,294.00 for carrots and R$ 9,092.00 for cucumbers, and maximum R$ 22,760.00 for carrots and R$ 19,130.00 for cucumbers.
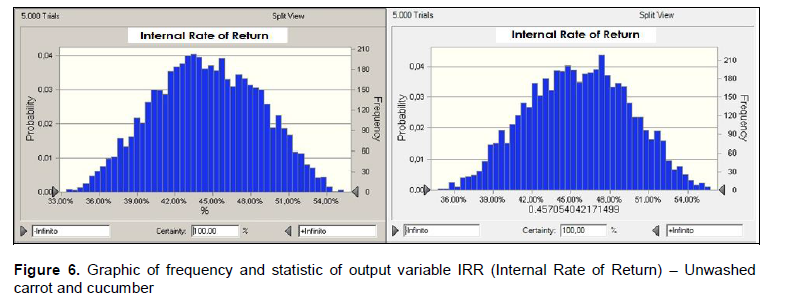
Figure 6 demonstrates that the average for IRR is 44.50%, while for carrots it is 45.57% as well as for cucumbers, values which are very near from those found in the Multi-index, which are 33.51% and 45.71%, respectively. The minimum value was 33.40% for carrots and 34.71% for cucumbers, and the maximum 55.31% for carrots and 55.72% for cucumbers.
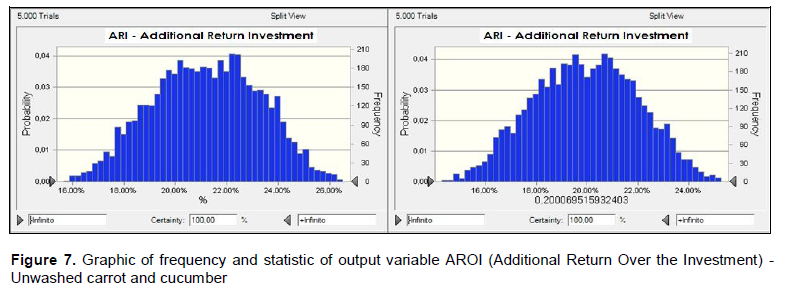
Figure 7 demonstrates that the average AROI is 21.20% for carrots and 19.94% for cucumbers, values very close to those found with the Multi-index, which are 21.86 and 20.01%, respectively. The minimum value was 15.66% for carrots and 14.31% for cucumbers, and maximum of 26.50% for carrots and 25.25% for cucumbers.
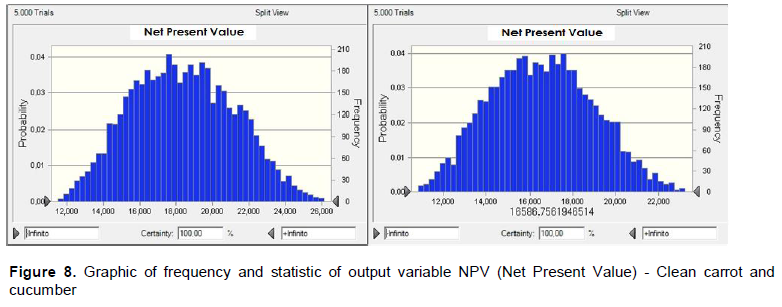
In the next graphics, the results related to the sale price practised for commercialization of carrots and cucumbers clean/washed can be analysed. Figure 8 demonstrates that the average for the NPV is R$ 18,361.00 for carrots and R$ 16,568.00 for cucumbers; values similar to those found in the Multi-index, which are R$ 18,389.79 and R$ 14,679.86, respectively. The minimum value was R$11,510.00 for carrots and R$ 10,842.00 for cucumbers, and the maximum R$ 26,127.00 for carrots and R$ 23,236.00 for cucumbers.
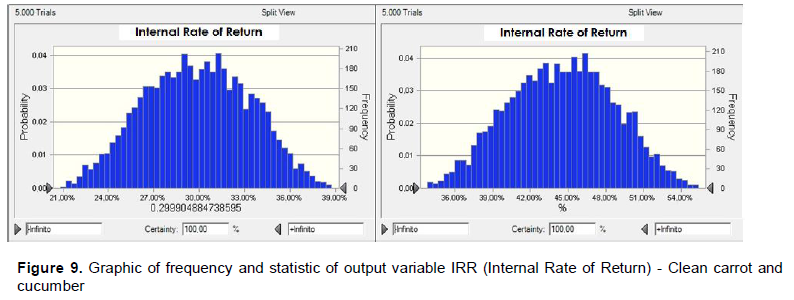
Figure 9 demonstrates that the average for IRR is 29.85% for carrots and 44.50% for cucumbers, values close to those found in Multi-index, which are 29.99 and 39.09%, respectively. The minimum value was 20.83% for carrots and 33.78% for cucumbers, and the maximum of 38.74% for carrots and 55.39% for cucumbers.
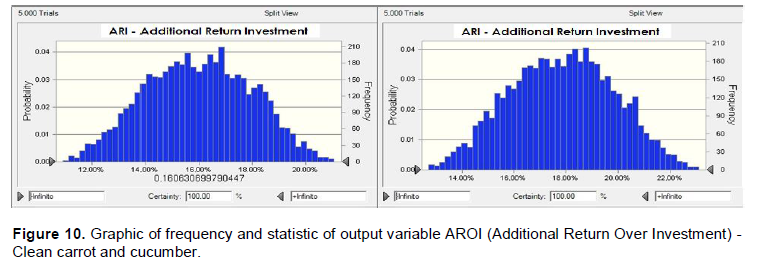
Figure 10 demonstrates that the average for the AROI is 15.99% for carrots and 17.83% for cucumbers, values not unlike those found in the Multi-index, which are 16.06 and 14.94%, respectively. The minimum value was 10.92% for carrots and 12.72% for cucumbers, and the maximum of 21.06% for carrots and 23.08% for cucumbers.
The object t of this research was to analyse return expectations and the risks associated to the implantation of a vegetable-washing machine, bringing to comparison the commercialization of unwashed vegetables and washed/clean ones, through the machine implantation for washing. The Multi-index methodology, proposed by Souza and Clemente (2008), was employed for data analysis. As metrics for validity and comparison, Monte Carlo’s simulations were conducted to verify and confirm the decision of investment in this agribusiness.
The risk indicators for the commercialized vegetables, unwashed/dirty, are NPV of R$ 16,772.39, IRR of 33.51% and AROI of 21.86%, both for carrots. For cucumbers, the indicators found were NPV of R$ 13,931.07, IRR of 45.71% and AROI of 20.01%, all confirmed by the Crystal Ball software.
When a competitive strategy based on the firm’s internal resources was applied by means of the vegetable-washing machine, with return expectations for 24 months, the impact for carrots are NPV of R$ 18,389.79, IRR of 29.99% and AROI of 16.06%. For cucumbers, the indicators found were NPV of R$ 14,679.86, IRR of 39.09% and AROI of 14.94%.
It is worth highlighting that the management and business risks were considered of medium size, given there is availability of public or private technical orientation for the agricultural segment and that this agribusiness is exposed, mainly, to weather interference. Moreover, it was not considered for the marketing of products under review the impact that the appearance of the washed product can bring in negotiating with customers.
The research proposes that the use of Multi-index methodology, its group of indicators for analysis, the return evaluation of investment and the associated risks enhance the rural manager perception, contributing with satisfactory results in his investment portfolio demonstrating the theoretical implication. The obtained results in this study indicate that the investment in a vegetable-washing machine brings a rapid return and constitutes a profitable activity, demonstrating the practical implication of the study.
As for research limitations, some caution is needed when analysing the investment return in vegetable-washing machines, because there are possible variations verified in the agricultural area, such as price of inputs and seeds, which are restricted to the prices dictated by the manufacturers; these in turn can impact in the final product price and consequently in the analysis of return and risk in the business. As suggestions for future research, it is recommended that this research structure be applied on other kinds of vegetables, as well as in the same sector, for the next years and in different regions as well.
The authors have not declared any conflict of interest.
REFERENCES
|
Abib M,Catapan EA,Catapan A,Catapan DC, Veiga CP (2015). Análise das demonstrações contábeis como etapa preliminar para elaboração do planejamento de curto, médio e longo prazo no Brasil: Um estudo de caso na Votorantim Cimentos. Espacios (Caracas) 36:1-4.
|
|
|
|
Associação Paulista de Supermercados (APAS) (2006). 3ª Conferência e Feira de Flores, Frutas, Legumes e Verduras (FLV) 2006 e a 2ª Feira de Centrais de Negócios (FCN) 2006. FLV e FCN debatem integração do setor. Disponível em:
View
|
|
|
|
|
Assaf Neto A (2010). Finanças corporativas e valor. 5. ed. São Paulo: Atlas.
|
|
|
|
|
Barney J (1991). Firm resources and sustained competitive advantage. J. Manage. 7(1):99-120.
Crossref
|
|
|
|
|
Beuren IM (2008). Como elaborar trabalhos monográficos em contabilidade – teoria e prática. 3. ed. São Paulo: Atlas.
|
|
|
|
|
Bublitz MG, Peracchio LA (2015). Applying industry practices to promote healthy foods: An exploration of positive marketing outcomes. J. Bus. Res. 68(12):2484-2493.
Crossref
|
|
|
|
|
Casarotto Filho N, Kopittke BH (2010). Análise de investimentos: matemática financeira, engenharia econômica, tomada de decisão, estratégia empresarial. 11. ed. São Paulo: Atlas.
|
|
|
|
|
CEASA-PR (2012). Boletim Técnico Ceasa/PR. Disponível em:
|
|
|
|
|
Charnes J (2007). Financial modeling with crystal ball and excel. Wiley Finance.
|
|
|
|
|
Confederação da Agricultura e Pecuária do Brasil (CNA) (2011). Consumo de frutas no Brasil está abaixo do recomendado pela Organização Mundial da Saúde. Disponível em
|
|
|
|
|
Crepaldi SA (2012). Contabilidade rural: Uma abordagem decisorial. 7. ed. São Paulo: Atlas.
|
|
|
|
|
Dwivedi DK, Gontia NK, Chavda JM (2015). Hydraulic performance evaluation of mini sprinkler system. Afr. J. Agric. Res. 10(53):4950-4966.
Crossref
|
|
|
|
|
Freitas Filho A, Paez MLDA, Goedert WJ (2002). Strategic planning in public R&D organizations for agribusiness: Brazil and the United States of America. Technol. Forecast. Soc. Change 69(8):833-847.
Crossref
|
|
|
|
|
Gil AC (2010). Como elaborar projetos de pesquisa. 5 ed. São Paulo: Atlas.
|
|
|
|
|
Hoffman GJ, Evans RE (2007). In Hoffman GJ et al. (eds). Design and operation of farm irrigation systems. American Society of Agricultural and Biological Engineers, St. Joseph, Michigan, USA. 2nd ed. Introduction. pp. 1-32.
Crossref
|
|
|
|
|
Hoji M (2011). Administração financeira na prática:guia para educação financeira corporativa e gestão financeira pessoal. 3. ed. São Paulo: Atlas.
|
|
|
|
|
Instituto Brasileiro de Geografia e Estatística (IBGE) (2008). Aquisição alimentar domiciliar per capita anual - Kg - Brasil - 2008. Disponível em:
|
|
|
|
|
Kureski R, Moreira VRCP, Rodrigues JA (2015). Agribusiness gross domestic product (GDP) in the Brazilian region of Parana and, the economic development of its agricultural cooperatives. Afr. J. Agric. Res. 10:4384-4394.
Crossref
|
|
|
|
|
Marion JC (2014). Contabilidade rural: Contabilidade agrícola, contabilidade da pecuária. 14. ed. São Paulo: Atlas.
|
|
|
|
|
Porter ME (2005).Competição: estratégias competitivas essenciais. 12. ed. Rio de Janeiro: Elsevier.
|
|
|
|
|
Richardson RJ (1999). Pesquisa social: Métodos e técnicas. 3. ed. São Paulo: Atlas.
|
|
|
|
|
Ross S, Westerfield WR, Jaffe FJ (2011). Administraçãofinanceira. 2. ed. São Paulo: Atlas.
|
|
|
|
|
Serviço de Apoio às Micro e Pequenas Empresas (SEBRAE) (2012). Tendências da comercialização de frutas, legumes e verduras (FLV). Oportunidades e Negócios: Boletim do serviço Brasileiro de apoio às micro e pequenas empresas.
|
|
|
|
|
Siebert S, Hoogeveen J, Frenken K (2006). Irrigation in Africa, Europe and Latin America. Update of the digital global map of irrigation areas to Version 4. Frankfurt Hydrology Paper 05. 135 p.
|
|
|
|
|
Souza A, Clemente A (2008). Decisões financeiras e análise de investimentos: fundamentos, técnicas e aplicações. 6. ed. São Paulo: Atlas.
|
|
|
|
|
Zhong B, Yang F, ChenYL (2015). Information empowers vegetable supply chain: a study of information needs and sharing strategies among farmers and vendors. Comput. Electron. Agric.117:81-90.
Crossref
|
|