ABSTRACT
Characterization of landraces is central to any conservation measures devised for sweet potato in Malawi. Studies were therefore conducted using seven morphological descriptors and farmers’ indigenous knowledge systems (IKS) to investigate the phenotypical diversity of 286 landraces and 35 introductions of sweet potato from the north, south east and lower Shire. The accessions were planted in a check plot design at Bvumbwe Agricultural Research Station. The results showed that farmers’ knowledge (IKS) is a means for preliminary characterization of accessions as evidenced by elimination of 75 duplicate accessions by 12 farmers. Analysis of variance (ANOVA) showed that all accessions and populations were phenotypically variable (p≤0.01) and Chi-square test of the morphological descriptors used in the study varied significantly among the three eco-geographical areas and among the landraces and introductions (p≤0.05 and p≤0.01), implying high variability of the accessions. However, the accessions clustered at 50% dissimilarity and generally irrespective of eco-geographical origin, signifying some similarity probably due to gene flow. Shannon Weaver Diversity Index (H’) indicated that different traits had different source areas of highest diversity which were significantly different (p≤0.05); nonetheless Shire Valley had the highest mean diversity for all traits (H’=0.67) which was significantly different from the other two populations (p≤0.05) inferring that the lower shire would be ideal for in situ conservation of sweet potato diversity.
Key words: Field evaluation, germplasm, phenotype, population, root crop, variability.
Plant genetic resources for food and agriculture (PGRFA) which comprise diversity of genetic material contained in landraces, modern cultivars, wild relatives and other wild species are the basis of global food security (Rao, 2004). Sweet potato (Ipomoea batatas (L.) Lam) is one of the most important staple and food security root crops in the world, ranked second after cassava in area and production in the tropical and sub-tropical regions (FAOSTAT, 2012; Boney et al., 2014). In the Sub-Saharan Africa, over 3 million hectares are under sweet potato cultivation (Low and Van Jaarswels, 2008).
In Malawi, sweet potato comes second after cassava as a food security root crop and is most widely grown in the country as evidenced by its production increase of 370% between 1995 and 2006 (Famine Early Warning System/Ministry of Agriculture and Food Security (FEWS/MoAFS), 1995, 2006). While the crop is traditionally important in Malawi, especially during years of drought which affect maize production negatively, little research in its landraces variability and associated productivity has been done. It is generally accepted that an understanding of genetic variability, which is manifested through phenotypic differentiation, is vital for any crop improvement through possible choice of appropriate selection and breeding programs (Demelie and Aragaw, 2016). Thus establishment of levels of phenotypic or morphological variations and detection of variants and possible duplicates is irreplaceable for genetic improvement and conservation of sweet potato (Lin et al., 2007). Morpho-agronomic characterization enables efficient utilization of germplasm collections in breeding programs by provision of links between genetic relationships and specific traits of agronomic importance, including tuber yield and yield components (Khoury et al., 2010; Elameen et al., 2011; Laurie et al., 2013; Mohammed et al., 2015). Owing to relative ease of study and inexpensiveness, morphological characters have been variously used to characterize and differentiate sweet potato accessions, assess comparative reaction and susceptibility to pests, diseases and other stresses etc. (Yada et al., 2010; Elameen et al., 2011; Vimala et al., 2012; Norman et al., 2014; Rahman et al., 2015; Amoatey et al., 2016; Mbithe et al., 2016; Su et al., 2016). Therefore, this study was conducted to characterize existing local and introduced sweet potato accessions in order to evaluate phenotypic diversity for effective utilization in breeding programs.
Germplasm collection
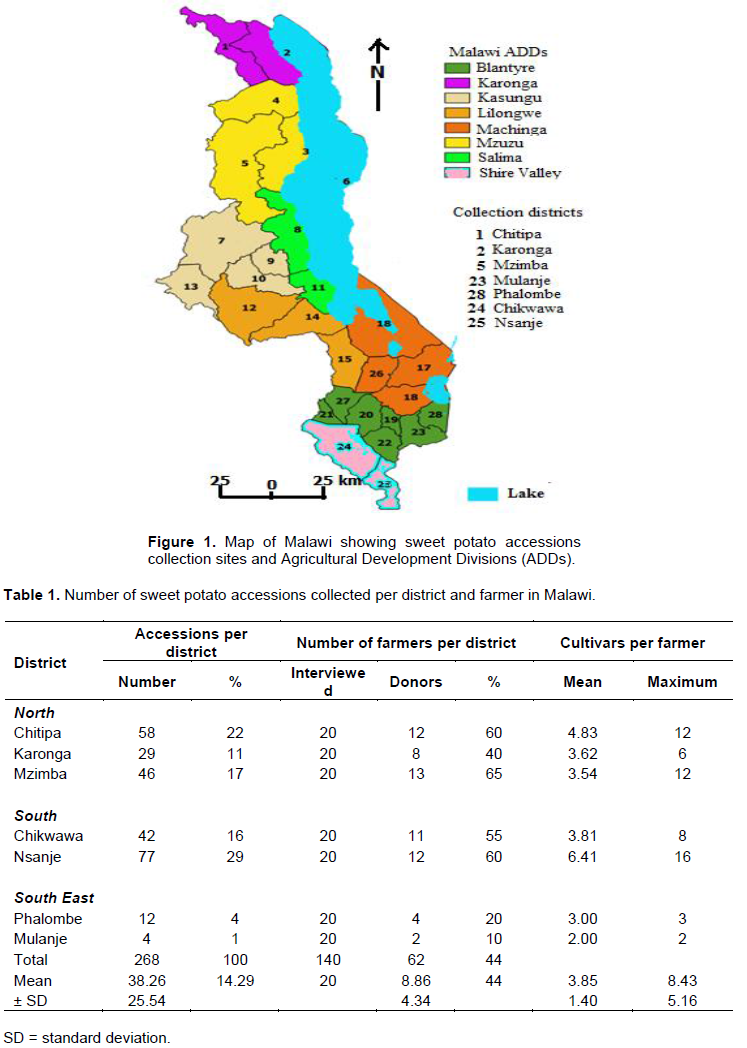
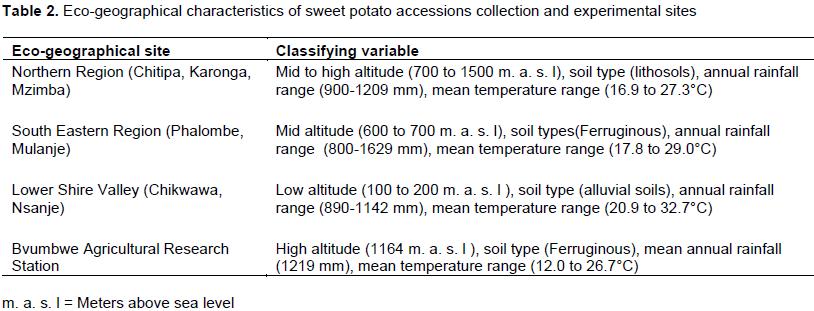
Collection of sweet potato germplasm accessions was conducted following guidelines from Karonga, Mzuzu, Blantyre and Shire Valley Agricultural Development Divisions (ADDS) offices (Figure 1) which indicate areas of high production and varietal diversity in Malawi. A total of 268 accessions were collected from farmers’ fields in 2004 in Karonga, Chitipa, Mzimba, Mulanje, Phalombe, Nsanje and Chikwawa districts (Figure 1 and Table 1) and brought to Bvumbwe Agricultural Research Station for planting and field evaluation before morphological characterization in the successive years. The collection districts and the experimental site were characterized by different altitudes, longitudes and latitudes, soils, rainfall amounts and temperatures (Table 2).
Differentiation of sweet potato accessions by farmers using indigenous knowledge system (IKS)
A complementary study by 12 experienced sweet potato farmers (key informants) who grew large numbers of cultivars per field and randomly sampled from survey areas of Chikwawa and Nsanje was done at Bvumbwe Agricultural Research Station field at harvesting time. The farmers, who were not donors of germplasm from Chikwawa and Nsanje Districts, were subjected to interviews aimed at verifying their knowledge regarding cultivar names and meanings, cultivar distinguishing attributes, uses and cropping systems. The complementary study was conducted to assess if the accessions collected were a true representation of the cultivars grown in the two districts by either identifying cultivars in the Bvumbwe field or providing a list of missing cultivars. Involvement of the key informants also facilitated identification of obvious duplicates and accessions tagged as ‘unknowns’. The farmers were first interviewed individually and indoors using a questionnaire to give names and characteristics of cultivars grown in their area. After indoor interviews, farmers were asked to identify accessions in the Bvumbwe field. The complementary study was also designed to reveal similarities or differences between the Northern and Southern Region collections with the aid of farmers.
Experimental design
Sweet potato vines (25 to 30 cm long) were planted along the ridges at 30 cm apart on 24th and 28th of January, 2004 and 2005, respectively following standard procedures which included plots laid in a check plot design consisting of 2 tractor ploughed ridges of 3 m long and 90 cm apart. For each accession, 10 cuttings were planted on a 3 m ridge in two replicates. The fields were weeded using hand hoes. Fertilizer and pesticides were not used in the field. The same design was implemented each year.
Morphological characterization
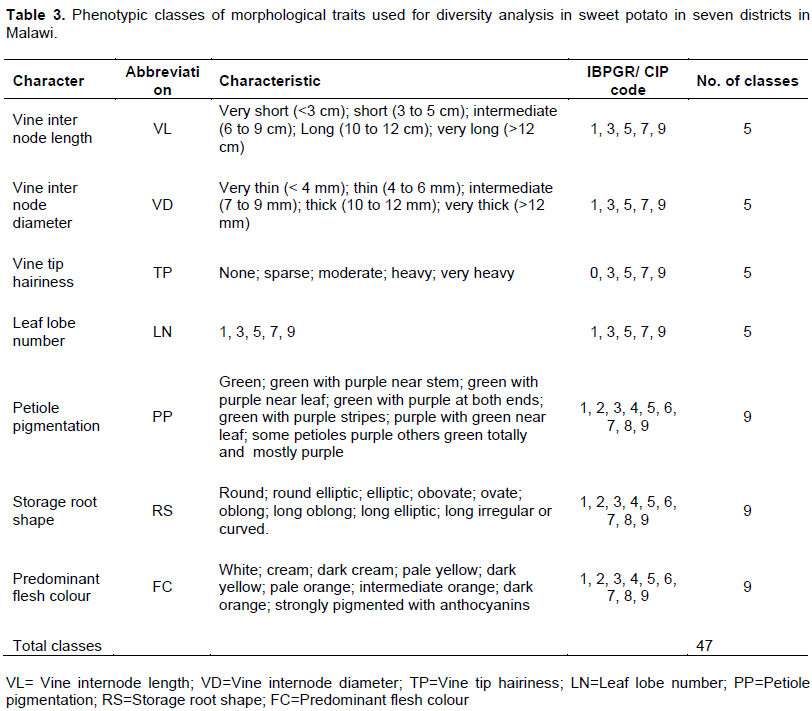
Following procedures outlined by Huaman et al. (1999), key morphological descriptors (Table 3) were used to conduct detailed comparisons aimed at isolation of potential duplicates among the accessions. Characterization of sweet potato above ground morphology started at 80 to 100 days after planting in accordance with recommendations outlined by Mok and Schmiediche (1998). Seven International Board for Plant Genetic Resources (IBPGR) descriptors for sweet potato (CIP et al., 1991; Huaman, 1991), with a total of 47 different character states (classes) were used to conduct discriminatory analysis of the accessions (Table 3). Morphological indicators on roots were done at harvest (5 months after planting). Morphological traits data were generated from four randomly sampled plants per accession. The descriptors were qualitatively and quantitatively scored (Huaman, 1991).
Data analysis
Morphological data analysis
The mean values of all sampled observations for the seven phenotypic traits (Table 3) over three eco-geographical sources and two accession status (landraces and introductions) were analyzed for their variance and significance using AgrobaseTM (Agronomix Software Inc., 1999). Accessions were grouped into three populations: North, South East and Lower Shire Valley based on agro-ecological zones (Figure 1). Accessions were also categorized as either landraces or introductions to compare their morphological differences. Statistical package for social scientists (SPSS) was used to obtain frequencies of the average data over two years. The χ2 analysis was carried out to test deviation from the overall mean of all the characters and sources of origin. The variation in frequency in the multi-category attributes was analyzed using the Shannon-Weaver Diversity Index (H') (Shannon and Weaver, 1948) to measure phenotypic diversity for each trait (Grenier et al., 2001; Adugna and Labuschagne, 2002). The index was calculated by the formula:

where n is the number of character states (classes) and pi is the proportion of entries in the ith category of an n-class (total number of accessions, N) attribute (Pielou, 1969; Jain et al., 1975). If a trait was mainly represented by one category in the database, a low index value was assigned, but if an attribute was evenly represented among all of the categories, a high index value was assigned. The additivity of H' allowed characters to be pooled over groups (Tolbert et al., 1979). The average diversity (Ĥ’) over n traits was estimated as: where n is the number of character states (classes) and pi is the proportion of entries in the ith category of an n-class (total number of accessions, N) attribute (Pielou, 1969; Jain et al., 1975). If a trait was mainly represented by one category in the database, a low index value was assigned, but if an attribute was evenly represented among all of the categories, a high index value was assigned. The additivity of H' allowed characters to be pooled over groups (Tolbert et al., 1979). The average diversity (Ĥ’) over n traits was estimated as:

The interpretation was that the greater the number of variants in each phenotypic class of a given character and the more equal their proportions, the greater was the diversity (Pielou, 1969). The minimum value of the index was zero for a uniform population. The value of the index increases with increase within population variability and reaches maximum value when all phenotypic classes have equal frequencies (Yang et al., 1991). To test for the differences among pairs of Ĥ’ values at P< 0.05, a t- statistic according to Jain et al. (1975) was used as given by the formula:
Cluster analysis of morphological markers
The data on morphological traits of 59 accessions were transformed into binary data matrixes. The presence of a character state in a particular class for morphological traits was recorded as 1 and 0 for present and absent, respectively. Based on the presence/absence, dissimilarity coefficients were generated using the SIMINT module (NTSYS pc 2.11c software) (Rohlf, 2001). The default parameter DIST (average genetic distance) was used to generate the binary data matrix. Dendrograms were generated from the Sequential Agglomerative Hierarchical and Nested (SAHN) clustering method using the unweighted pair group method and arithmetic average (UPGMA) (Sneath and Sokal, 1973; Rohlf, 2001) using NTSYS pc 2.11.
Accession identification and duplicate assessment by farmers
In the complementary identification studies at Bvumbwe Research Station, a long term sweet potato farmers from Nsanje and Chikwawa, major sweet potato growing areas, competently identified cultivars grown in their districts including three from Phalombe which were obvious duplicates of accessions from their areas. Below ground and above ground phenotypic features were used for identification. In total, with the aid of the farmers, 75 phenotypic and obvious duplicates were identified, tagged and eliminated. This outcome is consistent with the fact that from time in memorial farmers have used morphological traits to distinguish different cultivars of crops including sweet potato (Zimmerer and Douches 1991; Rodriguez-Bonilla et al., 2014). However, using the same features, farmers could not identify cultivars from Mzimba, Chitipa and Karonga except two, tsambalimodzi from Mzimba, which was also collected as ‘unknown 13’ from Karonga, called supuni/namasupuni in Nsanje, Chikwawa and Phalombe; and Kadidimi which was identified as Thinda of Chikwawa and Nsanje which also share names with other cultivars Babache and Mfumu. The failure of the twelve farmers to identify cultivars from the northern districts and relate them with their cultivars is a convincing indication that the accessions from the northern districts were phenotypically different from the collections of the southern districts probably due to genetic, climatic or soil differences other than ethnic preferences (Rodriguez-Bonilla et al., 2014). Nevertheless, the results suggest that farmers’ indigenous knowledge system (IKS) can be used for preliminary discrimination analysis of accessions to eliminate obvious duplicates and classify accessions before validation by morphological descriptors analysis (Changadeya et al., 2012).
Sweet potato morphological diversity analysis
Upon removal of 75 obvious duplicates out of the original 268 accessions, 193 landraces and 35 introductions were subjected to morphological variation assessment.
Morphological variability in sources of origin
An analysis of variance (ANOVA) on the seven traits was used to differentiate the populations under study. The mean squares for analysis of variance over the two years (2004 and 2005), three eco-geographical populations (north, South east and Lower Shire) and two populations (Landraces and Introductions) are presented in Table 4.

Variability among the accessions (entry) and populations was highly significant (p<0.01) for the seven traits, indicative of the existence of a wide range of morphological diversity within and among sources of origin for these traits. Accession variability contributed a larger proportion of the variance (Table 4) than the year and populations. Since seasonal variability (years) was absent in the seven traits, means of the two years were used for analysis. The findings in this study are concomitant with what Mbithe et al. (2016) found among 11 Ugandan sweet potatoes, where ANOVA analysis of 22 descriptors showed high variability of most morphological characters. High phenotypic variation among sweet potato genotypes has been variously demonstrated (Karuri et al., 2010; Maquia et al., 2013; Demelie and Aragaw, 2016). It generally originates from natural random mutations that are accelerated by asexual propagation through vines (Purugganan and Fuller, 2009; Roullier et al., 2011, 2013b).Traditional communal vine sharing among farmers further increases the rate of mutations among individual cultivars.
Distribution of traits over sources of origin
A χ2 test (Table 5) was used to compare the distributions of character states in the different sources of origin. Phenotypic percent frequencies of the character states in their respective classes are presented in Table 6. The chi-square test for homogeneity of frequencies of character classes of a trait showed that traits varied significantly (P < 0.05 and 0.01) among the three eco-geographical and two status populations. The total proportion of trait exceeded the anticipated, demonstrating highly significant inter-population differences in character frequencies. The performance of accessions under field conditions at Bvumbwe showed wide ranges of variability exhibited by frequencies in the various character states and sources of origins signifying prevalence of diversity among the accessions. Internode diameter is a very important characteristic in cultivar release as it affects vine sprouting after planting in the field. Very thin vines easily dry up when planted due to excessive heat and moisture stress. Cultivar survival under farmers’ selection and natural forces (drought, chilly temperatures, sun heat) may therefore be very low if vines are very thin. Very few accessions were observed in the very thin category in all the sources of origin. Selection against the very thin vine accessions may have contributed to low frequency due to failure of vines to survive under harsh field conditions. Accessions in the intermediate thickness prevailed among the populations with South East population having the highest accessions (54%) of the intermediate thickness. While the frequencies for very thick vines were low across sources of origins, the introduced population had the highest frequency (14%) and the landrace had 7% (Table 6). The introductions had 2% very thin, 17% thin, 46% intermediate, 21% thick and 14% very thick. The introductions are therefore a good source of the very thick vines which is an important attribute in harsh field conditions.

Vine internode length (>12 cm) also affects sprouting as only a few nodes (at most 2 to 3) are available for sprouting on a 25 to 30 cm long planting vine. It is recommended that at planting, three to four nodes should be inserted underground (Government of Malawi (GoM), 1996). Vine sprouting is high when more nodes are buried in the soil at planting as opposed to one or two nodes which may easily dry up in soils with limited moisture content. The majority of accessions across the geographical sources (Table 6) had short and intermediate internode length. The SE population had the highest accessions in the intermediate category (63%) followed by Shire Valley population (50%).
The Northern population had a high number of accessions in thick category (54%). The very short and very long internode lengths were very few although present in all populations with the Shire Valley exhibiting the highest number of the very short internodes (11%). The landraces had very few accessions that were very short (6%), long (8%) and very long (1%) internode lengths which entailed that there has been selection against these traits. The introduction registered none for long to very long but were a good source for very short (11%), short (60%) and the intermediate (29%) lengths. A released variety Tainung had a combination of very thin vines and long internode lengths. The cultivar has problems with sprouting, hence one of the reasons of failure to establish in the farming communities.
Most of the accessions in the study were in the categories of no hair, sparsely present and moderately present. While the South East and Northern populations did not register accessions in the heavy to very heavy hairiness categories, the Shire Valley population had heavy (2%) to very heavy hairiness (3%) accessions (Table 6). The high percentage of heavy hairy accessions in the low altitude areas which are also characterized by high temperatures is attributed to selection against the heavy insect attacks. Reference accessions were Nyamajoya ya Malawi (the hairy one from Malawi) and Nyamajoya ya Mozambique (the hairy one from Mozambique) which were said to be less preferred by elegant grasshoppers which are leaf eaters and problem insects in the area.
The results also showed that the green colour of petiole pigmentation for the South East population was the highest (71%). Not all character states of petiole pigmentation were represented in the nine classes in all sources of origin where the green coloured petioles constituted 44% of the landraces (Table 6). Accessions in the ‘purple with green near leaf’ are totally missing among the landraces. The introductions constituted 40% of the green petioles but had no representation in green with purple near stem, green with purple at both ends and green with purple stripes which were supplemented by the landraces in the germplasm (Table 6). While the majority of the accessions had the white, cream and yellow root flesh colour, the distribution of the accessions among the character states of the root flesh colour was absent in other states in different geographical areas. The landraces had a total of 44% of the cream accessions and 32% of the white ones while the introductions had only 10% of the cream and 49% of the white. The introductions are a source of the dark orange (17%) which were only 3% in the landrace.
Among the local geographical areas, the majority of the accessions had elliptic and long irregular root shapes with landrace averaging 29 and 35%, respectively. Such root shapes are generally a problem when processing (peeling) and marketing. The Shire Valley population had however a higher frequency of the round roots (11%). When compared with the landraces, the introductions had mostly the round (26%) and round elliptic (29%) roots which have good marketing values. Number of lobes is a trait which is represented in all character states ranging from 18 to 22% among the character traits in the landraces. Most of the introductions however had five lobes (66%) and none had seven lobes.
Shannon weaver diversity index on morphological traits
Shannon and Weaver Index (H’) as a measure of diversity has been used extensively to estimate the phenotypic diversity in crop germplasm collections (Yoon et al., 2000; Kebebew et al., 2002; Upadhyaya et al., 2002). Table 7 shows results of Shannon Weaver Index (H’) calculated to compare phenotypic diversity of characters between populations. Table 7 shows that the different traits had different source areas of highest diversity which were significantly different at p≤0.05. For instance, vine internode length (VL) highest diversity was in the Northern population (0.85) while the number of lobes (LN=0.84) and root flesh colour (FC=0.82) had highest diversity in the Shire Valley population. These results therefore suggest that some sources have the potential to offer highest diversity for a particular trait(s) than others. The introduced accessions however are the highest sources of tip hairiness (0.84).

Based on the average diversity calculated for the different sources of origins and using the t-test, the Shire Valley had the highest diversity (H’=0.67) which was significantly different from the other two populations at p≤0.05. The mean Shannon-Weaver Diversity observed in the lower Shire sweet potato was higher than what Bellatreche et al. (2017) reported on 23 accessions of wheat using nine agro-morphological traits (H’=0.59) in which the authors concluded that the wheat accessions showed high phenotypic diversity. The differences in diversity within a character class in the present study could be attributed to diversity in weather conditions, soil type and a wide range of altitude. In addition, natural selection (such as drought) as well as artificial selection by farmers may have selected for the prevailing characters that are different from site to site resulting in the present morphological diversity (Roullier et al., 2011, 2013b). Similarly, the introductions, some deliberate (introduction for orange fleshed sweet potato) have contributed to the diversification of phenotypic traits in Malawi.
Morphological cluster analysis
A total of 59 accessions out of 193 landraces and 35 introductions, that showed wide morphological distances within and among the three geographical populations were sampled for morphological cluster analysis and further microsatellite markers analysis (data not shown). UPGMA-based cluster analysis on binary data of seven morphological traits and 59 (50 landraces and nine introductions) sweet potato accessions, are shown in Figure 2. The morphological clustering grouped the accessions into three main clusters A, B and C consisting of a singleton accession in clusters B, 27 in cluster A and 31 accessions in cluster C. The clusters A and C comprised accessions from all sources under study namely North, South East, Shire Valley and introductions while the singleton cluster contains accession Tchubatchuba from the Northern population. The clusters A and C were further sub- grouped to establish any possibilities of the accessions to cluster according to sources of origin.
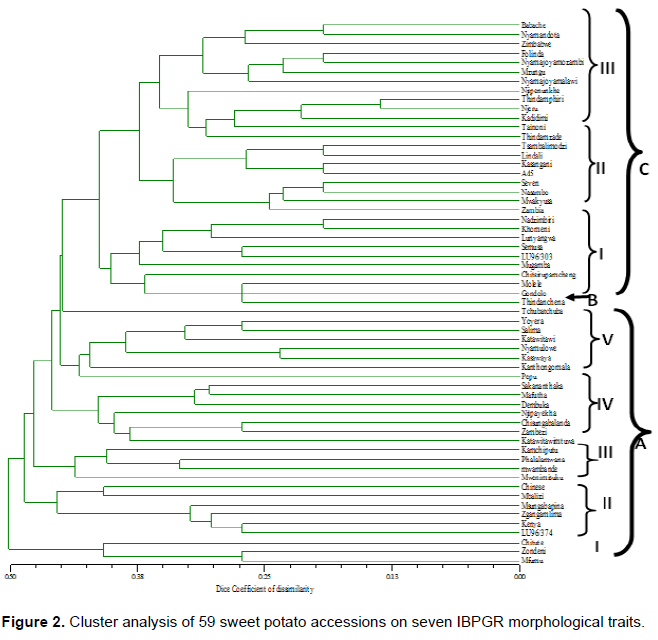
The composition of sub clusters I, II, III and IV of main cluster A contained accessions from all sources of origins while sub cluster V contained accessions from the Northern population and included Yoyera which was also sampled in the Shire Valley. While sub cluster I of main cluster C contained accessions from all sources of origins, sub cluster II contained accessions from the North including Tsambalimodzi which was also sampled from the Shire Valley and an introduction A45, which originates from the Republic of South Africa. All the accessions in sub cluster III of C originated from the Shire Valley.
Dice coefficient of dissimilarity ranged from 0.00 to 0.50 showing high dissimilarity among the accessions which complements the ANOVA findings. However, some accessions in sub-clusters showed some eco-geographical associations based clustering, suggesting a genetic distinction. This observation is divergent from what Gichuru et al. (2006) found, where morphological clustering was irrespective of geographical origin among Tanzanian, Kenyan and Ugandan accessions. However, the trend among sweet potato to cluster according to geographical source has been reported using molecular methods such as random amplified polymorphic DNA (RAPD) (Gichuki et al., 2003), amplified fragment length polymorphism (AFLP) (Zhang et al., 1998) and selective amplification of microsatellite polymorphic loci (SAMPL) (Tseng et al., 2002). In general, in this study most accessions clustered irrespective of eco-geographical origin signifying some similarity among them which could stem from gene flow abetted by historical tradition of sharing vines among farmers (Roullier et al., 2013a), as well as massive distribution of sweet potato vines by NGOs particularly during years of drought.
The current study on morphological characterization has revealed that high phenotypic diversity exists among and within populations of sweet potato with Shire Valley exhibiting the highest diversity (H’=0.67). The study also showed that the level and type of character variability is not uniformly distributed in all geographic regions hence some regions are a high source of some morphological traits and not others. The knowledge held by farmers (IKS) can be used as a first means for characterization to eliminate obvious duplicates and classify accessions before use of any marker.
The authors have not declared any conflict of interests.
REFERENCES
|
Adugna W, Labuschagne MT (2002). Genotype-environment and phenotypic stability analysis of linseed in Ethiopia. Plant Breed. 121:66-71.
Crossref
|
|
|
|
Agrobase TM (1999). Agronomic Software. 71 Waterloo St Winnipeg, R3N0S4, Canada.
|
|
|
|
|
Amoatey HM, Sossah FL, Ahiakpa JK, Quartey EK, Appiah AS, Segbefia MM (2016). Phenotypic profiles of different accessions of sweet potato (Ipomoea batatas (L.) Lam) in the coastal savanna agro-ecological zone of Ghana. Afr. J. Agric. Res. 11(26):2316-2328.
Crossref
|
|
|
|
|
Bellatreche A, Mahdad MY, Kaouadji Z, Gaouar SBS (2017). Agro-morphological diversity of some accessions of bread wheat (Triticuma aestivum) in west Algeria. Biodiversitas 18(1):409-415.
Crossref
|
|
|
|
|
Boney W, Yalu A, Ramakrishna A, Deros M (2014). Genotypic variability estimates of agronomic traits for selection in a sweet potato [Ipomoea batatas (L.) Lam.] poly crosses population in Papua New Guinea. J. Plant Breed. Genet. 2(3):131-136.
|
|
|
|
|
Changadeya W, Ambali AJD, Laisnez L (2012). Comparative study of molecular and morphological methods for investigating genetic relationships among Bvumbwe Agriculture Research Station field gene bank banana cultivars. Int. J. Phys. Soc. Sci. 2(9):132-152.
|
|
|
|
|
Demelie M, Aragaw A (2016). Genetic variability of sweet potato on yield and yield related traits at Werer Agricultural Research Centre, Ethiopia. Electr. J. Plant Breed. 7(2):362-370.
Crossref
|
|
|
|
|
Elameen A, Larsen A, Klemsdal SS, Fjellheim S, Sundheim L, Msolla S, Masumba E, Rognli OA (2011). Phenotypic diversity of plant morphological and root descriptor traits within a sweet potato, Ipomoea batatas L. Lam., germplasm collection from Tanzania. Gen. Resour. Crop Evol. 58:397-407.
Crossref
|
|
|
|
|
FAOSTAT (2012). Global production and consumption of root and tuber. In: FAO corporate document repository. Report on the Inter-center review of root and tuber crops research in the CGIAR.
|
|
|
|
|
Famine Early Warning System/Ministry of Agriculture and Food Security (FEWS/MoAFS) (1995 to 2006). FAO/WFP crop and food supply assessment mission to Malawi.
|
|
|
|
|
Gichuki ST, Berenyi M, Zhang D, Hermann M, Schmidt J, Glössl J, Burg K (2003). Genetic diversity in sweetpotato [Ipomoea batatas (L.) Lam.] in relationship to geographic sources as assessed with RAPD markers. Genet. Resour. Crop Evol. 50(4):429-437.
Crossref
|
|
|
|
|
Gichuru V, Aritua V, Lubega GW, Edema R, Adipala E, Rubaihayo PR (2006). A preliminary analysis of diversity among East African sweet potato landraces using morphological and simple sequence repeats (SSR) markers. International Society for Horticultural Science. ISHS. Acta Hortic. 703:23-32.
|
|
|
|
|
Government of Malawi (GoM). (1996). Guide to agricultural production in Malawi. Agricultural Communications Branch, Ministry of Agriculture and Irrigation, Lilongwe, Malawi pp. 6-43.
|
|
|
|
|
Grenier C, Hamon P, Bramel-Cox PJ (2001). Core collection of sorghum II: comparison of three random sampling strategies. Crop Sci. 41:241-246.
Crossref
|
|
|
|
|
Huaman Z (1991). Descriptor for sweet potato. CIP, AVRDC, IBPGR. International Board for Plant Genetic Resources, Rome, Italy.
|
|
|
|
|
Huaman Z, Aguilar C, Ortiz R (1999). Selecting a Peruvian sweet potato core collection on the basis of morphological, eco-geographical, and disease and pest reaction data. Theor. Appl. Genet. 98:840-844.
Crossref
|
|
|
|
|
International Potato Center (CIP), Asian Vegetable Research and Development Center(AVRDC), International Board for Plant Genetic Resources (IBPGR) (1991). Descriptors for sweet potato. (ed.). Huaman, Z. International Board for Plant Genetic Resources (IBPGR). Italy, Rome.
|
|
|
|
|
Jain SK, Qualset CO, Bhatt GM, Wu KK (1975). Geographical patterns of phenotypic diversity in a world collection of durum wheat. Crop Sci. 15:700-704.
Crossref
|
|
|
|
|
Karuri HW, Ateka EM, Amata R, Nyende AB, Muigai AWT, Mwasame E, Gichuki ST (2010). Evaluating diversity among Kenyan sweet potato genotypes using morphological and SSR markers. Int. J. Agric. Biol. 12:33-38.
|
|
|
|
|
Kebebew A, Merker A, Tefera H (2002). Quantitative trait variation in Tef (Eragrostis tef (Zucc.) Trotter) germplasm from western Ethiopia. Euphytica 127:399-410.
Crossref
|
|
|
|
|
Khoury C, Laliberté B, Guarino L (2010). Trends in ex situ conservation of plant genetic resources: a review of global crop and regional conservation strategies. Genet. Resour. Crop Evol. 57:625-639.
Crossref
|
|
|
|
|
Laurie SM, Calitz FJ, Adebola PO, Lezar A (2013). Characterization and evaluation of Ugandan sweet potato germplasm. Crop Sci. 50:2364-2371.
|
|
|
|
|
Lin KH, Lai YC, Chang KY, Cheng YF, Hwang SY, Lo HF (2007). Improving breeding efficiency for quality and yield of sweet potato. Biochem. Bot. Stud. 48:283-292.
|
|
|
|
|
Low JW, Van Jaarswels PJ (2008). The potential contribution of bread buns fortified with β-carotene-rich sweet potato in Central Mozambique. Food Nutr. Bull. 29:98-107.
Crossref
|
|
|
|
|
Maquia I, Muocha I, Naico A, Martin N, Gouveia M, Andrade L, Goulao LF, Ribeiro AI (2013). Molecular, morphological and agronomic characterization of sweet potato (Ipomoea batatas L.) germplasm collection from Mozambique: Genotype selection for drought prone regions. S. Afr. J. Bot. 88:142-151.
Crossref
|
|
|
|
|
Mbithe MJ, Steven R, Agili S, Kivuva MB, Kioko WF, Kuria E (2016). Morphological characterization of selected Ugandan sweet potato (Ipomoea batatas (L.) Lam) varieties for food and feed. J. Phylogenet. Evol. Biol. 4:163.
Crossref
|
|
|
|
|
Mohammed W, Ali S, Shimelis B, Burga S (2015). Genetic Diversity of Local and Introduced Sweet Potato [Ipomoea batatas (L.) Lam.] Collections for Agro Physicochemical Attributes in Ethiopia. Sci.
|
|
|
|
|
Mok IG, Schmiediche P (1998). Collecting, characterizing, and maintaining sweet potato germplasm in Indonesia. CIP, Indonesia, pp. 3-34.
|
|
|
|
|
Norman PE, Beah AA, Samba JA, Tucker MJ, Benya MT, Fomba SN (2014). Agro-phenotypic characterization of sweet potato (Ipomoea batatas (L.) Lam) genotype using factor and cluster analyses. Agric. Sci. Res. J. 4(2):30-38.
|
|
|
|
|
Pielou EC (1969). An introduction to mathematical ecology. J Wiley and Sons, New York, USA.
|
|
|
|
|
Purugganan MD, Fuller DQ (2009). The nature of selection during plant domestication. Nature 457:843-848.
Crossref
|
|
|
|
|
Rahman H, Saiful Islam AFM, Maleque A, Tabassum R (2015). Morpho-physiological evaluation of sweet potato (Ipomoea batatas (L.) Lam) genotypes in acidic soil. Asian J. Crop Sci. 7: 267-276.
Crossref
|
|
|
|
|
Rao NK (2004). Plant genetic resources: advancing conservation and use through biotechnology. Afr. J. Biotechnol. 3:136-145.
|
|
|
|
|
Rohlf JR (2001). NTSYSpc Version 2.11c Numerical Taxonomy and Multivariate Analysis System, Exeter Software, New York.
|
|
|
|
|
Rodriguez-Bonilla L, Cuevas HE, Montero-Rojas M, Brid-Pico F, Luciano-Rosario D, Sirirtunga D (2014). Assessment of genetic diversity of sweet potato in Puerto Rico. PLoS ONE 9(12):e116184.
Crossref
|
|
|
|
|
Roullier C, Benoit L, McKey D, Lebot V (2013a). Historical collections reveal patterns of diffusion of sweet potato in Oceania obscured by modern plant movements and recombination. PNAS, Proc. Natl. Acad. Sci. (USA) 110(6):2205-2210.
Crossref
|
|
|
|
|
Roullier C, Duputié A, Wennekes P, Benoit L, Manuel V, Rossel G, Tay D, McKey D, Lebot V (2013b). Disentangling Ipomoea batatas polyploidization history: consequences for the domesticated genepool. PLoS One 27(8):e62707.
Crossref
|
|
|
|
|
Roullier C, Rossel G, Tay D, Mckey D, Lebot V (2011). Combining chloroplast and nuclear microsatellites to investigate origin and dispersion of New World sweet potato landraces. Mol. Ecol. 20(19):3963-3977.
Crossref
|
|
|
|
|
Shannon CE, Weaver W (1998). The mathematical theory of communication. University of Illinois press, Urbana.
|
|
|
|
|
Sneath PHA, Sokal RR (1973). Numerical taxonomy. Freeman, San Francisco pp. 281-298.
|
|
|
|
|
Su W, Liu Y, Lei J, Wang L, Chai S, Jiao C, Yang X (2016). Phenotypic variation analysis of sweet potato germplasm resources from different agro-climate zones in the world. Am. J. Exp. Agric. 13(6):1-13.
Crossref
|
|
|
|
|
Tseng YT, Lo HF, Hwang SY (2002). Genotyping and assessment of genetic relationships in elite polycross breeding cultivars of sweet potato in Taiwan based on SAMPL polymorphisms. Bot. Bul. Acad. Sinica 43:99-105.
|
|
|
|
|
Tolbert DM, Qualse CO, Jain SK, Craddock JC (1979). A Diversity Analysis of a World Collection of Barley. Crop Sci. 19:789-794.
Crossref
|
|
|
|
|
Upadhyaya HD, Ortiz R, Bramel PJ, Singh S (2002). Development of a groundnut core collection using taxonomical, geographical and morphological descriptors. Genet. Resour. Crop Evol. 50:139-148.
Crossref
|
|
|
|
|
Vimala B, Sreekanth A, Hariprakash B, Wolfgang G (2012). Variation in morphological characters and storage root yield among exotic ornage-fleshed sweet potato clones and seedling population. J. Root Crops 38(1):32-37.
|
|
|
|
|
Yada B, Tukamuhabwa P, Alajo A, Mwanga ROM (2010). Morphological characterization of South African sweet potato (Ipomoea batatas (L.) LAM) land races. S. Afr. J. Bot. 85:10-16.
|
|
|
|
|
Yang RC, Jana S, Clark JM (1991). Phenotypic diversity and associations of some potentially drought-responsive characters in durum wheat. Crop Sci. 31:1484-1491.
Crossref
|
|
|
|
|
Yoon MS, Ahn JW, Park SJ, Baek HJ, Park NK, Rho YD (2000). Geographical patterns of morphological variation in soybean germplasm. Kor. J. Crop Sci. 45:267-271.
|
|
|
|
|
Zhang D, Cervantes J, Huamán Z, Carey E, Ghislain M (1998). Assessing genetic diversity of sweet potato (Ipomoea batatas (L.) Lam.) cultivars from tropical America using AFLP. Genet. Resour. Crop Evol. 47:659-665.
Crossref
|
|
|
|
|
Zimmerer KS, Douches DS (1991). Geographical approaches to native crop research and conservation: the partitioning of allelic diversity in Andean potatoes. Ecol. Bot. 45(2):176-89.
Crossref
|
|