African Journal of
Agricultural Research

  • Abbreviation: Afr. J. Agric. Res.
  • Language: English
  • ISSN: 1991-637X
  • DOI: 10.5897/AJAR
  • Start Year: 2006
  • Published Articles: 6863

Full Length Research Paper

Agro-morphological diversity in yam genotypes from Recôncavo of Bahia, Brazil

Ricardo Franco Cunha Moreira
  • Ricardo Franco Cunha Moreira
  • Federal University Recôncavo da Bahia (UFRB), Rua Rui Barbosa 710, CEP: 44380-000, Cruz das Almas, BA, Brazil.
  • Google Scholar
Sandra Domingos Joao Afonso
  • Sandra Domingos Joao Afonso
  • Federal University Recôncavo da Bahia (UFRB), Rua Rui Barbosa 710, CEP: 44380-000, Cruz das Almas, BA, Brazil.
  • Google Scholar
Carlos Alberto da Silva Ledo
  • Carlos Alberto da Silva Ledo
  • Brazilian Agricultural Research Corporation (EMBRAPA Mandioca e Fruticultura), Embrapa, Rua Embrapa S/N CP 007, CEP: 44380-000, Cruz das Almas, BA, Brazil.
  • Google Scholar
Simone Alves Silva
  • Simone Alves Silva
  • Federal University Recôncavo da Bahia (UFRB), Rua Rui Barbosa 710, CEP: 44380-000, Cruz das Almas, BA, Brazil.
  • Google Scholar
Antonio Leandro da Silva Conceiçao
  • Antonio Leandro da Silva Conceiçao
  • Federal University Recôncavo da Bahia (UFRB), Rua Rui Barbosa 710, CEP: 44380-000, Cruz das Almas, BA, Brazil.
  • Google Scholar
Elaine Costa Cerqueira-Pereira
  • Elaine Costa Cerqueira-Pereira
  • Federal University Recôncavo da Bahia (UFRB), Rua Rui Barbosa 710, CEP: 44380-000, Cruz das Almas, BA, Brazil.
  • Google Scholar
Cassia da Silva Linge
  • Cassia da Silva Linge
  • University of Milan, DiSAA, Via Celoria, 2 20133 Milan, Italy.
  • Google Scholar


  •  Received: 14 March 2017
  •  Accepted: 09 May 2017
  •  Published: 15 June 2017

 ABSTRACT

The aim of this study was to evaluate the diversity of yam genotypes concerning their agro-morphological traits based on the Ward-modified location model (Ward-MLM) procedure. 209 genotypes from the commercial production area of the Recôncavo region in the state of Bahia, Brazil were used. Three agronomic traits (length, width and weight of the rhizophore) and two morphological traits (rhizophore shape and skin color) were evaluated. A considerable agro-morphological diversity was detected in the data for the 209 yam genotypes. The Ward-MLM procedure showed that the optimal number of groups according to the criteria of pseudo F and pseudo t2 is four. The separation by genotype groups was associated with their origin from two regions with different soil and climatic conditions. The Ward-MLM procedure has shown its usefulness to detect diversity and cluster genotypes by simultaneous use of morphological and agronomic traits.
 
Key words:  Cluster analysis, discriminant analysis, Dioscorea species, Ward-modified location model (MLM).


 INTRODUCTION

Yam belongs to the Dioscoreaceae family and to the genus Dioscorea with more than 600 species, ten of which have rhizophores that are used as food (Lebot, 2009; Nascimento et al., 2015). The species Dioscorea rotundata and Dioscorea cayennensis (also known as Dioscorea cayennensis-rotundata complex) are the  most cultivated in the world and account for 95% of yam world production (Obidiegwu et al., 2009; Silva et al., 2014).
 
This crop is currently the fourth most important tuber-root crop in the world, after potato (Solanum tuberosum L.), cassava (Manihot esculenta Crantz), and sweet potato (Ipomoea batatas L.) (Siqueira, 2011; Silva  et  al.,  2016 ). FAO estimates show that yam was collected from approximately 7.6 million hectares in 2014 generating 68 million tons of tubers (FAOSTAT, 2014). Globally, Nigeria ranks first with a production of 45 million tons in 2014 (FAOSTAT, 2014).
 
In Brazil, approximately 247,000 tons were produced on 25,700 hectares in 2014 (FAOSTAT, 2014). Approximately 90% of domestic production of Dioscorea species stems from the Northeast region, especially the states of Bahia, Paraíba, Pernambuco, Alagoas and Maranhão, where the yam crop represents an important agribusiness (Santos et al., 1998; Santos and Macedo, 2002; Santos et al., 2007a; Silva et al., 2014).
 
The importance of this species is related with the production of rhizophores with high nutritional and energetic value, constituting a staple food for human consumption which is already being used in all classes of Brazilian society (Mesquita, 2001 ; Santos et al., 1998; Santos, 1996 ). A large part of the production is destined for the domestic market and another part for export, mainly to Europe (Santos and Macedo, 2002; Santos et al., 2007b).
 
Regarding species of Dioscorea spp., it is estimated that 150 to 200 occur in Brazil, the only edible genre of the Dioscoreaceae family present in all regions of the country. In the producing regions, species such as D. cayennensis and D. rotundata are mostly used, followed by the species D. alata. However, most species are still poorly studied (Pedralli, 2002). In Bahia, the species D. rotundata and D. cayennensis (Boca funda) occupy more than 90% of the cultivated area, followed by D. alata (São Tomé and Jibóia) and Dioscorea trifida (yam or cará mimoso) as well as Dioscorea bulbifera (liver yam), sporadically (Carvalho et al., 2009). The largest acreage of yam in this state lies in the Recôncavo region, notably in the municipalities of Maragogipe, São Felipe, Cruz das Almas and São Félix, showing a significant socio-economic importance as a promising alternative for small and medium producers in the region (Mesquita, 2001).
 
Notwithstanding the socio-economic importance of the yam crop, its expansion is still extremely limited, mainly due to the scarcity of technical and scientific information that will provide sustainability and increase the productivity (Da Silva Dantas et al., 2013 ; Siqueira et al., 2011 ).  Despite being a species with great plasticity which can adapt from tropical humid to tempered climates without frost and drought (Pereira et al., 2003), the diversity of yam genotypes needs to be studied in order to provide information for enabling the development of technologies and basic knowledge to support and further explore this culture, assist in breeding programs and conserve the species in the Recôncavo region of Bahia, Brazil (Carvalho et al., 2009).
 
The diversity of this species can be estimated using genetics (Arnau et al., 2017; Loko et al., 2016 ) and phenotypical information (Dansi et al., 2013;  Sheikh  and Kumar, 2017 ). Using phenotypical traits, the diversity can be accessed by morphological characterization and subsequent cluster analysis (Asare et al., 2016). Cluster analysis of these variables can be carried out individually, as the distances are calculated depending on the type of variable used. Cruz (2013) provided procedures to estimate dissimilarity measures based on quantitative traits that could be analysed using Euclidean or Mahalanobis (1936) distances, binary data adopting for example the Jaccard (1908), Nei and Li (1979) coefficients  and multicategoric variables to which the Cole-Rodgers et al. (1997) coefficient is applied.
 
The joint analysis of different types of variables can provide a better indication of the potential on the existing variability in germplasm banks and genotype groups. However, few studies have used this methodology to quantify the diversity of the yam crop due to the lack of knowledge of statistical techniques for this approach and the lack of freely available computer programs for such an analysis. Under these circumstances, the Modified Location Model (MLM) procedure (Franco et al., 1998) is fundamental to quantify the variability using quantitative and qualitative data simultaneously. This procedure is characterized by the Ward grouping method (Ward Junior, 1963) defining groups based on the Gower similarity matrix (Gower, 1971) and by the vector average of the quantitative variables estimated by MLM, regardless of the value of the qualitative variables. It has been used in different cultures for various purposes (Barbé et al., 2010; Cabral et al., 2010; Gonçalves et al., 2009; Pestana et al., 2011 ; Sudré et al., 2010  ).
 
 
This study aims to quantify the genetic diversity (using the morpho-agronomic traits) of yam genotypes from the Recôncavo region of Bahia, using both quantitative and qualitative data based on the Ward-MLM procedure.


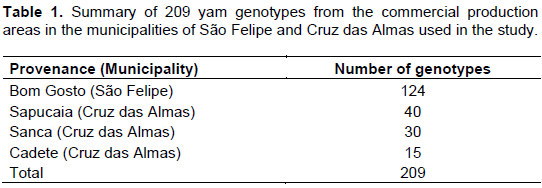
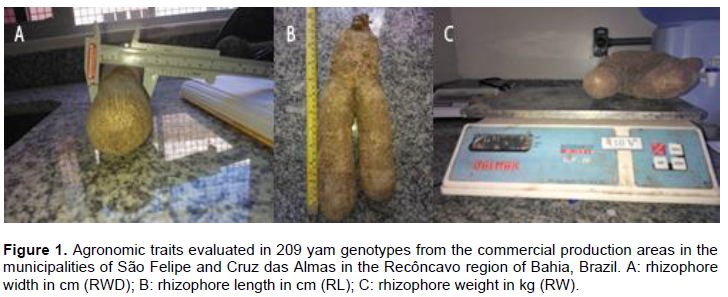
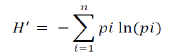
 MATERIALS AND METHODS

Yam (209, D. cayennensis) genotypes from the commercial production areas in the municipalities of São Felipe (12°50'50" S, 39°05'22" W, altitude 195 m) and Cruz das Almas (12°40' S, 39°06'23" W, altitude 220 m) in the Recôncavo region of Bahia, Brazil were used (Table 1).
 
 
In each property of the respective commercial production areas, the yam plantation system used the individual staking mechanism with rods. In these areas, plants were chosen randomly and were marked with red ribbons for better visibility in the field where fortnightly analysis was performed. The evaluated morphological traits relate to the plant’s subterranean part (production) and the part above ground: rhizophore length in cm (RL); rhizophore width in cm (RWD); rhizophore weight in kg (RW) (Figure 1); rhizophore shape (RS – 1 - long and 2 - irregular) and skin color (SC – 1 - brown and 2 - yellow). The sample measurements of the morphological quantitative descriptors were carried out in accordance with the International Plant Genetic Resources Institute and International Institute of Tropical Agriculture (IPGRI, 1997).
 
 
For the quantitative descriptors, descriptive statistics were calculated, comprising of the minimum and maximum values, mean, standard  deviation  and  variation  coefficient,  using  SAS   (SAS Institute, 2011). The frequency percentages of the classes for each morphological descriptor and the entropy level  of the traits using the Renyi entropy coefficient (Renyi, 1961) were calculated according to the formula:
 
 
where entropy is a measure of the frequency of the distribution of (n) genotypes P  = (p1, p2... ps). pi= fi/n; p1 + p2 + ... + ps = 1; N = f1 + f2 + ... + fs, where f1, f2, ... fn are the counts of each of the classes in the descriptor considered. The values ​​of the entropy level (H') were classified as low (H '<0.50), moderate (H' = 0.50-0.75) and high (H '≥ 0.75) (Jamago, 2003).
 
Quantitative and qualitative variables were analyzed simultaneously using the Ward-MLM procedure for the composition of groups of accessions through the CLUSTER and IML procedures of SAS (SAS Institute, 2011). For Ward's clustering method, the distance matrix was obtained by the Gower algorithm (Gower, 1971). The definition of the optimal number of groups was carried out according to the pseudo-F and pseudo-t2 criteria combined with the likelihood profile associated with the likelihood ratio test (SAS Institute, 2011).
 
The graph of the difference between groups and the correlation of the variables with the canonical variable was established using the CANDISC procedure of SAS (SAS Institute, 2011). The distance proposed by Matusita (1955), adapted by Krzanowski (1983) and later by Franco et al. (1998), for the distribution of variables was used to determine the dissimilarity among the groups.


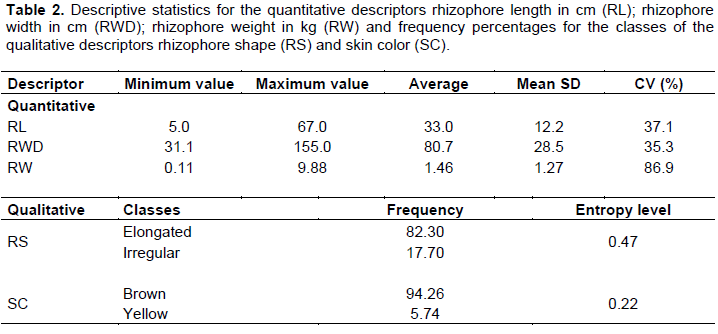
 RESULTS AND DISCUSSION

The rhizophore weight (RW) was the descriptor with the highest variation, with a coefficient of 86.9% (Table 2 and Figure 1). The range of variation was from 0.11 to 9.88 kg, with an average value of 1.46 kg. The average weight of marketable rhizophores is of great importance for decision-making by the farmer, given that, depending on the market and changes in rhizophore trade prices, the highest average weight rhizophores reach prices which are 20 to 30% higher than average rhizomes and 80% higher than small rhizomes, which can be a strategy to achieve greater profitability (Pereira et al., 2003).
 
 
The rhizophore length (RL) ranged from 5.0 to 67.0 cm, with an average of 33.0 and a 37.1% variation coefficient. Regarding the rhizophore width (RWD), the range was 31.1 to 155.0 cm, with an average of 80.7 cm and a variation coefficient of 35.3% (Table 2). The wide range and average in these descriptors between evaluated yam genotypes may suggest the existence of a broad genetic variability that can be used in breeding programs of the species. In general, considering all analyzed descriptors, the breeders must know the genetic inheritance of such traits and the peculiar edaphoclimatic factors in each micro-region, that influence the phenotypic plasticity of yam genotypes, and in crop management. It is important to not only define superior agronomic traits, but to stabilize them in order to provide local materials of high productivity and effective agronomic materials for the producers.
 
The entropy level can be used to quantify the variability present in qualitative descriptors by observing the relative frequencies of the classes for each evaluated descriptors. Low entropy values are associated with a lesser amount of phenotypic classes and high values ​​associated with descriptors with a large number of classes, which reveals genetic variability among the studied accessions (Vieira et al., 2007). In this study, the values ​​were found to be 0.47 and 0.22, indicating a high concentration of genotypes in only one class within each evaluated qualitative descriptor. A possible explanation may be the fact that the only source of yam genotypes (Moreira et al., 2007) is from the Batatan region, close to Cruz das Almas, as  well  as   the   limited   number   of   qualitative descriptors used in this study.
 
An important aspect in the cluster analysis interpretation consists of determining the number of groups that best describe the real structure of the analyzed data. Based on the likelihood function, the largest increase occurred in the formation of four groups, with a value of 68.29 (Table 3 and Figure 2). According to Gonçalves et al. (2009) and Barbé et al. (2010), analysis of the likelihood function can define more precise criteria in the formation of groups, resulting in the determination of less subjective groups. Padilla et al. (2005), evaluating the diversity of 120 populations of Brassica rapa subsp. Rapa L., found that the largest increase in the probability function was achieved when five groups were considered. In turn, Barbé et al. (2010), evaluating the genetic diversity of bean lines, verified the formation of three groups with increments of 14.66 in the logarithmic probability function. Thus, the number of groups can  vary depending on the studied species, the number of genotypes and the number and type of descriptors (Gonçalves et al., 2009).
 
 
Of the four groups (G1, G2, G3 and G4) formed by the Ward-MLM procedure, group 4 stood out in relation to the average of quantitative descriptors. The trait rhizophore length varied between 17.4 cm (group 3) and 35.1 cm (group 4). For the trait rhizophore width, variation was 64.7 cm (group 3) to 114.1 cm (group 2). The trait rhizophore weight ranged from 1.19 kg (group 1) to 9.66 kg (group 4) (Table 4 and Figure 3). The productivity of tradable rhizophores is the main purpose of commercial exploitation of yam. The rhizophore weight is an important factor on the consumer market. According to Santos (1996), rhizophores weighing between 0.70 and 1.50 kg are intended for the US market, those between 1.60 and 2.00 kg exported to France and those between 2.10 and 3.00 kg are destined for other European markets, while those weighing more than 3 kg are not of the export type and achieve lower prices. Thus, one must identify the factors responsible for obtaining these larger rhizophores to prioritize those for export, which will lead to a better remuneration for the producer. Most likely, some of these  determining  factors  in  the  production  of heavier rhizophores are the type and amount of fertilizer used in the culture management as well as the use of irrigation. 
 
 
The existing variation in the other traits (Table 4 and Figure 3) may be related to genotype × environment interaction. In Taro, a wide variation due to differences in locations, growing seasons and different management practices is observed (Pereira et al., 2003). Regarding yam genotypes, a likely explanation for the detected variation lies in the accessions from different regions, the management employed by traditional farmers through the introduction or exchange of materials within and between communities (Moreira et al., 2007), thereby generating a varying representation of variability.
 
For the canonical variate analysis, we found that the first two variables explained 94.26% of the total variability among the genotypes (Figure 4). This value indicates that the graphical representation of the first two canonical variables was appropriate for displaying the genetic relationship between groups as well as between genotypes within the same group.
 
 
The trait of the rhizophore weight had the highest correlation with the first canonical variable, followed by rhizophore width and  rhizophore  length,  with  values  â€‹â€‹of 0.92, 0.50 and -0.16, respectively. On the other hand, for the second canonical variable, the highest correlation estimates occurred for width (0.80), followed by rhizophore weight (-0.31) and rhizophore length (-0.20) (Table 4). The discriminatory power of the Ward-MLM method in the formation of groups is noticeable. From the results, the criteria used for the separation of the groups considering the canonical variables were apparently associated with the origin of genotypes, as they are from two regions with different soil and climatic conditions.
 
The distance between the formed groups corroborates the graphical representation of the canonical variables; groups 1 and 3 are the closest with a distance of 2.60, while group 4 was the furthest with 95.47 (Table 5). This fact can be explained by differences in genetic material (rhizophores seeds) planted by each producer. Furthermore, plants of vegetative propagation are, in general, highly heterozygous preserving the allelic diversity at individual level (IPGRI, 1997). The great similarity detected in the other groups may be due their common origin. Moreira et al. (2007) observed that in those regions of Recôncavo in Bahia, where yam is cultivated, most rhizophore seed come from a single region called Batatan which covers the municipality of Maragogipe.


 CONCLUSIONS

In this work, the diversity of 209 yam genotypes was accessed from the commercial production area of the Recôncavo region in the state of Bahia, Brazil. Considering the traits studied, the rhizophore weight (RW) was the descriptor with the highest variation (0.11 to 9.88 kg). The entropy values reported in this study indicated a high concentration of genotypes in only one class within each evaluated qualitative descriptor. The Ward-MLM algorithm was efficient for forming four homogeneous groups using morphological data. The group 4 stood out in relation to the average of quantitative descriptors and the canonical variate analysis, showed that the first two variables explained 94.3% of the total variability among the genotypes. Thus, the results obtained in this work will be very useful for selecting genotypes of different groups for breeding purposes. 


 CONFLICT OF INTERESTS

The authors have not declared any conflict of interests.


 REFERENCES

Arnau G, Bhattacharjee R, MN S, Chair H, Malapa R, Lebot VKA, Perrier X, Petro D, Penet L, Pavis C (2017). Understanding the genetic diversity and population structure of yam (Dioscorea alata L.) using microsatellite markers. PLoS one 12(3):e0174150.
Crossref


Asare S, Tetteh AY, Twumasi P, Adade KB, Akromah RA (2016). Genetic diversity in lowland, midaltitude and highland African maize landraces by morphological trait evaluation Afr. J. Plant Sci. 10(11):246-257.
Crossref


Barbé TC, Amaral Júnior AT, Gonçalves LSA, Rodrigues R, Scapim CA (2010). Association between advances generations and genealogy in inbred lines of snap bean by the Ward-Modified Location Model. Euphytica 173:337-343.
Crossref


Cabral PDS, Soares TCB, Gonçalves LSA, Amaral Júnior AT, Lima ABP, Rodrigues R, Matta FP (2010). Quantification of the diversity among common bean accessions using Ward-MLM strategy. Pesqui. Agropecu. Bras. 45(10):1124-1132.
Crossref


Carvalho PCL, Teixeira CA, Borges AJ (2009). Diversidade genética em Dioscorea spp. no Recôncavo da Bahia. Rev. Bras. Agroecol. 4(2):515-519.


Cole-Rodgers P, Smith DW, Bosland PW (1997). A novel statistical approach to analyze genetic resource evaluations using Capsicum as an example. Crop Sci. 37:1000-1002.
Crossref


Cruz CD (2013). GENES - a software package for analysis in experimental statistics and quantitative genetics. Acta Sci. Agron. 35(3):271-276.
Crossref


Da Silva Dantas DF, De Oliveira AP, Dantas TAG, Da Silva Bandeira N, Neto ADG (2013). Produção do inhame adubado com doses de N e esterco bovino. Semin: Cienc. Agrar. 34:3389-3396.
Crossref


Dansi A, Dantsey-Barry H, Dossou-Aminon I, Kpenu EK, Agré AP, Sunu YD, Kombate K, Loko YL, Dansi M, Assogba P, Voudohe R (2013). Varietal diversity and genetic erosion of cultivated yams (Dioscorea cayenensis Poir-D. rotundata Lam complex and D. alata L.) in Togo. Int. J. Biodivers. Conserv. 5(4):223-239.


FAOSTAT (2014). Food and agriculture organisation of the United Nation. http://www.fao.org/faostat/en/#data/QC. Accessed on 12.01.2016.


Franco J, Crossa J, Villase-or J, Taba S, Eberhart SA (1998). Classifyng genetic resources by categorical and continuous variables. Crop Sci. 38:1688-1696.
Crossref


Gonçalves LSA, Rodrigues R, Amaral Júnior AT, Karasawa M, Sudré CP (2009). Heirloom tomato gene bank: assessing genetic divergence based on morphological, agronomic and molecular data using Ward-modified location model. Genet. Mol. Res. 8:364-374.
Crossref


Gower JC (1971). A general coefficient of similarity and some of its properties. Biometrics 27:857-874.
Crossref


IPGRI (1997) Descriptors for Yam (Dioscorea spp.). International Institute of Tropical Agriculture, Ibadan, Nigeria/International plant genetic resources institute, Available from 

View.


Jaccard P (1908) Nouvelles recherches sur la distribution florale. Bull. Soc. Vaud. Sci. Nat. 44:223-270.


Jamago JM (2003). Morpho-agronomic and molecular diversity of the Philippine mungbean (Vigna radiata L.) germplasm. Philipp J. Crop Sci. P. 174.


Krzanowski WJ (1983). Distance between populations using mixed continuous and categorical variables. Biometrika 70:235-243.
Crossref


Lebot V (2009). Tropical root and tuber crops: cassava, sweet potato, yams and aroids. Wallingford: CABI. Crop Prod. Sci. Hortic. Series 17:413.


Loko YL, Bhattacharjee R, Agre AP, Dossou-Aminon I, Orobiyi A, Djedatin GL, Dansi A (2016). Genetic diversity and relationship of Guinea yam (Dioscorea cayenensis Lam.–D. rotundata Poir. complex) germplasm in Benin (West Africa) using microsatellite markers. Genet. Resour. Crop pp. 1-15.


Mahalanobis PC (1936). On the generalized distance in statistic. Proc. Nat. Inst. Sci. India 12:49-55.


Matusita K (1955). Decision rules based on the distance, for problems of fit, two samples, and estimation. Ann. Math. Stat. 26:631-640.
Crossref


Mesquita AS (2001). Inhame na Bahia: a produção a caminho da competitividade. Bahia Agríc. 4(2):39-48.


Moreira RFC, Silva SA, Silva AN, Da Silva MS, Cerqueira LS, Sousa CS, Sampaio Filho OM (2007). Descritores práticos para caracterização botânica de genótipos de inhame no Recôncavo baiano. In: Simpósio Baiano de Educação Ambiental, I . Cruz das Almas. Annals... Annals: SBEA.


Nascimento WF, Siqueira MVBM, Ferreira AB, Ming LC, Peroni N, Veasey EA (2015). Distribution, management and diversity of the endangered Ameridian yam (Dioscorea trifida L.). Braz. J. Biol. 75:104-13.
Crossref


Nei M, Li WH (1979). Mathematical model for studying genetic variation in terms of restriction endonucleases. Proc. Natl. Acad. Sci. 76:5269-5273.
Crossref


Obidiegwu J, Loureiro J, Ene-Obong E, Rodriguez E, Kolesnikova-Allen M, Santos C, Muoneke C, Asiedu R (2009). Ploidy level studies on the Dioscorea cayenensis/ Dioscorea rotundata complex core. Euphytica 169:319-326.
Crossref


Padilla G, Cartea ME, Rodrigues VM, Ordás A (2005). Genetic diversity in a germoplasm collection of Brassica rapa Subs. Rapa L. from northwestern Spain. Euphytica 145:171-180.
Crossref


Pedralli G (2002). Distribuição geográfica e taxonomia das famílias Araceae e Dioscoreaceae no Brasil. In: Carmo CAS. Inhame e Taro: Sistemas de produção familiar. Vitória, ES: INCAPER. 289p.


Pereira FHF, Puiatti M, Miranda GV, Silva DJH, Finger FL (2003). Caracterização agronômica da produção de rizomas de clones de taro. Hortic. Bras. 21(1):99-105.
Crossref


Pestana RKN, Amorim EP, Ferreira CF, Amorim VBO, Oliveira LS, Ledo CAS, Silva SO (2011). Agronomic and molecular characterization of gamma ray induced banana (Musa sp.) mutants using a multivariate statistical algorithm. Euphytica 178:151-158.
Crossref


Renyi A (1961). On measures of entropy and information. In Proceedings of the fourth Berkeley symposium on mathematical statistics and probability pp. 547-561.


Santos ES (1996). Inhame (Dioscorea spp): aspectos básicos da cultura. João Pessoa: EMEPA-PB, SEBRAE. 158p.


Santos ES, Cazé Filho J, Lacerda JT, Carvalho RA (2007a). Inhame (Dioscorea sp.) tecnologias de produção e preservação ambiental. Rev. Tecnol. Ciênc. Agropecu. 1(1):31-36.


Santos ES, Fontinélli ISC, Lacerda JT, Matias EC, Barbosa MM (2007b). Sistema alternativo de produção de sementesde inhame (Dioscorea sp.). Rev. Tecnol. Ciênc. Agropecu. 1(2):19-24.


Santos ES, Macêdo LS (2002). Tendências e pespectivas da cultura do inhame (Dioscorea sp.) no Nordeste do Brasil. In: Simpósio nacional sobre as culturas do inhame e do taro, 2, João Pessoa. Annals..., João Pessoa: SNIT. pp. 21-31.


Santos ES, Macêdo LS, Matias EC, Melo AS (1998). Contribuição tecnológica para a cultura do inhame no Estado da Paraíba. EMEPAPB/MMA-PRONAF (EMEPA-PB. Documentos, 23). 84p.


SAS Institute (2011). Statistical Analysis System. SAS Version 9.3.1 SAS Institute, Cary, North Carolina.


Sheikh N, Kumar Y (2017). Morphological Characterization of Meghalayan Dioscorea spp. (yam), North East India. J. Agric. Sci. Technol.19(2):487-497.


Silva LRG, Bajay MM, Monteiro M, Mezette TF, Nascimento WF, Zucchi MI, Pinheir JB, Veasey EA (2014). Isolation and characterization of microsatellites for the yam Dioscorea cayenensis (Dioscoreaceae) and cross-amplification in D. rotundata. Genet. Mol. Res. 13:2766-2771.
Crossref


Silva LRG, Mezette TF, Nascimento WF, Silva EF, Veasey EA (2016). Spatially structured morphological and molecular diversity among Dioscorea cayenensis and D. rotundata yam accessions. Plant Genet. Resour. https://doi.org/10.1017/S1479262115000647.


Siqueira MVBM (2011). Yam: a neglected and underutilized crop in Brazil. Hortic. Bras. 29:16-20.
Crossref


Sudré CP, Gonçalves LSA, Rodrigues R, Amaral Júnior AT, Riva-Souza EM, Bento CS (2010) Genetic variability in domesticated Capsicum spp as assessed by morphological and agronomic data in mixed statistical analysis. Genet. Mol. Res 9:283-294.
Crossref


Vieira EA, Fialho JF, Silva MS, Faleiro FG (2007). Variabilidade genética do banco ativo de germoplasma de mandioca do cerrado acessada por meio de descritores morfológicos (Boletim de Pesquisa e Desenvolvimento, 129). Planaltina: Embrapa Cerrados 15 p.


Ward Junior JH (1963). Hierarchical grouping to optimize an objective function. J. Am. Stat. Assoc. 58:236-244.
Crossref


          */?>