ABSTRACT
Peanut (Arachis species) plants originated in South America where they have existed for thousands of years. Successively, peanut culture has been introduced in many African countries and was incorporated into local traditional food cultures. Numerous studies showed peanut nutritive importance and capacity to prevent several human diseases. The target of the present survey aimed to create a germplasm benchmark of peanut varieties in the north region of Côte d’Ivoire (West Africa country) since this plant is weakly studied in this geographic area. For this purpose, six peanut varieties were processed and pre and/or post-harvest measurements have been brought on seedlings. In addition, biochemical composition of peanut seed for each considered varieties were measured. Statistical analysis based on several R software functions showed a good quality of collected peanut data and proposed post-harvest parameters as an adequate factor clustering the present analyzed peanut varieties. Then, statistical analysis performed in this study, allowed to cluster analyzed peanut varieties in two different groups. Moreover, the same survey evidenced a strong agreement between both post-harvest and biochemistry parameters assessing the difference between the two detected peanut variety groups (p-value < 0.05). Finally, the findings exhibited protein, glucose as well as ash biochemistry parameters as decent indicators selecting and clustering the present managed peanut varieties (p-value <0.05). In conclusion, this study proved a methodology demarche suggesting the possibility to hypothesize peanut germplasm benchmark in the savanna region of Côte d'Ivoire.
Key words: Peanut (Arachis species) varieties, groundnut, pre and post harvesting parameters, biochemical composition.
Peanut (Arachis species), also known as groundnut or earth nut, is an important legume of underground fruiting. It is native to eastern South America region. Groundnut is now grown worldwide in the tropical and temperate zones primarily as an oil seed crop (Weiss, 1983; Bansal et al., 1993; Clavel, 1997) and was introduced by Portuguese explorers in the 16th century in West Africa. Peanut was widely cultivated in more than 100 countries and over 26.4 million hectares with an average productivity of 1.4 ton/ha (FAO, 2003; Barraud and Maury, 2004; Ntare et al., 2008). It is the fifth most important oilseed crop in the world after soybean, cotton seed, rape seed, and sunflower seed (Nwokolo and Smartt, 1996; FAO, 2003). In 2012, world production of groundnuts was estimated at 40.5 million/ton (FAOSTAT, 2012). Africa supplies about 27.4% of this production mainly with Nigeria, Sudan and Senegal (FAOSTAT, 2012). For consumption, legumes like peanuts (Arachis hypogea), bean (Phaseolus vulgaris), cowpea (Vigna unguiculata), and soybean (Glycine max) have an important contribution for daily diet of humans and animals. Some beans are eaten, cooked or served as mainly additive, and others provide vegetative oil. Groundnut is consumed as seeds, oil, and butter found in many foods, because of its common use for its nutritional qualities as an additive or for its technological skills. The fat content in groundnut has been largely studied. In general, groundnuts contain 50 to 55% fat of which approximately 30% is linoleic acid and 45% is oleic acid. Groundnut seed contain 20 to 25% protein on a dry seed basis and is a rich source of minerals (phosphorus, calcium, magnesium and potassium) and vitamins (Annerose, 1990; Savage and Keenan, 1994; FAO, 2003). Considering their organoleptic qualities and high fat content, Rakotovao (1994) and Schilling (1996) classified peanuts in three group: mouth peanuts are characterized by a clear and uniform color pods, large seeds (weight 100 seeds> 80 g) and at least two big seeds per pod with a fat content of around 50%; in oil peanuts, raw material for the production of oil and high performance husking (about 70%) have a high fat content (>50%) and 100 seed weight <50 g; and finally, peanuts which present two purpose have the characters at a time for the production of oil and for consumption state. They are characterized by low-fat (<50%) and a higher seed weight (100 seed weight <40 g) (Schilling, 1996). Despite its high potentialities producing several cereal crops, Côte d’Ivoire contributes at 0.26% (low contribution) of world output of groundnuts (FAOSTAT, 2012). Therefore, groundnut is seen in Côte d’Ivoire as a traditional peasant culture, mainly for self-consumption and domestic marketing. In other words, groundnut culture is weakly practiced in this country. Indeed, the bulk of production is concentrated in the savanna regions of the north, but culture is also present in the southern forest regions.
Thereafter, all these geographical parameters as well as climates, and the variability of ecological contexts considerably influence peanut plants morphologic aspects and their growth development. These ecological changes are superimposed on large differences in production systems, from slash and burn areas to those where production is partially mechanized, and since the boxes crops carefully maintained to field crops, or low crops case for local markets. However, it is believed that the improvement of the comprehension of groundnut or peanut plant cultures through morphological, biochemical as well as genetic selection can represent a useful approach improving quantitatively and qualitatively this culture worldwide and in particular in north region of Côte d'Ivoire. Hence, it was proposed through the present study to establish a peanut germplasm benchmark in this part of the world by collecting the latter’s morphological data from different experimental sites of the Peleforo Gon Coulibaly University of Korhogo. Here, six peanut varieties from both Dikodougou and Korhogo localities refereed as Arachide Dikodougou (ARD) and Arachide Korhogo (ARK), respectively were processed for a clustering analysis basing on the statistical integration of their pre-harvest, post-harvest and biochemistry parameters.
Source of raw materials and experimental design
Experiments were carried out on six peanut varieties from Dikodougou (AR1D, AR2D AR3D, and AR4D) and Korhogo (AR1K, AR2K). The study was conducted in the experimental site of the University of Korhogo (north of Côte d'Ivoire). This site are located between an altitude of 392 m between -5° 34 ‘31” and -5° 29’34” West longitude and between 9° 31’ 23” and 9° 31’32” latitude North and 5° 38’83.2” at an average altitude. The weather in this area is characterized by two types of Sudanese seasons: a dry season (November to April) and rainy season (from May to November). Annual precipitation varies between 1100 and 1600 mm (Diarrassouba et al., 2015). The present assays have been performed during the rainy season (from July to October). The experimental design was randomized at complete block with three (3) repetitions. In each repetition, each variety was shown on 3 lines of 10 m length corresponding to an elemental parcel. The distances are 80 cm between lines and 40 cm on the line.
Crop management
Showing was carried out in July 2013 during the rainy season. The seeds were treated in a mixture fungicide/insecticide and sown by two in each hill. After germination, thinning of plantlet was done leaving only a single plantlet per hill. No phytosanitary treatment was done during the plant growth; no input of fertilizers was made. Harvest was done manually, 120 days after sowing. Then the plants harvested from each plot were left to dry on the ground for 10 days. After 10 days, pods were removed from the boots for analyzes.
Parameters measurement
Pre-harvest, post-harvest and physicochemical parameters were measured for each experimental repetitions (three repetitions).
- It was started with pre-harvest parameters measurement, two weeks after showing. However, the number of branch per plant as well as plant height parameters were measured 30 and 60 days after sowing, respectively. Post-harvest parameter average values have been archived on 15 plants in each experimental site for each considered peanut variety. Furthermore, peanut maximum germination state was estimated assessing plant number two weeks after showing.
- Post-harvest measurements were performed on pods ten days after harvest. They were brought on yields of pods, the rate of single-seed pods, two seeds and three seeds in a kilogram of pods per variety.
Biochemistry parameters measurement
Biochemistry parameters were made on whole intact seeds (seed coat, embryo and cotyledons).
(1) Moisture content: Moisture was determined by drying the sample at 105°C for 24 h according to AOAC (1995). Samples were then cooled in desiccators and weighed. The loss in weight expressed as a percentage of the initial weight of the samples give their moisture content.
(2) Ash content: Ash was obtained after incineration at 550°C for 6 h according to AOAC (1995). 5 g sample was weighed into a previously dried and weighed porcelain crucible. The crucible with its content was placed in a furnace at 550°C for 6 h. After cooling in desiccators, the crucible with its content was weighed. The weight of the ash was expressed as a percentage of the initial weight of the sample.
(3) Fat content: Fat was determined based on the Sohxlet extraction method of AOAC (1995). Five gram (5.0 g) of the sample was introduced into a cartridge of Whatman. An empty flask reweighed and containing 60 ml of hexane was placed on the heating block of the Soxhlet apparatus and heated at 110°C. After 6 h of extraction, the flask was removed from apparatus and then the solvent was evaporated on a Rotary Evaporator. The flask containing the fat and residual solvent was placed on a water bath to evaporate the solvent followed by a further drying in an oven at 60°C for 30 min to completely evaporate the solvent. It was then cooled in desiccators and weighed. The fat obtained was expressed as a percentage of the initial weight of the sample.
(4) Protein content: Protein was determined by determination of total nitrogen according to the Kjeldahl method (BIPEA, 1976). The principle under the action of NAOH and after sulfuric mineralization in the presence of catalyst (CuSO4), ammoniac formed was neutralized. The ammonia in the sample solution was then distilled into the boric acid until it changed completely to bluish green. The distillate was then titrated with 0.1 N HCl solutions until it became colorless. The percent total nitrogen and crude protein were calculated using a conversion factor of 6.25.
(5) Total carbohydrate content: Total carbohydrate content is determined by different method [100% - (% moisture + % ash + % fat + protein %)].
(6) Energy content: Energy is calculated with 4 kcal/g carbohydrates, 4 kcal/g protein and 9 kcal/g lipids according to Livesey and Elia (1995).
VE = [(9 × %Fat) + (4 × %Protein) + (4 × %Carbohydrates)]
Statistical analysis
Data normalization process
Data analysis was performed by our previous developed computational statistical pipeline (Noel et al., 2016). In statistics, normalization refers to the creation of shifted and scaled versions of statistics, where the intention is that these normalized values allow the comparison of corresponding normalized values for different datasets in a way that eliminates the effects of certain gross influences, as in an anomaly time series (Dodge, 2003). Here, logarithm transformation of analyzed pre or post-harvest and biochemistry data with the purpose to simplify their comparison and integration were performed.
Bioinformatics and biostatistical pipeline content
The biostatistical pipeline used for the present survey includes several functions and scripts implemented in R statistical package environment (R Core Team, 2013). For this study, the following mentioned scripts and functions used are: Heat-map (gplots package, version 2.12.1. License: GPL-2) and phylogeny dendrogram based on Euclidian distance of Person correlation; N factors function in R environment determining the number of factors to extract for the present analysis (Horn, 1965; Franklin et al., 1995); Corrplot package from R software (R Core Team, 2013), testing the aforementioned and detected factors or/and components by parallel principal component analysis (parallel PCA) assessing variance difference and/or similitude between considered parameters and samples.
Descriptive and inferential statistic tests (Fisher and student tests) were performed in the present study assessing (i) data quality control (repetition data reliability) and (ii) data variability among analyzed peanut sample varieties by their biochemistry composition (biochemistry parameters).
Boxplot analysis assessing quality control of peanut collected data
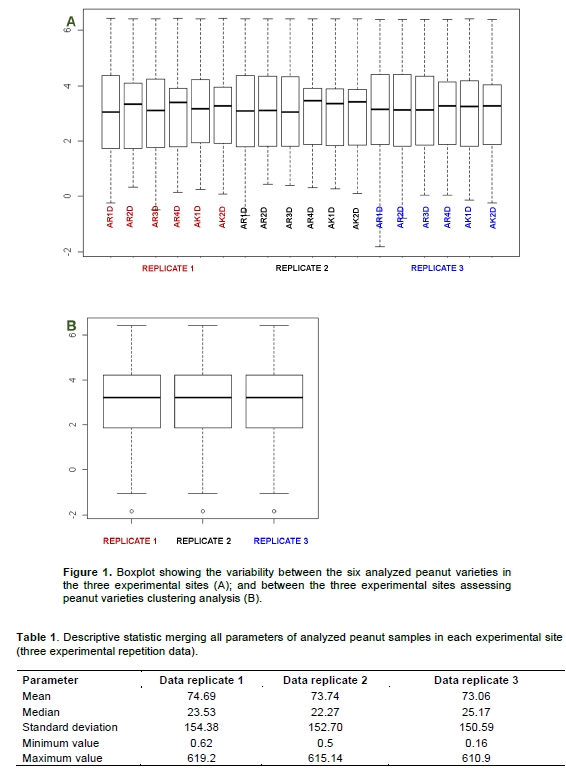
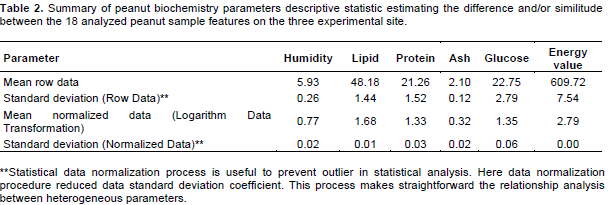
Experimental design of the present survey includes three repetition fields (three experimental sites). Each repetition included 6 peanut samples. Hence, data were collected and grouped in three replicate before being processed for analysis. Here, a quality control data analysis was performed, aiming to assess the reliability of peanut replicate samples considering both (i) pre and post-harvest and (ii) biochemistry parameters. Indeed, the variability coefficient between the three considered experimental sites was assessed. Then, even if panel A of Figure 1, evidenced the difference between the six analyzed peanut varieties in each considered experimental site, panel B of the same figure suggested a low variability between the latter’s (experimental sites). Next, the variance difference between the aforementioned experimental sites performing a Fishertest was evaluated. The results of this analysis reinforced the low variability observed between collected datafrom each analyzed experimental sites (p-value>0.80) as previously suggested by boxplot graph (Figure 1). Moreover, descriptive statistical analysis evidenced that processed samples replicates were comparable each to other (Table 1). Taking together, this analysis presumed that the present collected data were suitable for a statistical analysis reducing the potential errors due to replicate data variability.
Peanut plant clustering analysis by pre and post-harvest parameters
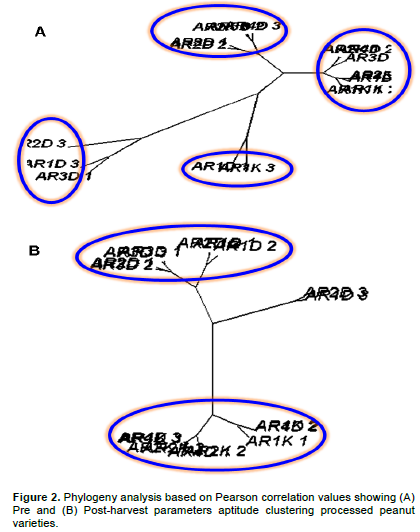
As previously supported, 6 varieties of peanut (AR1Dj, AR2Dj, AR3Dj, AR4Dj, AR1Kj and AR2Kj) have been considered for the present clustering analysis. Here a phylogeny analysis evaluating Euclidian distance of Pearson correlation with the goal to assess the capacity of both pre and post-harvest parameters explaining analyzed peanut variability was stimulated. Pre and post-harvesting feature data were normalized by logarithm transformation before processing them for statistical analysis. Pre-harvest parameters (morphological parameters) suggested high heterogeneity behaviors between analyzed peanut sample varieties as opposed to post-harvest parameters (Figure 2). Indeed, pre-harvest stage allowed to group peanut features in four diverse groups, while the post-harvest stage tended to reduce them in two groups (Figure 2). Taking together, these results suggested that, during their growing process, the present peanut varieties incline to cluster in two distinct groups. However, it is noteworthy to underline that the Pearson correlation values among all analyzed peanut features inside each discriminated group were significantly high (p-value<0.05) confirming their tendency to bunch in two great groups (Figure 2).
Heat-map evaluation of the similitude and/or dissimilitude between peanut samples by biochemistry parameters
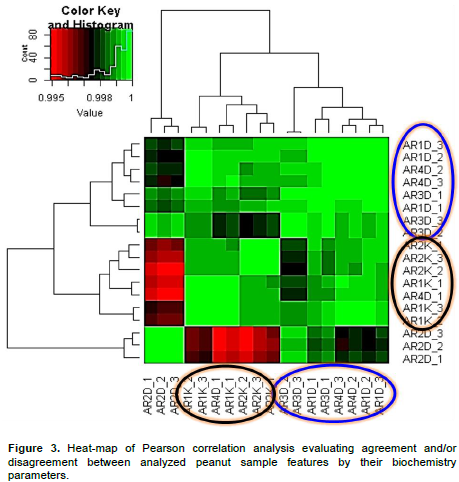
A heat-map analysis was achieved based on the Pearson correlation test between peanut sample features considering their biochemistry parameters with the aim to confute difference and/or similitude between the previous detected peanut groups (Figure 2; panel B). As suggested in materials and methods session, 6 different peanut varieties (AR1D, AR2D, AR3D, AR4D, AR1K and AR2K) on three different experimental sites were processed for statistical analysis. Based on their biochemistry contents, the present analyzed peanut samples exhibited a high agreement between themselves (R>0.99; p-value<0.05). However, despite this high concordance, heat-map correlation analysis, clearly evidenced two tendencies in peanut clustering survey, suggesting its agreement with the previous results session. Then, statistical analysis processing peanut biochemistry parameters tend to oppose peanut samples collected in Dikodougou (ARiDj group) with those pooled in Korhogo (ARiKj group) locality. Moreover, the present analysis suggested a relative high variability in ARiDj peanut varieties as opposed to AKiDj peanut category (Figures 2 and 3). Considered as whole, these analyses suggested that despite their high similitude in term of Pearson correlation weighing biochemistry parameters, the present processed peanut samples tend to cluster in two distinct groups (Figure 3). In other words, it is possible to cluster the present analyzed peanut varieties in 2 great groups based on their biochemistry composition. This section is in agreement with the previous one confirming the high variability in ARiDj peanut samples as opposed to AKiDj (Figure 3).
Relationship between analyzed peanut samples and biochemistry parameters by using biplot and principal component analysis
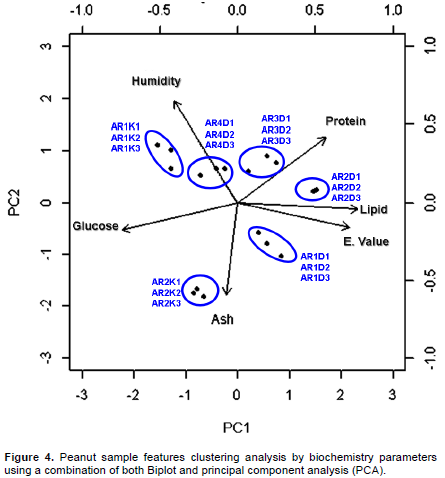
The biplot analysis highlights the heterogeneity behaviors between the 6 analyzed peanut varieties. This analysis also established the high variability among samples collected in Dikodougo land with respect to those collected in Korhogo land as previously shown (Figures 2 and 3). However, the present relationship analysis showed that replicate samples inside each analyzed peanut features (3 replicate × 6 peanut samples) exhibited a good clustering and a great agreement among themselves (Figure 4). In other word, the present analysis evidenced a low intra features data variability suggesting a good quality of the present collected data (Figure 1). In addition, principal component survey showed that energy source provided by peanut varieties, was strongly associated with their lipid biochemistry contents (Figure 4). The same analysis suggested a good agreement between energy source and peanut protein component. By contrast peanut glucose component exhibits low concordance with energetic nutritive component (Figure 4). Taking together, we were able to show that glucose component was not a good predictor of energy parameter in the present analyzed peanut sample features as opposed to both lipid and protein biochemistry components (Figure 4). Also, and as expected, it was shown that ash element was not a good predictor of humidity (Figure 4). Moreover, these two components (ash and humidity) contrast with considered peanut feature samples energy parameter (Figure 4). At this point, it could be interesting to investigate how biochemical composition of the present analyzed peanut varieties could influence their relative observed heterogeneity and/or similitude.
Parallel analysis evaluating right number of needed principal component examining peanut samples varieties
Parallel analysis in PCA survey is a useful method to establish the number of principal component needed in a multi-variant statistical analysis. In this analysis, a theoretical estimate variance is computed and compared to the observed and/or real variance. The output file of this analysis is a scree graph (Figure 5) in which both theoretic (gray) and observed (black) values have been reported and compared. For the present survey, only two components and/or biochemistry parameters (Components 1 and 2) exhibit their observed variance values higher than their respective theoretic variance (experimental data in black were compared with theoretic median value in gray). Generally, right component in a parallel PCA analysis must favor observed data with respect to theoretic data. Based on this observation and on Table 2 results, it was established that humidity, lipid, ash and energy variant parameters (4 components) appear to favor theoretic values displaying their estimated values under the threshold measure (Figure 5).
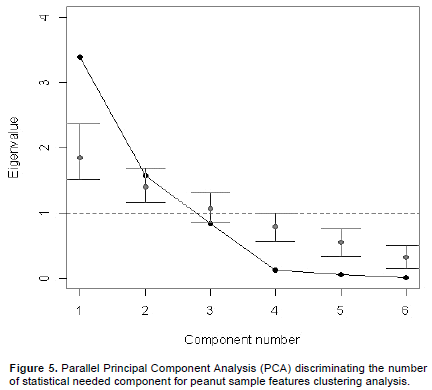
In other words, these biochemistry parameters were not able to considerably assess the difference between the two detected peanut group varieties. Next based on the standard deviation parameter values, variance proportion was shown to be associated to previous mentioned components 1 and 2 are 0.95 and 0.034, respectively (p-value<0.0001). Then, the cumulative proportion of variance among these two components is estimated to 0.99 (p-value<0.0001). Then, both detected components 1 and 2 are statistically able to explain the differences observed between the 6 analyzed peanut varieties through their biochemistry parameters. Merging these results with those reported in Table 2, it can be suggested that both glucose and protein biochemistry parameters as components 1 (Comp 1) and 2 (Comp 2), respectively, were easily able to explain the difference observed between the two previous detected peanut varieties.
Principal component analysis network assessing the relationship between peanut samples biochemistry parameters by 2 components
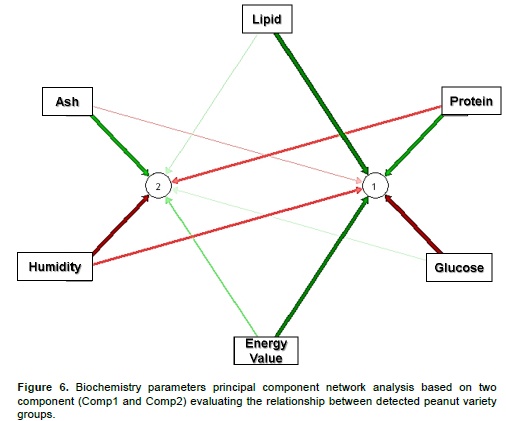
The present network analysis evidenced a high concordance between lipid, protein and energy source parameters by the first component (bold green arrow associated with Comp 1 in Figure 6). In other words, lipid, protein and energy composts display a good concordance assessing the difference among analyzed peanut varieties (Figure 6). The same investigation showed that humidity, ash and glucose biochemistry parameters exhibited an opposite behavior with respect to lipid, protein and energy source parameters (bold red arrow against bold green arrow in association with Comp1 in Figure 6). These results suggested that differences observed between the two detected peanut varieties (ARiDj and ARiKj) could be explained in both (i) energy and/or lipid and/or protein and (ii) glucose and/or humidity and/or ash biochemical parameters categories. Moreover, based on the principal component 2 (comp 2), the present principal component network analysis tend to associate protein and humidity parameters (red arrow) suggesting a potential agreement between these two biochemistry elements assessing the comparison between the 6 peanut sample varieties. However, considering that the difference between the two discriminated peanut groups were explained by both components 1 and 2, the present analysis supposed that ash component could reasonably act as a good biochemistry parameter explaining the difference between previously mentioned peanut groups as opposed to lipid, energy and humidity (Figure 6). In the same tendency, the present investigation suggested both peanut glucose and protein composition as valuable parameters highlighting the dissimilarities observed between the two discriminated peanut varieties (Figures 3 and 6). Considering as whole, glucose and protein parameters as well as peanut ash constituent should exhibit a significant statistical difference between the two detected peanut group varieties (ARiDj and ARiKj).
Statistical analysis assessing the difference between both ARiDj and ARiKj peanut varieties by biochemistry components
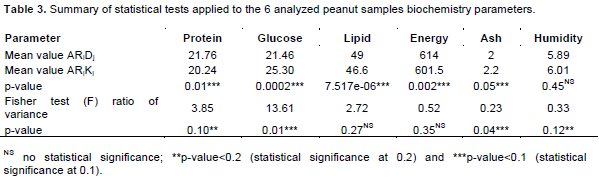
A statistical analysis was implemented based on both student and Fisher test assessing the difference between ARiDj (peanut form Dikodougou) and ARiKj (peanut from Korhogo) peanut varieties by all processed biochemistry parameters ((i) Glucose, (ii) Protein, (iii) Ash, (iv) Lipid, (v) energy variant, and (vi) humidity). As expected, both Fisher and student tests confirmed the significant difference in glucose and protein components (p-value associated to glucose tests reached from 0.01 to 0.0003, while those associated to protein fluctuated between 0.15 and 0.01) evaluating the variance between the two discriminated peanut varieties (Table 3). In the same tendency, ash component has been detected as significantly differentially modulated between the two analyzed peanut groups (p-value<0.05). The same investigation considering both lipid and energy parameters, because of their high link with protein, showed that both lipid and energy parameters were reasonably differentially modulated between the two analyzed categories of peanut groups (t test in Table 3; p-value <0.057). However, estimated variance between both ARiDj and ARiKj peanut ecotypes by the latter’s (lipid and energy value) was not significant (p-value>0.05, Table 3). These results could exclude both lipid and energy component as good indicator in the present peanut germplasm clustering analysis. However, the present analysis suggested ash component as a good parameter (as opposed to lipid and energy parameters) evaluating the difference between the two aforementioned peanut varieties groups. Better, ash biochemistry parameter displays a significant variability among both detected ARiDj and ARiKj peanut groups as opposed to peanut lipid and energy component (p-value<0.05; Table 3). The present result also established and confirmed both glucose and protein biochemistry parameters as top principal component evaluating ARiDj and ARiKj peanut samples differences. In addition, ARiKj peanut varieties were shown to record the highest performance producing glucose substance as opposed to ARiDj group, while the latter exhibits a significant high level of protein (Table 3). Considering as a whole, this analysis demonstrated that peanut variety collected in Dikodougou (ARiDj) favors glucose biochemistry compost biosynthesis, while those pooled in Korhogo (ARiKj) appears to good turn protein biosynthesis.
The genus Arachis is native to a region that includes Central Brazil and neighboring countries. Cultivated peanut is grown worldwide as rich-source of oil and protein. However, cultivated peanut exhibits a considerable amount of variability for various morphological, physiological, and agronomic traits. Little is known about both morphological and biochemical composition of peanut variety cultivated and recorded in Côte d'Ivoire since peanut cultures in this area of the world is not fully practiced. The understanding of both morphologic and genetic diversity of cultivated and wild species of peanut (Arachis spp.) is essential to develop strategies of collection, conservation and use of the germplasm in variety development. The identity of the ancestor progenitor species of cultivated peanut has also been of great interests (Moretzsohn et al., 2004). However, considering that in Côte d'Ivoire the bulk of peanut production is concentrated in the northern savannah regions, a peanut clustering analysis was realized in this geographical area aiming to develop the latter’s local germplasm variety in prelude to future genetic gathering investigation. Indeed, for this investigation, six different peanut sample groups and/or variety with 3 replicate each were processed by both pre or post-harvest and biochemistry parameters since peanut present several important nutritional proprieties (Ensminger et al., 1986; Blomhoff et al., 2006; Talcott et al., 2005). Moreover, peanuts are an excellent source of biotin, copper, manganese, niacin, molybdenum, folate, vitamin E, phosphorus, vitamin B1, and protein as previously indicated (Nutritional Labeling of Food, 2010; USDA National Nutrient Database, 2010). Numerous studies showed health benefit of peanut preventing several cancers and diseases as well as their potential antioxidant effects (Blomhoff et al., 2006; Mathers, 2002; Awad et al., 2002; Alper et al., 2003). Considering as whole, it is evident that diligent initiatives directing to help quantitative and qualitative yield of peanut (Arachis spp.) as promoted by this study could represent a high nutritional and health preventing opportunity for worldwide populations in general and in particularity for the populations in the north of Côte d'Ivoire. Then, the present investigation focusing on phylogenic survey by Pearson correlation analysis suggested that morphologic approaches based on pre-harvest parameters were not adequate factors evaluating peanut varieties differences as opposed to post-harvesting parameters (Figure 2). In fact, phylogenic analysis based on post-harvesting parameters weighing the variability between the six considered peanut varieties, evidenced two tendencies (Figure 2; panel B). This analysis allowed to clustered whole analyzed peanut features (six peanut varieties replicated three time; 18 peanut sample features in total) in two distinct groups (ARiDj and ARiKj). Further, Person correlation analysis by heat-map graphic (Figure 3) considering peanut varieties, biochemistry composition confirmed these two groups (p-value>0.05). These observations suggested that the two detected peanut varieties could assume selective and distinct physical and biochemical characteristics and compositions during their respective growing process. Moreover, evaluating the relationship between detected peanut groups and their biochemistry parameters, it was possible to show a good quality of the present collected data (Figures 1 and 4). In other words, the present investigation suggested low variance variability among considered peanut varieties replicate (low intra features data variability). The same analysis also showed a strong agreement between both peanut lipid and energy variant parameters, suggesting that energy or nutritive calories resource provided by the present analyzed peanut samples meanly arise from their lipid component (Figure 4). Indeed, this observation is in agreement with the aforementioned energy variant (EV) equation (materials and methods session). Further, both lipid and energy variant parameters in the present survey exhibited a low variance difference between the two detected peanut variety suggesting that investigated peanut categories yield the same amount of lipid and provide the same nutritive calorie value (p-value>0.05). Considering as whole, lipid and energy variant biochemistry factors resulted inadequate parameters discriminating the difference between the two detected peanut groups ARiDj and ARiKj. However, peanuts have been recognized as a protein source (Singh and Singh, 1991) since peanut butter became sought after at the time of Second World War when meat was not readily available. A one ounce serving, about a handful, is considered an excellent source of protein by the Food and Drug Administration (FDA). Peanuts are actually a legume and have more protein than any other nut with levels comparable to or better than a serving of beans (U.S. Department of Agriculture Research Service, 2009). The principal component analysis developed in the present study opposed both proteins and glucose biochemistry parameters measuring peanut varieties variability (Figure 4). This contrast has been used as pretext to estimate variance difference between both selected ARiDj and ARiKj peanut varieties (Figures 5 and 6). Indeed, it is noteworthy to observe that, in addition to protein and glucose component, ash biochemistry parameter revealed significant differential behaviors between the two detected peanut varieties groups (Figure 6 and Table 3). The present results are essential and useful to understand and develop strategies of peanut collection, conservation as well as to improve peanut germplasm variety expansion in the North region of Côte d'Ivoire. Moreover, our findings revealed that peanut ARiDj peanut variety appears to favor protein biosynthesis, while ARiKj peanut varieties record a consistent amount of glucose (p-value<0.05). Then, peanut collected in Dikodougou land (ARiDj) seems to promote protein biochemistry compost as opposed to those collected in Korhogo locality (p-value<0.05). These observations provided strong biochemical indicators (protein and glucose) in peanut varieties clustering analysis performed in the savanna region in North of Côte d'Ivoire. Taking together, these findings presumed that peanut capacity to synthetize both protein and glucose biochemical composts could depend and/or influenced by environmental and ecosystem components. This study also highlighted high variability inside peanut variety collected in Dikodougou (ARiDj) (Figures 2, 3 and 4) without mentioning the profound reasons of this changeability. However, it is believed that further analysis in increasing collected data size (that is, more experimental repetitions) as well as data integration by new parameters such as physical-chemical features considering that peanuts are an excellent source of numerous inorganic elements, could substantially improve the present peanut germplasm analysis quality. Also, based on the fact that the current analyzed data have been collected several years ago (three year ago), the development of a statistical stimulation platform combined with the integration of other measured parameters is trusted (physical-chemical parameters), to help in updating the present investigation results.
Nutritive importance of peanut has been fully demonstrated by previous studies. Peanut plant varieties clustering process appears to be a good start point understanding the importance of these plants since it could provide useful information regarding (i) pre, post-harvest behaviors and (ii) biochemical composition. The present survey, integrating both pre and post-harvest and biochemistry parameters, provided an excellent analysis model in peanut clustering analysis and allowed to discriminate two different peanut varieties in the present analyzed area. Finally, this study proposed both protein and glucose biochemistry components as well as ash compost as relevant and acceptable indicators selecting and clustering peanut sample features in the North region of Côte d'Ivoire.
The authors have not declared any conflict of interests.
The authors would like to thank Mr Ouattara Daoda, Coulibaly Micheal Pefoundgodjomon and MChristGn for their practice assistance in preparing experimental sites.
REFERENCES
|
Alper CM, Mattes RD (2003). Peanut consumption improves indices of cardiovascular disease risk in healthy adults. J. Am. Coll. Nutr. 22(2):133-41.
Crossref
|
|
|
|
Annerose DJM (1990). Recherches sur les mécanismes physiologiques d'adaptation à la sécheresse. Application au MS de l'arachide (Arachis hypoea L.) cultivée au Sénégal (Doctoral dissertation, Thèse de doctorat Sci. Nat., Paris VII:200.
|
|
|
|
|
Awad AB, Chan KC, Downie AC, Fink CS (2000). Peanuts as a source of beta-sitosterol: A sterol with anticancer properties. Nutr. Cancer 36(2):238-241.
Crossref
|
|
|
|
|
Bansal UK, Satija DR, Ahuja KL (1993). Oil composition of diverse groundnut (Arachis hypogaea L). Genotypes in relation to different environment. J. Sci. Food Agric. 63(1):17-19.
Crossref
|
|
|
|
|
Barraud M, Maury F (2004). Sénégal : l'affaire Sonacos. Écoï¬nance 13 juin 2004.
|
|
|
|
|
BIPEA (1976). Recueil des méthodes d'analyse des communautés européennes. Bureau Interprofessionnel d'Études Analytiques, Gennevilliers. France. 140 p.
|
|
|
|
|
Blomhoff R, Carlsen MH, Andersen LF, Jacobs DR (2006). Health benefits of nuts: potential role of antioxidants. Br. J. Nutr. 96(S2):S52-S60.
Crossref
|
|
|
|
|
Clavel D (1997). Amélioration génétique de l'adaptation à la sécheresse de l'arachide. 3e rapport scientiï¬que. CIRAD- ISRA 160 p.
|
|
|
|
|
Diarrassouba N, Dago DN, Soro S, Fofana IJ, Silué S, Coulibaly A (2015). Multi-Variant Statistical Analysis Evaluating the Impact of Rhizobacteria (Pseudomonas fluorescens) on Growth and Yield Parameters of Two Varieties of Maize (Zea mays. L). Int. J. Contemp. Appl. Sci. 2(7):206-224.
|
|
|
|
|
Dodge Y (2003). The Oxford Dictionary of Statistical Terms, OUP. ISBN 0-19-920613-9 entry for normalization of scores.
|
|
|
|
|
Ensminger AH, Esminger ME, Konlande JE, Robson JRK (1986). Food for Health: A Nutrition Encyclopedia. Clovis, California: Pegus Press.
|
|
|
|
|
FAO (2003). L'évaluation de la dégradation des terres au Sénégal. Projet FAO Land Degradation Assessment. Rapport préliminaire. Avril. 59 p.
|
|
|
|
|
FAOSTAT (2012). Production – quantité de l'arachide non décortiqués. Mise à jour : 04 août 2014.En ligne
View Consulté le 15 Octobre 2015.
|
|
|
|
|
Franklin SB, Gibson DJ, Robertson PA, Pohlmann JT, Fralish JS (1995). Parallel analysis: A method for determining significant principal components. J. Veg. Sci. 6(1):99-106.
Crossref
|
|
|
|
|
Horn JL (1965). A rationale and test for the number of factors in factor analysis. Psychometrika 30(2):179-185.
Crossref
|
|
|
|
|
Livesey G, Elia M (1995). Short chain fatty acids as energy source in the colon: Metabolism and clinical implications. In: Physiological and Clinical Aspects of Short Chain Fatty Acids (Cummings JH, Rombeau JL, Sakata T) (Eds.). pp. 427±482. Cambridge University Press, Cambridge, UK.
|
|
|
|
|
Mathers JC (2000). Pulses and carcinogenesis: Potential for the prevention of colon, breast and other cancers. Br. J. Nutr. 88(3):S273-S279.
|
|
|
|
|
Moretzsohn MC, Hopkins MS, Mitchell SE, Kresovich S, Valls JF, Ferreira ME (2004). Genetic diversity of peanut (Arachis hypogaea L.) and its wild relatives based on the analysis of hypervariable regions of the genome. BMC Plant Biol. 14:4:11.
|
|
|
|
|
Noel DD, Nafan D, Anatole KN, Baba-Moussa L (2016). Computational Statistics Assessing the Relationship between Different Rhizobacteria (Pseudomonas fluorescens) Treatments in Cereal Cultivation. Am. J. Bioinform. Res. 6(1):1-13
|
|
|
|
|
Ntare BR, Diallo AT, Ndjeunga J, Waliyar F (2008). Groundnut Seed production Manual. Patancheru 502 324, Andhra Pradesh. India: International Crops Research Institute for the Semi-Arid Tropics (ICRISAT) 20 p.
|
|
|
|
|
Nutritional Labeling of Food (2010). Code of Federal Regulations, 21 CFR 101.9, Release data.
|
|
|
|
|
Nwokolo E, Smartt J (1996). Peanut ( Arachis hypogaea L.). In: Food and feed from legumes and Oilseeds. Chapman and Hall: 1st edition, London; New York, pp. 48-58.
Crossref
|
|
|
|
|
R Core Team (2013). R: A language and environment for statistical computing. R Foundation for Statistical Computing, Vienna, Austria. ISBN 3-900051-07-0, URLhttp://www.R-project.org.
|
|
|
|
|
Rakotovao EV (1994). Importance du facteur variété/semence dans la relance de la production arachidière. Mémoire de fin d'étude: Université d'Antananarivo, ESS.
|
|
|
|
|
Savage GP, Keenan JI (1994). The composition and nutritive value of groundnut kernels. In: Smart J. (Ed.). The Groundnut Crop: Scientific basis for improvement, London: Chapman and Hall, pp. 173-213.
Crossref
|
|
|
|
|
Schilling R (1996). L'arachide en Afrique tropicale. Le Technicien d'agriculture tropicale. Paris: Editions Maisonneuve et Larose.
|
|
|
|
|
Singh B, Singh U (1991). Peanut as a source of protein for human foods. Plant Foods Hum. Nutr. 41(2):165-177.
Crossref
|
|
|
|
|
Talcott S, Passeretti S, Duncan C, Gorbet W (2005). Polyphenolic content and sensory properties of normal and high oleic acid peanuts. Food Chem. 90(3):379-388.
Crossref
|
|
|
|
|
USDA (2009). U.S. Department of Agriculture, Agricultural Research Service. USDA National Nutrient Database for Standard Reference, Release 22. Nutrient Data Laboratory Home page. Available at:
View
|
|
|
|
|
USDA (2010). National Nutrient Database for standard Reference, Release 23 (2010). Available at:
View
|
|
|
|
|
Weiss EA (1983). Oilseed Crops. First edition, pp. 100-117.
|
|


