Full Length Research Paper
ABSTRACT
Mung bean, the most important and short duration pulse crop, grown for grain from tropical to sub-tropical climates is low in productivity and lacks recommended inter-row spacing and NP fertilizer rate for various agro-ecologies. A study was conducted to determine inter-row spacing and NP fertilizer rates for yield and yield components of mung bean at Mirab Abaya. The experiment consisted of three inter-row spacing (15 × 10, 25×10 and 35× 10 cm) and five levels of combined NP fertilizer rates (control; 20.5:23, 41:46, 61.5: 69 and 82:92 NP kg ha-1). The treatments were laid out in a factorial experiment in a randomized completely block design with three replications. The result indicated that significantly (p < 0.05) maximum grain yield (2346.67 kg ha-1), number of grains per pod (10.7), biological yield (8094 kg ha-1), straw yield (5747.4 kg ha-1) was attained at an inter-row spacing of 25 × 10 cm and significantly maximum grain yield (2511.1 kg ha-1), number of grains per pod (12), 100 seed weight (4.34 g), biological yield (8897.8 kg ha-1) and straw yield (6387 kg ha-1) was recorded when applying combined NP fertilizer rate at 61.5:69 kg ha-1. According to the partial budget analysis, a high net benefit (birr 53745.75) was obtained at an NP level of 61.5:69 kg ha-1. Therefore, a combined NP fertilizer application rate of 61.5:69 kg ha-1 accompanied with an inter-row spacing of 25 × 10 cm is recommended at Mirab Abaya and related agro-ecologies for increasing Mung bean grain yield.
Key words: Agroecologies, combined NP, inter-row, Mung bean.
INTRODUCTION
Mung bean (Vigna radiata L.) is one of the most important and short-season pulse crops, cultivated for lysine-rich grain and easily digestible protein in tropical to sub-tropical agro-ecologies around the world. The growing awareness of the nutritional benefits of Mung bean has increased consumption by 22 to 66% in recent years (Sekhon et al., 2004; Chadha, 2010). The crop is characterized by fast growing habits under warm conditions and low water requirement and excellent soil fertility enhancement via nitrogen fixation (Moore et al., 2014).
Agriculture is a major source of income generation around Mirab Abaya. Though irrigation facility is not sufficient, farmers were still engaged in rearing livestock and producing annual cereals crops (maize, teff and sorghum), pulses (common bean and Mung bean), vegetables (tomato, pepper and cabbage) and fruit crops (banana and papaya) by using irrigation water from Lake Abaya with simple water pumping generator.
Annual world production and area of Mung bean is estimated as 2.4 million metric tons harvested from about 6 million hectares of land (Chauhan and Williams, 2018). The crop, although not indigenous, had been cultivated in different parts of the Ethiopian region like Shewa, Hararge, Ilubabor, Tigray, Gondar and Gamo Gofa (Degefa, 2016). It accounts for a total cultivated land of around 28,993 ha and production of 20,002 tons, with an average grain yield of 689.9 kg per ha (Mohammed et al., 2017). Mung bean production is also accustomed in moisture stress pocket areas of Gamo and Gofa, Southern Ethiopia (Daramalo, Mirab Abaya, Bonke, Boroda, etc.).
However, the existing productivity of Mung bean (689.9 kg ha-1) is far below from estimated potential yield of 3,120 kg per ha achieved from field trials (Dainavizadeh and Mehranzadeh, 2013). Cultivation of mung bean in marginal lands without fertilizer application, methods of cultivation, poor crop stand, imbalanced nutrition or fertilizer application, poor plant protection measures, and lack of high yielding varieties were found to be the main reasons for low productivity.Nutrient management affects crop growth, development and the final product (Achakzai et al., 2012). Like other legumes, mung bean also require nitrogen, phosphorus, potassium and sulfur for growth and development (Moore et al., 2014). Kumar et al. (2012) reported that application of nitrogen and phosphorus along with other micronutrients increased biological activity which improved plant height, number of nodules per plant, number of pods per plant and enhanced straw quality. Sadeghipour et al. (2010) also stated enhanced plant growth, increased plant protein, make plants green and play a major role in boosting crop yield through the application of combined NP fertilizer. Besides nutrition, growing season, cropping system, the vigour of a genotype, soil type and environmental condition determines inter-row spacing (seeding rate) to increase mung bean productivity (Chadha, 2010). An optimum plant stand was established at about 30 plants per meter square to obtain high yields in mung bean (Chauhan and Williams, 2018). Dainavizadeh and Mehranzadeh (2013) documented significant differences in yield and yield components due to various seed rates. Taufiq and Kristion (2016) also exhibited increasing plant population beyond optimum caused plants to grow taller, decreased chlorophyll content, number of trifoliate leaf per plant, leaf area per plant, total dry matter per plant, number of pods per plant, seed weight and ultimately final yield due to increased competition among individual plants. Besides, expansion of mung bean production to other potential areas where moisture stress was a challenge for producing long maturing crops may supplement protein needs and food security (Degefa, 2016). Thus, the present study was initiated to determine inter-row spacing and combined NP fertilizer application effect on growth, yield and yield components of mung bean and economics of mung bean cultivation with special reference to climatic conditions of Mirab Abaya, Southern Ethiopia.
MATERIALS AND METHODS
Description of study area
The study was conducted at Mirab Abaya woreda, Southern Ethiopia, geographically located in between 6°11′0′′ - 6°13′0′′ N and 37°37′0′′ - 37°45′0′′ E latitude and longitude, respectively and an altitude of 1193 m.a.s.l during 2017/2018 cropping season (Belg). The area is characterized with a mean monthly rainfall of 3.9 mm and an average minimum and maximum air temperature of 20.84 and 29.8°C, respectively. Physical and chemical properties of experimental soil were analyzed to a depth of 30 cm before planting and attributed as sandy loam in texture, slightly alkaline pH (8), medium in the organic carbon content of (1.5 %), total nitrogen (0.13%), and available phosphorus (11.18 mg per kg soil), very high in CEC (56 meq per 100 g soil) and electrical conductivity (0.7 µS).
Treatments and design of experiment
The field experiment consisted of five combined rates of nitrogen and phosphorus fertilizer rates (0N:0P kg ha-1, 20.5N: 23P kg ha-1, 41N: 46 P kg ha-1, 61.5N: 69 P kg ha-1 and 82N:92 P kg ha-1) and three inter-row spacing (35 × 10 cm, 25 × 10 cm, 15 × 10 cm). The treatments were laid out in 5 × 3 factorial arrangements in RCBD design and replicated three times. Each treatment was randomly assigned in each block by using random numbers procedure to minimize experimental error. The seeds of mung bean sowed on thoroughly ploughed and well prepared experimental plots sized for 4 m2 and made to contain 5 rows, 8 rows and 13 rows for inter intra row spacing of 35 × 10 cm, 25 × 10 cm and 15 × 10 cm, respectively, to attain a population of 285,000, 400,000 and 666,667 for respective inter-row spacing where the middle rows were used for data collection. Each experimental plot within a block and between blocks were spaced at 0.5 and 1 m, respectively for a gross area of 12*20 m2.
Urea for N and DAP for P were used as a fertilizer source. The full dose of DAP of the respective treatments was basally applied once during sowing for phosphorus whereas the remaining amount of N after DAP application of the respective treatments was applied in UREA form at 30 DAS along the planting row and covered with soil after application. The crop was harvest manually at 76 days after sowing when the leaf color had turned yellow at senescence.
Data collection
Data on plant height, number of branches per plant, number of flowers per plant, number of root nodules per plant, number of pods per plant, average pod length, number of grain per pod were collected from 10 randomly selected plants from each plot. Days to maturity (days), biological yield (kg ha-1), straw yield (kg ha-1), grain yield (kg ha-1), 100 seed weight (g) and harvest index were obtained from the net harvestable area of a one-meter square.
Data analysis
Analysis of variance of the field experimental data of various parameters was carried out using SAS version 9.2. Treatments means were separated using the Least Significant Difference (LSD) test at p< 0.05. Pearson’s correlation coefficient was used to display the magnitude and relationship among parameters. The Economics of mung bean cultivation was computed with a partial budget as suggested by CIMMYT (1988).
RESULTS AND DISCUSSION
Growth analysis
Plant height (cm)
Plant height was significantly (p < 0.05) affected by row spacing and combined NP fertilizer rates (Table 1). The interaction of row spacing and NP rates was not significant for plant height. Mean plant height ranged from 66.7 to 73.2 cm due to inter-row spacing, where the maximum attained on the inter-row spacing of 15 × 10 cm and the minimum recorded from the inter-row spacing of 35 × 10 cm (Table 1). The result indicated an increasing trend with decreasing row spacing suggesting competition for light due to differences in inter-row spacing. Zirak et al. (2015) reported increased plant height with decreasing inter-row spacing. Similarly, Mondal et al. (2012) reported increasing plant height from high seed rate and minimum plant height from low seeding rates suggesting an effect of competition for light and nutrients.
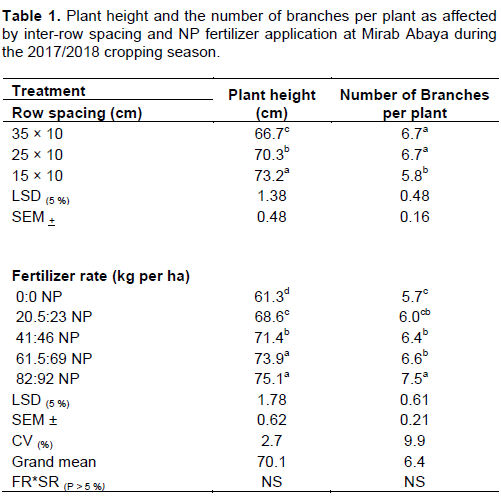
Mean plant height ranged from 61.3 to 75.1 cm due to combined NP fertilizer application rates where the maximum was recorded at NP fertilizer application rate of 82:92 kg per ha which was on par with 61.5:69 kg NP per ha. The minimum (61.3 cm) plant height was recorded from the no fertilizer applied plot. The result indicated that significantly increasing plant height with increasing NP fertilizer application rates (Table 1). The maximum plant height recorded at a higher dose of NP fertilizer application rate suggested the simulative effect of N on vegetative growth, production of carbohydrates through photosynthesis. The addition of phosphorus fertilizer enhances root development, which improves the supply of nutrients and water to the growing parts of the plants resulting in an increased photosynthetic area and thereby increase plant height. The plant needs phosphorus fertilizer for normal development also plays an important role in root growth and development (Kumar, 2007). Similarly, Chattha et al. (2017) and Kumar et al. (2012) reported increasing plant height increasing NP fertilizer application and advantage over the control.
Number of branches per plant
Results of analysis of the number of branches per plant towards inter-row spacing and combined NP fertilizer rates are presented in Table 1. The results of the analysis of variance showed that the number of branches per plant was significantly (p < 0.05) affected due to row spacing and combined NP fertilizer rates. There was no significant interaction noted between row spacing and NP fertilizer rates on the number of branches per plant.
In response to row spacing, the number of branches per plant ranged from 5.8 to 6.7 where the maximum was attained in row spacing of 35 × 10 cm which was statistically on par with 25 × 10 cm inter-row spacing. The minimum recorded from the inter-row spacing of 15 × 10 cm (Table 1). The result suggested a significant effect of competition for water, nutrients and sunlight due to narrow inter-row spacing. This result was in line with the finding of Zirak et al. (2015) who reported that maximum and the minimum number of branches per plant attained from wide and narrow row spacing, respectively.
The mean number of branches per plant ranged from 5.7 to 7.5 due to combined NP fertilizer application rates where the maximum obtained from NP fertilizer application rate of 82:92 kg per ha. The minimum was recorded from no fertilizer applied plots and had no significant difference with 20.5:23 kg NP per ha indicating a significantly increasing number of branches per plant with increasing NP fertilizer application rates. But the number of branches per plant recorded from the NP fertilizer application rate of 41:46 kg per ha had no significant difference with 61.5:69 kg per ha. Maximum NP fertilizer application showed 31.6% advantages over the no fertilizer applied plot on the number of branches per plant suggesting the importance of fertilizer application. Ali et al. (2010) reported that the maximum number of branches per plant was obtained when applying P at 84 Kg per ha.
Days to maturity
The result of analysis of variance showed that application of NP fertilizer rates significantly (p < 0.05) affected days to maturity. But neither inter-row spacing nor interaction of row spacing with NP fertilizer application rates showed significant variation in day to maturity (Table 2). Mean days to maturity ranged from 70.1 to 74 due to NP fertilizer application rates. Maximum days to maturity recorded from NP fertilizer application rate of 82:92 kg NP per ha and minimum recorded from no fertilizer applied plot (Table 2). Similarly, Ahmed et al. (2012) and Khan (2014) reported delayed crop maturity with the increasing application of N fertilizer. In contrast, Achakzai et al. (2012) reported no significant effect of combined NP and P and N application on days to maturity on mung bean, because days to maturity is a crop variety dependent attribute, which is influenced by the genetic makeup of a cultivar. Furthermore, Laekemariam and Worku (2013) stated that days to flowering and physiological maturity of mung bean depends on the availability of moisture in the soil.
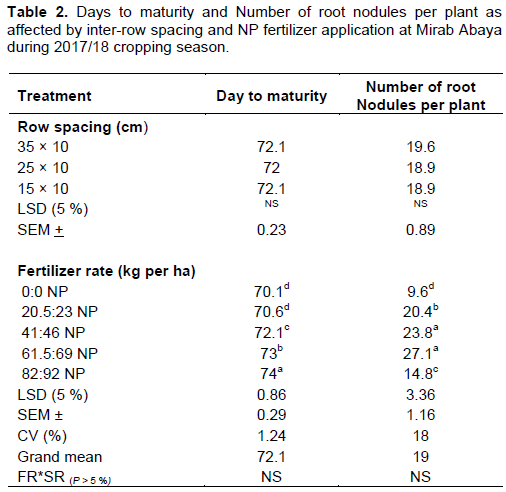
Number of root nodules per plant
As presented in Table 2, the number of root nodules per plant was significantly (p < 0.05) affected due to NP fertilizer rates. However, the effect of inter-row spacing and interaction of row spacing with NP fertilizer rates did not show a significant effect on the number of root nodules per plant. The mean number of root nodules per plant varied from 9.6 to 27.1 due to NP fertilizer application where the maximum number of root nodules per plant was obtained with the application of 61.5:69 kg per ha and had no significant difference with 41:46 kg NP per ha. A minimum number of root nodules per plant were recorded from the no fertilizer applied plot. The result indicated a progressive increase of NP fertilizer application significantly increased the number of root nodules per plant. In response to all levels of NP fertilizer application, the number of root nodules per plant increase from 54 to 182.3% over control (Table 2).
An increased number of root nodules in response to NP fertilizer application suggested the benefits of nitrogen and phosphorus on root growth and development. Inadequate phosphorus application restricts root growth, the process of photosynthesis, translocation of sugars, and other functions which directly or indirectly influence N fixation by legume plants. The increased nodule number due to increasing phosphorus rates indicated a deficiency in the study soils with phosphorus nutrition. Hussain et al. (2014) reported a 78-190% nodulation increase over control due to different phosphorus applications. Similarly, Chattha et al. (2017) reported a reduced number of root nodules per plant due to no NP fertilizer application. Significantly increased number of root nodules per plant over control for P application also reported by Kumar et al. (2012).
Number of flowers per plant (NFPP)
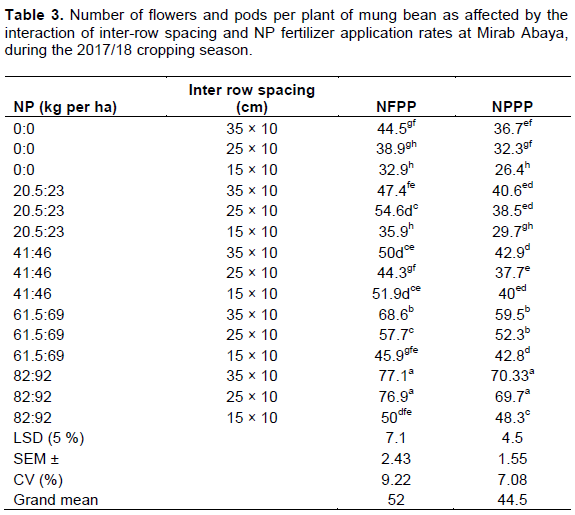
As presented in Table 3, the number of flowers per plant was significantly (p < 0.05) affected due to inter-row spacing and NP fertilizer application rates. The interaction between row spacing and NP fertilizer application rates was also significant (p < 0.05) for the number of flowers per plant. The maximum number of flowers per plant (77.1) was recorded in response to an inter-row spacing of 35 × 10 cm when combined with an NP fertilizer application rate of 82:92 kg per ha. Statistically, the par number of flowers per plant (76.9) was also recorded in response of 25 × 10 cm when combined with an NP application rate of 82:92 kg per ha. The minimum number of flowers per plant (32.9) was obtained in response to 15 × 10 cm with no fertilizer applied plot.
The increase in the number of flowers with increasing NP fertilizer application rates suggested the crop nutrient demand and deficiency of NP nutrition of the study soil. This result was per the finding of Chattha et al. (2017) who reported that the maximum number of the flower was recorded from increasing NP fertilizer application. Khan et al. (1999) also showed the maximum number of flowers per plant at a higher level of P application.
Yield and yield components
Number of pods per plant (NPPP)
The result of analysis of variance showed that the number of pods per plant was significantly (p < 0.05) affected due to inter-row spacing and NP fertilizer application rates. The interaction of inter-row spacing and NP fertilizer rate was also significantly (p< 0.05) affected the number of pods per plant (Table 3).
The mean number of pods per plant ranged from 26.4 to 70.3 due to interaction between inter-row spacing and NP fertilizer application, where maximum recorded when 35 × 10 cm combined with 82:92 kg NP per ha fertilizer application which statistical on par when 25 × 10 cm combined with 82:92 kg NP per ha., whereas the minimum number of pods per plant recorded from 15 × 10 cm when combined with no fertilizer application (Table 3). The effect of NP application on the number of pods per plant might be due to enhanced various enzymatic activities which control flowerings and pod formation (khan et al., 2010). This result showed that sufficient space favoured mung bean plants for more water, light, air and nutrients and more photosynthetic activity, which eventually resulted in a high number of pods per plant. Similarly, Chattha et al. (2017) reported a 25.4% increase in the number of pods per plant over the control due to NP fertilizers application and markedly reduced number of pods per plant due to no NP fertilizer application. Khan et al. (2017) reported that the maximum number of pods per plant was attained from the maximum level of P applied per ha.
The plots with low seed rates produced more pods per plant, vigorous growth, more branches per plant indicated effects of low competition for nutrients. The minimum number of pods per plant (29.6) from higher planting density and the maximum number of pods per plant from lower planting density was reported by Dainavizadeh and Mehranzadeh (2013). Mondal et al. (2012) and Jan et al. (2000) indicated decreased number of pods per plant with increasing planting density in mung bean.
Average pod length (cm)
The result showed that average pod length was significantly (p < 0.05) affected due to inter-row spacing and NP fertilizer application rates. However, the interaction of row spacing with NP fertilizer rates was not significant for average pod length (Table 4). Mean pod length ranged from 6.8 to 7.7 cm where maximum attained at an inter-row spacing of 35 × 10 cm and the minimum recorded from the inter-row spacing of 15 × 10 cm (Table 4). The result showed significantly decreased average pods length at narrow row spacing suggesting greater competition for resources. Khan et al. (2010) reported a 15% decrease in pod length when inter-row spacing narrowed from 45 to 15 cm. Similarly, Dainavizadeh and Mehranzadeh (2013) and Jan et al. (2000) stated a significant decrease in average pod length with increasing planting density.
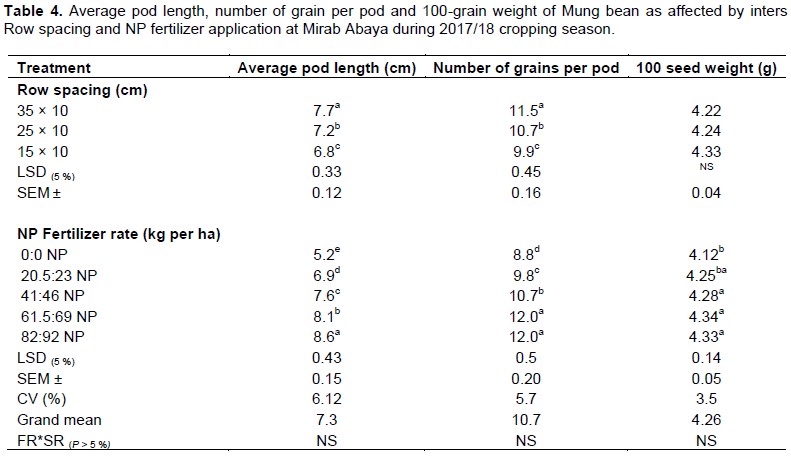
Mean pod length ranged from 5.2 to 8.6 cm due to NP fertilizer application rates. The maximum pod length (8.6 cm) was recorded with the application of 82:92 kg NP per ha and the minimum pod length was 5.2 cm recorded from 0 fertilizer applied plot (Table 4). The result indicated 32, 46, 55 and 65%, advantage in pod length over the control due to the application of 20.5:23, 41:46 , 61.5:69 and 82:92 kg per ha NP fertilizer rates indicating the importance of NP for mung bean production. The increasing pod length with increasing NP promoted pods and seed formation in legumes (Anetor and Akinrinde, 2006). Chattha et al. (2017) reported a significant influence of NP fertilizer application on pod length, where maximum attained with an application of NP at 20:50 kg per ha and minimum recorded with no NP application.
Number of grains per pod
As presented in Table 4, analysis of variance showed that the number of grains per pod was significantly (p < 0.05) affected due to inter-row spacing and NP fertilizer application rates. However, the interaction between row spacing and NP fertilizer application showed a non-significant effect on the number of grains per pod.
The mean number of grains per pod ranged from 9.9 to 11.5 due to inter-row spacing where the maximum number of grains per pod (11.5) was obtained from mung bean planted at an inter-row spacing of 35 × 10 cm whereas the minimum number of grains per pod (9.9) was recorded from mung bean planted at an inter-row spacing of 15× 10 cm. The result showed a 13.9% decrease in the number of grains per pod when inter-row spacing decreased from 35 × 10 cm to 15× 10 cm suggesting an effect of increasing competition on limited resources. Plants under reduced population absorbed more nutrients, intercepted more light and processed more photosynthates which ultimately resulted in more grains per pod (Jan et al., 2000). Similarly, Mondal et al. (2012) reported that grains per plant decreased with the increasing seeding rate in mung bean.
The mean number of grains per pod ranged from 8.8 to 12 due to NP fertilizer application rates where the maximum number of grains per pod was attained by applying NP rates of 82:92 kg per ha and the minimum number of grains per pod was recorded from no fertilizer applied plot. The maximum number of grains per pod attained from 82:92 kg per ha was on par with the number of grains per pod recorded from 61.5: 69 kg NP per ha. The respective NP application rates showed 11.4, 21.6 and 36% advantage over no fertilizer applied plot. The significantly increasing number of grains per pod with increasing NP fertilizer application rates indicated NP demand for mung bean production. The increase in the number of grains per pod in response to NP fertilizer application could also be associated with the physiological response of the mung bean flower setting and the ultimate increase in the number of grains per pod. Sadeghipour et al. (2010) reported a significant increase in the number of grains per pod in response to NP fertilizer application where the maximum number of grains per pod was attained at 120:120 kg NP per ha. Similarly, Mojaddam et al. (2014) also reported a maximum number of grains per pod (11.7) attained at a high application rate of NP fertilizer. Kumar et al. (2012) and Ayub et al. (1999) reported an increased number of grains per pod with increasing application of N.
100 seed weight (g)
Analysis of 100 seed weight response towards inter-row spacing and NP fertilizer rates is presented in Table 4. The results of analysis of variance showed that 100 seed weight was significantly (p < 0.05) affected due to NP fertilizer application rates. However, the effect of inter-row spacing and interaction effect of inter-row spacing with NP fertilizer application was not significant on 100 seed weight.
Mean 100 seed weight ranged from 4.12 to 4.34 g due to NP fertilizer application rates where the maximum 100 seed weight obtained when applying 61.5:69 kg NP per ha whereas, minimum 100 seed weight (4.12 g) recorded from 0 fertilizer applied plot. Mean 100 seed weight attained with 61.5:69 kg NP per ha was statistically on part with 100 seed weight recorded with 41: 46 kg NP per ha and 82:92 kg NP per ha. Chattha et al. (2017) and Khan et al. (2017) stated significant effect of combined NP and P application on 1000 seed weight where maximum 1000 seed weight attained from high rate applied plots. Furthermore, Sadeghipour et al. (2010) reported a high 100 seed weight recorded due to maximum P and NP per ha application, respectively.
Biological yield (kg per ha)
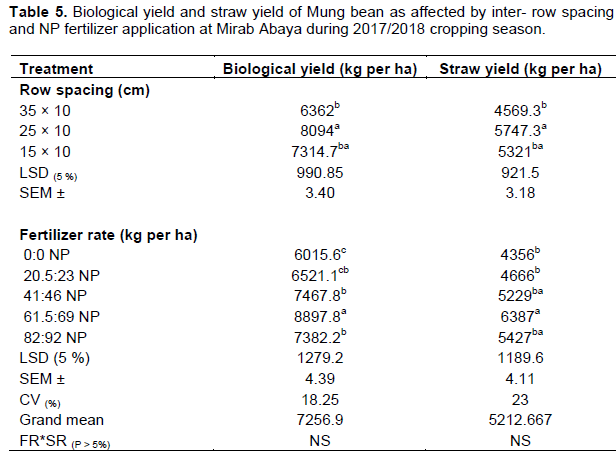
The result of analysis of variance showed that biological yield was significantly (p < 0.05) affected due to inter row spacing and NP fertilizer application rates. However, there was no significant interaction between inter-row spacing and NP fertilizer application on biological yield (Table 5). Mean biological yield ranged from 6362 to 8094 kg per ha due to inter-row spacing where maximum attained for mung bean planted in the inter-row spacing of 25 × 10 cm and minimum recorded from mung bean planted in-row spacing of 35 × 10 cm. The result indicated increasing inter-row spacing resulted in increased biological yield per ha up to row spacing 25 × 10 cm, further increase in row spacing to 35 × 10 cm resulted in a decrease in biological yield by about 9.6%. This result suggested that inter-row spacing of 25 × 10 cm was found to be optimum to get a maximum biological yield of mung bean.
Low plant population reduced competition for individual plants and favoured growth for yield components. In increased population, the number of plants increased per unit area and yield components decreased on an individual basis and eventually, the biological yield decreased. This result was in agreement with the findings of Ahmadi (2016) who reported a significant effect of increasing population on biological yield where maximum and minimum attained from low and high planting density, respectively. Ihsanullah et al. (2002) also reported increased biological yield with increasing plant density but further increase decreased biological yield. Taufiq and Kristiono (2016) reported increasing plant population of mung bean from 200,000 to 500,000 per ha significantly decreased the dry weight of mung bean.
Mean biological yield ranged from 6015 to 8897 kg per ha due to NP fertilizer application rates where the maximum biological yield (8897 kg per ha) obtained from NP fertilizer application rate of 61.5:69 kg per ha and minimum biological yield (6015 kg per ha) recorded from no fertilizer applied plot. The result indicated progressive significant biological yield increase due to NP fertilizer application up to 61.5:69 kg per ha. But, biological yield recorded at NP fertilizer application rate of 41:46 kg per ha was on par with 82:92 kg per ha (Table 5). The result showed NP fertilizer application increased biological yield from 8.5 to 48% over control. The progress increment of biological yield due to NP fertilizer application suggested vigour growth attained by the plant due to availability and absorption of nutrients. Increasing biological yield with increasing NP fertilizer application up to optimum NP rate was also reported by Chattha et al. (2017). Imran et al. (2016) also reported a high biological yield record at a rate of 60 kg P per ha and a low biological yield record from the control plot. Khan et al. (1999) also showed biological yield increase with increasing applied P rates from 0 to 120 kg per ha and maximum biological yield attained at P rate of 90 and 120 kg per ha. Furthermore, Ahmad et al. (2003) reported 24.5% enhanced straw yield over control due to NP application.
Straw yield (kg per ha)
As presented in Table 5, the result of analysis of variance showed that straw yield was significantly (p < 0.05) affected due to inter-row spacing and NP fertilizer application rates. However, there was no interaction between inter-row spacing and NP fertilizer on straw yield. Mean straw yield ranged from 4569.3 to 5747.3 kg per ha due to inter-row spacing where the maximum straw yield was recorded at a row spacing of 25 × 10 cm and the minimum straw yield recorded at mung bean planted inter-row spacing of 35 × 10 cm. This result indicates that mean straw yield increased up to inter-row spacing of 25 × 10 cm where a further increase to 35 × 10 cm reduced straw yield. Khan et al. (2010) reported significantly high biological yield and dry matter accumulation from the inter-row spacing of 45 × 10 cm and a decline in biological yield and dry matter accumulation on chickpea with narrowing inter-row spacing.
Mean maximum straw yield (6387 kg per ha) was obtained from 61.5:69 kg NP per ha and minimum straw yield (4356 kg per ha) was recorded from no NP fertilizer applied plot. The result indicated that increasing NP fertilizer application rate from 0:0 to 61.5:69 kg per ha, significantly increased straw yield by about 48%. But straw yield recorded in response to combined NP fertilizer application of 0:0 with 20.5:23 and 41:46 kg NP per ha with 82:92 kg NP per ha were statistically on par (Table 5).
The increase in straw yield in response to increasing NP supply to the plant may be due to the N and P effect on root growth, leaf area, number of leaves per plant and vegetative growth. The plant is growing well and vigour canopy may lead to enhanced photosynthesis and growth (Verma et al., 2017). Rahman et al. (2008) also observed significantly increased mung bean Stover yield over control and lower level of P application. yield (4356 kg per ha) was recorded from no NP fertilizer applied plot. The result indicated that increasing NP fertilizer application rate from 0:0 to 61.5:69 kg per ha, significantly increased straw yield by about 48%. But straw yield recorded in response to combined NP fertilizer application of 0:0 with 20.5:23 and 41:46 kg NP per ha with 82:92 kg NP per ha were statistically on par (Table 5).
The increase in straw yield in response to increasing NP supply to the plant may be due to the N and P effect on root growth, leaf area, number of leaves per plant and vegetative growth. The plant is growing well and vigour canopy may lead to enhanced photosynthesis and growth (Verma et al., 2017). Rahman et al. (2008) also observed significantly increased mung bean Stover yield over control and lower level of P application.
Grain yield
Results of analysis of variance for grain yield were significantly (p < 0.05) affected by row spacing and NP fertilizer rates. However, the interaction effect of inter-row spacing with NP fertilizer rates was not significant for grain yield (Table 6).
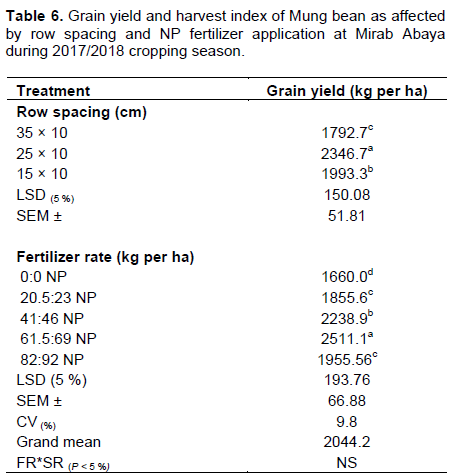
Mean grain yield ranged from 1792.67 to 2346.67 kg per ha due to inter-row spacing where maximum grain yield attained at mung bean planted in the inter-row spacing of 25 × 10 cm and minimum grain yield recorded from 35 × 10 cm. This result showed that increased grain yield when narrowing inter-row spacing from 35 × 10 cm to 25 × 10 cm by 31% but further reducing inter-row spacing from 25 × 10 to 15 × 10 cm, resulted in a decrease in grain yield by about 15%. Maximum grain yield attained at 25 × 10 cm suggested optimum inter-row spacing for mung bean production around Mirab Abaya and similar agro-ecologies and the effect of overpopulation on the competition for mineral nutrients and light.
The finding on grain yield was related to the results of growth and yield components presented in this study. The maximum mung bean grain yield at an inter-row spacing of 25 × 10 cm had been associated with high plant height, more number of flowers per plant, the high number of pods per plant, biological yield and straw yield attained. In agreement with this result, Dainavizadeh and Mehranzadeh (2013) documented the effect of high population on grain yield where maximum grain yield (3120 kg per ha) attained at moderate planting density (seed rate of 20 kg per ha) and reduced yield due to over-application.
Mondal et al. (2012) also reported that grain yield decreased with further increasing planting density from optimum level. Ram et al. (2018) and Ajio et al. (2016) observed increased grain yield with increasing seed rate up to certain levels (20-45 kg per ha, depending on seed size) and decrease due to over-application of seed rates per hectare on mung bean. Mean grain yield ranged from 1660.0 to 2511.1 kg per ha due to NP fertilizer application where maximum grain yield was attained by applying NP rates of 61.5:69 kg per ha and significantly (p < 0.05) different to all other treatments. The minimum was recorded from the no fertilizer applied plot. The result indicated that NP fertilizer application resulted in 12, 35, 51 and 17% grain yield advantage for each rate increase over no fertilizer applied plot suggesting mung bean nutrient requirement. But a further increase in NP fertilizer application from 61.5:69 to 82:92 kg per ha resulted in a decrease in grain yield by about 22%.
Response of grain yield towards NP fertilizer application showed progressive increment up to NP fertilizer rate of 61.5:69 kg per ha and when application above reduces grain yield. The result suggested the amount of NP fertilizer rate for economical production and low of minimum for mung bean production.
The maximum mung bean grain yield at NP fertilizer application rate of 61.5:69 kg per ha associated with high plant height, number of root nodules per plant, number of grains per pod, 100 seed weight and biological yield attained in the present study (Tables 1 to 4). This result was in line with the findings of Sadeghipour et al. (2010) who reported a significant effect of NP fertilizer rates where maximum grain yield (2240 kg per ha) was attained from 90:120 kg per ha. Furthermore, Chattha et al. (2017) also stated that grain yield per ha significantly increased with NP fertilizer application.
Ali et al. (2010) and Hossen et al. (2015) also reported a significant effect of P and N application on grain yield where maximum result attained at the rate of 84 kg P per ha, 120 kg P per ha and 45 kg N, 60 kg N per ha, respectively. Increasing trend of grain yield in response to nitrogen application in low fertile soil up to 60 kg N per ha, thereafter decrease in grain yield also reported by Razzaque et al. (2015).
Cost-benefit analysis
The cost-benefit of mung bean production at Mirab Abaya during the 2017/2018 cropping season computed with partial budget as suggested by CIMMYT (1988) is presented in Table 7. The interaction of inter-row spacing (seeding rate) and NP fertilizer rate was not significant for grain yield and hence partial budget analysis was carried out for each factor separately. The partial budget analysis for NP fertilizer application showed that the highest net benefit (birr 53745.75) was obtained from NP fertilizer rate of 61.5:69 NP kg per ha followed by net benefit (birr 48540.025) obtained from NP fertilizer rate of 41:46 NP kg per ha. Whereas the lowest net benefit (birr 37350) was obtained from no fertilizer applied plots.
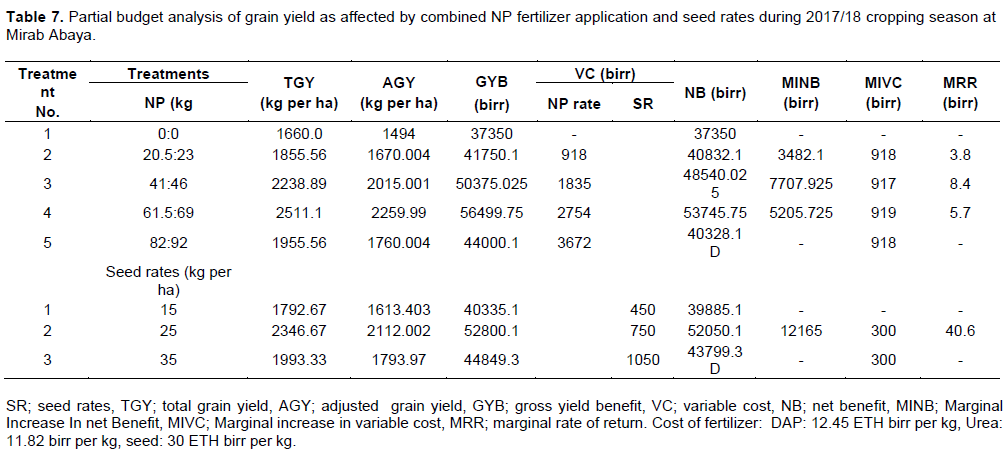
The highest MRR (8.4 birr) was obtained from the NP fertilizer rate of 41:46 NP kg per ha. The lowest MRR (3.8 birr) was recorded from 20.5:23 NP kg per ha. Based on this Partial budget analysis to get the maximum net benefit of (birr 53745.75) application of 61.5:69 NP kg per ha was found to be economical. But, to get the highest MRR it was advisable to apply the NP rate at 41:46 NP kg per ha for this specific area. Partial budget analysis of applied seed rate (row spacing) showed maximum net benefit (birr 52050.1) and MRR (birr 40.55) attained at 25 kg seed rate per ha (25 × 10 cm row spacing) (Table 7).
CONCLUSION
The results of analysis of field experiment data showed economically high growth, yield and yield components of mung bean attained at the application of combined NP fertilizer rate of 61.5:69 kg per ha and inter-row spacing of 25 × 10 cm under the agro-ecological condition of Mirab Abaya Gamo Gofa South Ethiopia.
CONFLICT OF INTERESTS
The authors have not declared any conflict of interests.
REFERENCES
|
Achakzai AKK, Rajpar H, Shah BH, Wahid MA (2012). Effect of Nitrogen fertilizer on the growth of Mung bean [Vigna Radiata (L.) Wilczek] grown in Quetta. Pakistan Journal of Botany 44(3):981-987. |
|
|
Ahmadi A (2016). Response of Mung bean (Vigna radiata) to different levels of density and weed management in Florestan province. Global Advanced Research Journal of Agricultural Science 5(10):383-390. |
|
|
Ahmed ZI, Ansar M, Saleem A, Arif Z, Javed HI, Saleem R (2012). Improvement of mash bean production under rainfed conditions by rhizobium inoculation and low rates of starter nitrogen. Pakistan Journal Agriculture Research 25(2):154-160. |
|
|
Ajio F, Talwana H, Kagoda F (2016). Evaluation of Mung bean plant spacing for optimizing yield in smallholder cropping systems. RUFORUM Working Document Series (ISSN 1607-9345) 14(2):403- 406. |
|
|
Ali MA, Abbas G, Mohy-ud-Din Q, Abbas G, Ullah K, Aslam M (2010). Response of Mung bean (Vigna radiata) to Phosphatic fertilizer under arid climate. The Journal of Animal and Plant Sciences 20(2):83-86. |
|
|
Anetor MO, Akinrinde EA (2006). Differences in the liming potential of some fertilizer materials in a Tropical Acid Alfisol. Journals of Applied Science 6:1686-1691. |
|
|
Ayub M, Tanveer A, Adil CM, Amin MMZ, Murtaza G (1999). Growth and yield response of Mung bean (Vigna Radiata L.) cultivars to varying levels of Nitrogen. Pakistan Journal of Biological Sciences 2(4):1378-1380. |
|
|
Chadha ML (2010). Short duration Mung bean: A New Success in South Asia. Asia-Pacific Association of Agricultural Research Institutions. |
|
|
Chattha MU, Hassan MU, Khan I, Chattha MB, Ashraf I, Ishque W, Farooq MU, Usman M, Kharal M (2017). Effect of Different Nitrogen and Phosphorus fertilizer levels in combination with Nitrogen and Phosphorus solubilizing inoculants on the growth and yield of Mung bean. Pakistan Journal of Life and Social Sciences 15(1):31-36. |
|
|
Chauhan YS, Williams R (2018). Physiological and agronomic strategies to increase Mung bean yield climatically variable environments of Northern Australia. Australia Journal of Agronomy 8(83):1-20. |
|
|
Dainavizadeh P, Mehranzadeh M (2013). Effect of seed rate on growth, yield components and yield of Mung bean grown under irrigated conditions in the North of Khuzestan. International Journal of Agriculture and Crop Sciences 5(20):2359-2364. |
|
|
Degefa I (2016). General characteristics and genetic improvement status of Mung bean (Vigna radiata L.) in Ethiopia. International Journal of Agriculture Innovations and Research 5(2):232-237. |
|
|
Hossen MdM, Hussain ASMI, Al-Zabir A, Biswas MdHJ, Islam MdR (2015). Effect of Nitrogenous fertilizer on yield of Mung bean [Vigna radiata (L.) Wilczek] in Patuakhali district of Bangladesh. Asian Journal of Medical and Biological Research 1(3):508-517. |
|
|
Hussain A, Ali A, Khaliq T, Ahmad A, Aslam Z, Asif M (2014). Growth, nodulation and yield components of Mung bean (Vigna Radiate) as affected by Phosphorous in combination with Rhizobium inoculation. African Journal of Agricultural Research 9(30):2319-2323. |
|
|
Ihsanullah T, Fazal H, Akbar H, Basir A, Ullah N ( 2002). Effect of row spacing on agronomic traits and yield of Mung bean (Vigna Radiata L. Wilczek). Asian Journal of Plant Sciences 1(4):328-329. |
|
|
Imran K, Asad A, Inam I, Ahmad F (2016). Yield and yield attributes of Mung bean (Vigna radiata L.) cultivars as affected by Phosphorous levels under different tillage systems. Cogent Food and Agriculture Journal 2(1):1-10. |
|
|
International Maize and Wheat Improvement Centre CIMMYT (1988). From agronomic data to Farmer recommendations an Economics training manual. Completely revised edition. Mexico. D.F. |
|
|
Jan A, Kaleem SA, Taj FH, Khan H (2000). Response of Mung bean cultivars to different seeding densities at dryland conditions. Pakistan Journal of Biological Sciences 3 (12):2030-2032. |
|
|
Khan EA, Aslam M, Ahmad HK, Himayatullah K, Muhammad A, Hussain A (2010). Effect of row spacing and seeding rates on growth, yield and yield component of Chickpea. Sarhad Journal of Agriculture 26 (2):202-211. |
|
|
Khan M (2014). Nitrogen & Phosphorus Management in Mung bean and Sunflower intercropping. PhD Dissertation. Department of Agronomy. The University of Agriculture, Peshawar, Pakistan. |
|
|
Khan MA, Baloch MS, Taj I, Gandapur I (1999). Effect of Phosphorous on the growth and yield of Mung bean. Pakistan Journal of Biological Sciences 2(3):667-669. |
|
|
Khan SMMd, Singh VP, Kumar A (2017). Studies on effect of Phosphorous levels on growth and yield of Kharif Mung bean (Vigna Radiata L. Wilczek). International Journal of Pure Applied Bioscience, 5 (4): 800-808. |
|
|
Kumar N (2007). Role of Balanced Fertilization for Horticultural Crops. Training manual on role of balanced fertilization for horticultural crops. Horticultural College and Research Institute Tamil Nadu Agricultural University. |
|
|
Kumar R, Singh YV, Singh S, Latare AM, Mishra PK, Supriya (2012). Effect of phosphorus and Sulphur nutrition on yield attributes, yield of Mung bean (Vigna radiata L. Wilczek). Journal of Chemical and Pharmaceutical Research 4(5):2571-2573. |
|
|
Laekemariam F, Worku W (2013). Growth, light interception, radiation use efficiency and productivity of Mung bean [Vigna radiata (l.) Wilczek] (Fabaceae) cultivars as influenced by sowing date. Ethiopia Journal of Biological Science 12(2):117-133. |
|
|
Mohammed A, Muhammed S, Said M (2017). Marketing Practices and Challenges of Mung bean in Ethiopia Amhara Regional State North Shewa Zone. African Journal of Marketing Management 9(4):35-45. |
|
|
Mojaddam M, Aramideh S, Derogar N, Marashi SK (2014). The interactive effect of different level of Nitrogen and drought stress on yield and yield components of Mung bean. International Journal of Bioscience 5(8):47-53. |
|
|
Mondal MMA, Puteh AB, Malek MA, Ismai MR (2012). Determination of optimum seed rate for Mung bean based on Morpho-Physiological criteria. Indian Journals of Legume Research 35(2):126 -131. |
|
|
Moore N, Serafin L, Jenkins L (2014). Summer Crop Production Guide. NSW DPI, NSW Department of Primary Industries. |
|
|
Rahman MM, Bhuiyan MMH, Sutrandhar GNC, Rahaman MM, Paul AK (2008). Effect of Phosphorus, Molybdenum and Rhizobium inoculation on yield and yield attributes of Mung bean. International Journal of Sustain Crop Production 3(6):26-33. |
|
|
Razzaque MA, Haque MM, Karim MA, Solaiman ARM, Rahman MM (2015). Effect of Nitrogen on different genotypes of Mung bean as affected by Nitrogen level in low fertile soil. Bangladesh Journal of Agriculture Research 40(4):619-628. |
|
|
Sadeghipour O, Monem R, Tajali AA (2010). Production of Mung bean (Vigna Radiate L.) as affected by Nitrogen and Phosphorus Fertilizer. Asian Journal of Applied Sciences 10(10):843-847. |
|
|
Sekhon HS, Singh G, Star JS, Shanmugasundaram, Bains TS, Kooner BS(2004). Technology package for Mung bean cultivation manual in Punjab (India). |
|
|
Taufiq A, Kristiono A (2016). Effect of Plant population on character expression of five Mung bean genotypes under different Soil fertility. Agrivita Journal of Agricultural Science 38(3): 251-260. |
|
|
Verma G, Singh M, Morya J, Kumawat N (2017). Effect of NP and Bio fertilizers on growth attributes and yields of Mung bean [Vigna radiata (L.) Wilczek] under semi-arid tract of Central India. International Archive of Applied Sciences and Technology 8(2):31-34. |
|
|
Zirak M, Ganjali HR, Mehraban A (2015). Effect of row distance and variety on number of branch per plant, plant height, harvest index and seed yield in Mung bean. Biological Forum - An International Journal 7(2):719-721. |
|
Copyright © 2024 Author(s) retain the copyright of this article.
This article is published under the terms of the Creative Commons Attribution License 4.0


