Full Length Research Paper

ABSTRACT
The scope of this paper is to explore the relationship between tourism development and carbon emission in Maldives. Data used are already published data for Maldives tourism development and carbon emission. Individual Model for tourism development indicators and combined model of all the indicators were used to test the relationship. Unit root test was used to test the stationary status of the data. Empirical tests were performed using Ordinary Least square Method. Unit root results suggest that data are stationary at first differentiation. Regression results show very significant positive correlation between tourism development indicators and carbon emission. The relationship between carbon emission and tourism development shows very directional positive relationship. The results suggest growth of tourism and development of the industry is one major factor driving the carbon emission in Maldives. To reduce the carbon emission to achieve the goal of becoming the first carbon natural country, government could encourage opening of guest houses with more simulative rules by increasing the number of beds without increasing the number of resorts, increasing number of international airports, limiting domestic transfers and developing tourist sites to increase the output of the industry.
Key words: Tourism development, carbon emission, Maldives.
INTRODUCTION
Maldives is an ocean archipelago consisting of 1192 islands in the Indian Ocean. The country is famous for its coral reefs, sandy beaches and luxury resorts. The population of Maldives is estimated to be 336,220 people living in 190 islands (DNP, Maldives at a glance - July, 2013). The Maldives has more territorial sea than land. Marine resources have played a vital role in shaping the contours of economic development with nature-based tourism and fishing being the main drivers of economic growth.
Travel and tourism has have become the powerhouse of the most of the low-lying countries across the globe in the past few decades. Unexploited natural beauty of small nations opened opportunities for economic growth and development. The world tourism growth from 25 million to 1 billion in 60 years has proven tourism hasbecome an important tool for development in many partsof the world. Like any other industry tourism is a “business transaction, a commodity for sale in the world market” (Maximiliano et al., 2012). Production of all the goods and provision of all services have its costs, economic cost, social cost as well as environmental cost.
Fishing was the blood line of the economy prior to introducing tourism in 1972. When Maldives tourism industry started in 1972 with few resorts, people were not aware of the environmental consequences associated with the tourism industry. People still believe that tourism industry is emission free or less emission industry (Salah and John, 2005) because tourism industry is mainly service oriented industry.
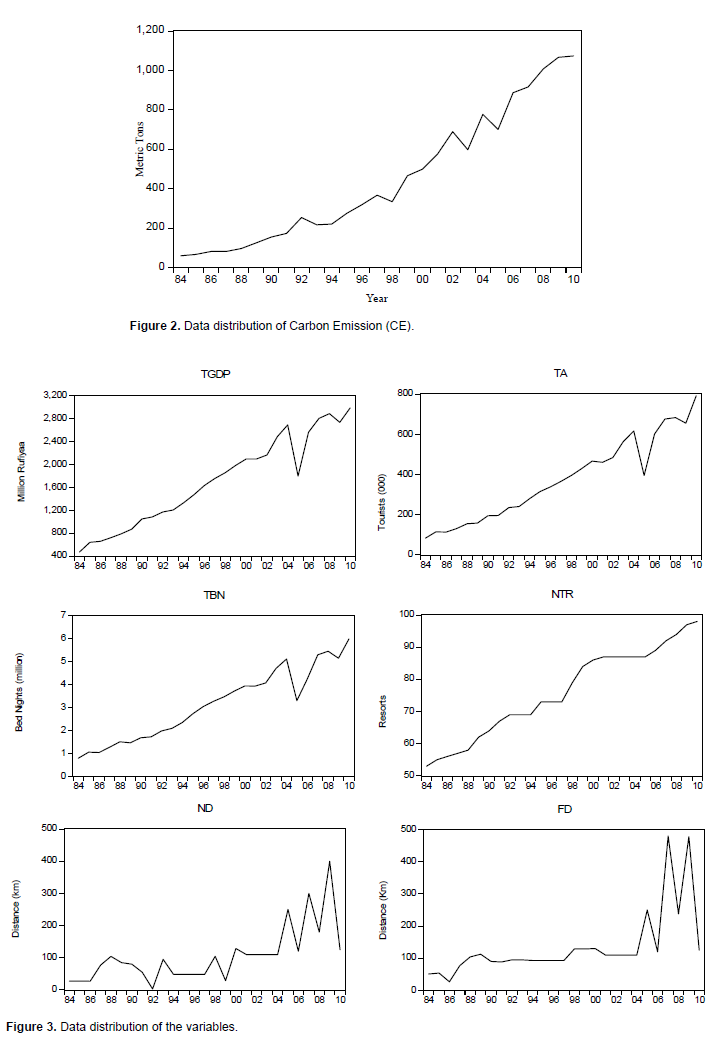
Maldives tourism industry accounted for nearly one fourth of the total CO2 emission (Flora et al., 2010). The total output of the primary, secondary and tertiary sector in 1981 was 312.1, 206.5 and 1159.7 million Rufiyaa respectively. The total Carbon Emission reported for 1981 was 58 matric ton. After 10 years, the reported amount of Carbon Emission increased more than double fold. The growth of Primary and Secondary sectors was slower than that of Tertiary sector. Year before Tsunami hit Asian countries including Maldives, the total emission increased more than five fold than that of 1981. The only industry that grew as fast as the growth of the Carbon Emission was Tertiary sector. All the available information for economic development and carbon emissionshow that carbon emission and tourism development increases in parelel to each other. Lots of researches have been carried out and the broader consession has been made on the positive relationship between economic develop-ment and environmental degradation. Most of these reserch data are from industrial countries. Very less researches have been done using data from small-countries which rely on service based economies. Maldives is chosen for this study because Maldives is one of the smallest fast developing nation driven by its tourism industry in the past few decades.
The main scope of this paper is to analyze the relationship between tourism development and carbon emission in Maldives. Maldives economy started growing at rapid rate with the introduction of tourism in 1972. Over the past 30 years Maldives economy was developing at the rate of 8% per year. Available statistics shows more than one third of the GDP comes from tourism industry. At the same time, carbon emission data for the Maldives also show rapid increase in carbon emission year by year.
LITERATURE AND HYPOTHESIS
Tourism industry across the globe has developed at a very fast rate in the last few decades. The economic activities involved in the industry are numerous. Resent forcast shows that tourism will enjoy an everage growth of 3.8% per year between 2012 and 2020 (UNWTO, 2013). United Natioans World Tourism Organization has observed that tourism is a significant contributor to climate change and global warming. (Bob et al., 2009). A substatial volume of research has identified tourism as a major source of greenhouse gas emissions, primarily (but not exclusively) from air transport. On the other hand, tourism industry is one of the victims of the global climate change. It is estimated that tourism contributes 5% of the total Carbon Dioxide [CO2] emission and up to 14% of all emission when other greenhouse gase are considered (Scott et al., 2008).
The impact of tourism has been reasonably well researched, particularly from the environmental and economic prospective. However empirical support to show the relationship between the two variables is mainly based either on direct observation of the data or on some parallel based analysis. Such approaches are clearly insufficient to classify the nature of the underlying linkage between carbon emission and tourism development (Zaman et al., 2011).The goal of this study is to use data from a small developing country to study the relationship of carbon emission and economic development and empirically explore the relationship.
Despite the fast increasing carbon emission and environmental degradation, very few studies have been done in Maldives to see the nature of the economic development and carbon emission. One of the researches we published shows positive correlation between economic growth and carbon emission (Ahmed and Laijun, 2012). In that research we found economic growth and carbon emission for Maldives follows Kuznets Curve. Hence there is need to analyze tourism growth and carbon emission to explore their relationships in the Maldives. This will help the policy makers to take timely actions to achieve national goal to achieve world’s first nation to become carbon natural.
Environment is one of the most researched and written subject in the twenty first century. Due to the extensive attention given to the environment and global worming warming,primary, secondary and even tertiary sectors ofeconomy were studied by lots of researchers to understand the relationship between economic development and environmental degradation. In many small developing nations travel and tourism or service is the only major industry. As tourism was treated as a discipline of management in the social science, tourism was mainly researched and studied in relation to business management. Till the end of last century tourism researches were dominated by the tourism management, tourism development and other tourism related issues.
Maldives was very unaware of its carbon emission for very long time. On the other hand Maldives was always concerned about environmental problems, especially island erosion problem faced by lots of its islands. Tourism industry was always considered as clean industry in Maldives. Environmental side of the tourism that was given significant important was protecting ecology of the resorts. Even though carbon emission was not addressed separately in tourism related rules and regulation, protecting environment and biosphere of the country was included in tourism related rules and regulations.
According to the Maldives Carbon Audit, the major environmental pollution of Maldives is the emission of carbon dioxide (Flora et al., 2010)Maldives uses diesel as the main and only fuel to produce energy that is required for the nation.Diesel fuel is burned in almost all the industry including tourism industry.
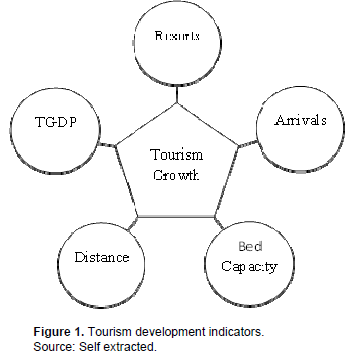
Before developing the hypothesis the indicators that show the rapid growth of the tourism industry in Maldives were studied. From the information published by Maldives government, there are five indicators that show the growth of the tourism industry. They are 1) Number of tourist resorts, 2) Tourist Arrival, 3) Tourism GDP, 4) Bed Capacity and 5) Tourist Resort Distance. These indicators are chosen because they are the only indicators of tourism development for which data were available. Tourism income is very important indicator to analyze the carbon emission and tourism growth, but data for this variable are very less to use statistical methods to get significant result.These 5 indicators are illustrated in Figure 1.
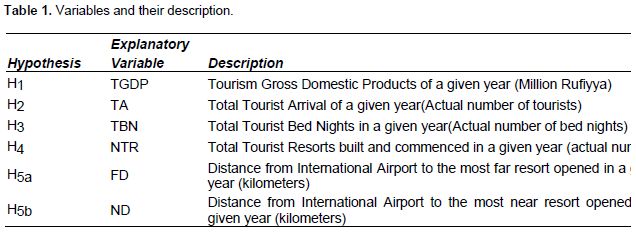
From the trend of the data sets for tourism development indicators and carbon emission, it is assumed to have positive relationship between variables. Data distribution graphs of variables and carbon emission used in the statistical tests are shown in Figures 2 and 3 respectively. The main hypothesis of the study is that carbon emission and tourism development are positively correlated. Two step approach was used to test the main hypotheses. First step was to explore the individual relationship of the variables to the carbon emission. Separate sub-hypothesis was drawn for each indicator. In the second step, combined relationship of the variables to carbon emission was tested.
Growth in Tourism Gross Domestic Product (TGDP)
Tourism Gross Domestic Product (TGDP) of the tourism industry is the main indicator of the growth of the tourism industry as well as the overall development of the industry. As we have highlighted before, tourism industry contributesnearly one third of the total GDP of the Maldives(MMA, Monthly Statistics 2014, 2014). First sub hypothesis of this study is that TGDP and carbon emission are positively correlated. Carbon emission increases positively the growth of TGDP.A very high significant level of correlation coefficient was expected with positive sign.
Tourist arrivals
Tourist Arrivals (TA) to Maldives have been increasing yearly. In recent years Maldives has been receiving tourist more than its population. In 2013 Maldives has received 1 million tourists achieving the tourism target for 2103 (MMA, Monthly Statistics 2014, 2014). Increase in tourist arrivals increases the overall economic activities vertically and horizontally. This increase in economic activities must increase carbon emission. Therefore second sub-hypothesis was generated as given below. Very significant correlation between these two variables was expected in the test results.
Tourist bed nights
Tourist Bed Nights (TBN) is the number of nights each tourist stayed in Maldives. TBN is always higher than the number of arrivals. Records show in average a tourist spends minimum seven nights and maximum 9 nights in Maldives. When tourists stay in one place it will reduce the commute of the tourists (Scott, et al., 2008). Even though TBNs are higher than the TA, it was assumed that increase in bed nights will not increase the carbon emission at the same rate of Tourist Arrival. But one cannot assume that it will have weaker relationship with the Carbon Emission. The relationship strength might be weaker than that of tourist arrival. Third sub-hypothesis of this paper was drawn based on this assumption.
Number of tourist resorts
Another main visible indicator of tourism development is the increase in the number of Tourist Resorts (TR). Maldives uses very unique model of tourism. This unique model is developed from the unique geographical structure of the Maldives. The island nation of Maldives consists of more than 1100 small islands. Out of that only 200 islands are officially inhabited. Maldives uses uninhabited islands to develop tourist resorts. “One-island One-resort” model was created to give visitors complete privacy and protect general public from any bad influence of the industry.
Over the past three decades nearly 95 resorts were built and in operation. Building more resorts will increase tourist arrivals, tourist bed capacity and will multiply the economic activities. Hence this paper tested below sub-hypothesis as well.
Distance of resorts from airport
Until very recent, Maldives had only one international airport. Most of the tourist arrivals to the country from abroadarevia this one international airport. The special geographical characteristics of the Maldives reduce the land transport within the islands. Tourists arriving Male’ international airport are taken to their holiday destination by speed boats or sea planes. To reduce transfer times, lots of resorts were built near the international airport in the first decades of the tourism industry. Any literature to prove that distance from the airport is an indicator of the development of the tourism industry was not found. Study of Scott et al. (2008)suggest that long travel will increase amount of carbon emission.
When tourist resorts are located far away from the international airport more fuel is consumedin transferring tourists to their destinations. In recent years tourism has reached far north and far south of the country.When the resorts are built far from the airport, it will add more to the increase in carbon emission and when resorts are built near the airport, it will add less to the increase in carbon emission. To test this assumption two data sets were used: A- Most far distance (FD) of the resort built in a given year. B- Most near distance (ND) of the resort built in agiven year. Two hypothesis based on our assumption are as follow.
Combined relationship
All the tourism development indicators studied are inter-related to each other to some extent. Increase in number of resorts may not increase the number of tourist arrival to the country. Naturally, tourist arrival increases the tourist bed nights. Tourist arrival also would drive the market to set up more resorts. From Figure 2, data distribution for resort distance ND and FD, it is understood that till 2004 most of the resorts are built in very near location from International Airport. Tourism was spread to the far south and far north in the last 10 years resulting in increase in the number of resorts built far away from International Airport, but still closer to domestic airports. To test their combined relationship with carbon emission, statistical model (7) in Table 2 was used.
VARIABLES, DATA COLLECTION AND ESTIMATION METHODS
Data collection
It was challenging to collect data for carbon emission as well as data for tourism development indicators. Tourism being the most important industry of the economy, government has either not kept clear records of the data or not published the recoded data. This study uses annual observations for the period starting from 1972 to 2010. Observation period for each statistical model is given in Table 2.
Carbon emission data used in this study are taken from the data published by the World Bank (The World Bank, 2014). Tourism development data were taken from the data published by the Department of National Planning (DNP, Publications, 2014). Most of the data were extracted from “25 years of statistics” published online by the Department of National Planning in 2005 (DNP, The 25 Years of Statistics, 2005). This data collection includes data from 1979 to 2004.
Data for 2005 to 2010 were reconciled from year statistical year books of 2005 to 2012. Tourism year book of 2013(Ministry of Tourism, Arts and Culture, 2013) was used to extract the data for resort’s distance from the Male’ International Airport. Tourism year book was also used to reconcile and cross check the data for other indicators as well.
Variables
Two variables, Independent Variable and Explanatory variable were used to model the non-linear model. According to the Maldives Carbon Audit, the major environmental pollution of Maldives is emission of carbon dioxide (Flora et al., 2010). Maldives uses diesel as main fuel to produce energy that is required for the nation and diesel fuel is burned in the transport industry as well. Carbon emission is used as independent variable in all non-linear to test the hypothesis. Carbon Emission data were used in studies like that of Moomaw and Unruh (1997) and Friedl and Getzner (2003).
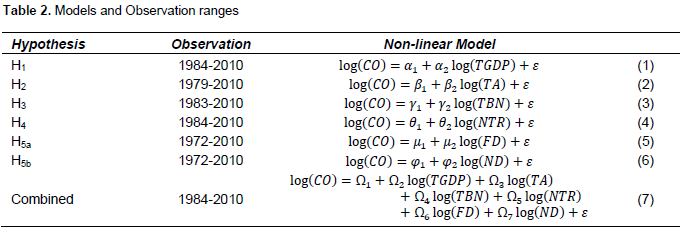
The main focus of this study is to examine the relationship of tourism development and carbon emission. Tourism development indicators were used to represent the development of the tourism industry. Zaman et al. (2011) also used tourism development indicators in their study to represent the development of the tourism. Explanatory variables are the tourism development indicators discussed in this paper. Table 1 shows the details of the explanatory variable used in testing each hypothesis.
To examine the relationship between tourism development and carbon emission, non-linear model for each hypothesis was constructed. Table 2 shows the non-linear models estimated for each hypothesis. All the variables seen in Table 1 were expected to have positive contribution to increase carbon emission.
Estimation methods
Time series properties of the variables were examined before conducting the empirical study. Non-stationary time series data has often been regarded as a problem in empirical analysis. Working with non-stationary variables leads to spurious regression results from which further inference is meaningless when these variables are estimated in their original form. In order to overcome this problem there is a need for testing the stationary of these variables. The unit root tests on all the variables are to determine time series characteristics. Unit root test is important as it shows the number of time the variables have to be differentiated to clear the unit roots and make the data stationary. In general variables which are stationary are called I (0) series. Those data which need to be differenced once in order to obtain stationary are called I (1) series. In testing for stationary, the standard Augmented Dickey-Fuller (Dickey and Fuller, 1979)test (ADF) was performed to test whether or not unit root in the data was used to establish the properties of individual series. The regression is estimated by equation (8) as follows:

Where delta is the difference operator, Y is the series being tested; K is the number of lagged differences and is the error term. The null hypothesis is that series has a unit root and the alternative hypothesis is that it is stationary. The number of augmentation terms for the ADF tests wasdetermined by using the Schwarz information criterion(Schwarz, 1978).
The data set of the explanatory variable, Carbon Emission (CO) has four different data observation range. Data ranges of the models were given in second column of the Table 2. We have performed unit root tests for each observation range separately to avoid general conclusion from one observation range. After performing Unit Root tests, correlation tests were performed using the models1 to 7 in Table 2. Ordinary Least Square method was used to carry out the correlation tests.
STATISTICAL TEST RESULTS
Discussion of the results was divided into two sections. At first results of the unit root tests performed to analyze the stationary situation of the data were discussed. Results of the non-linear models followed after that.
Unit root tests
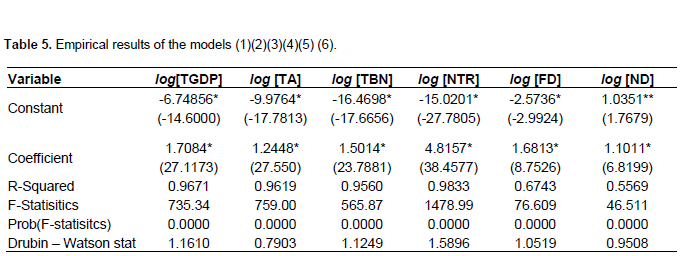
Economic time-series data are often found to be non-stationary; data might contain unit root in the series. Estimates of the Ordinary Square method are more efficient and significant when variables included in the model are stationary in the same order. Hence we tested all variables for unit root using Augmented Dickey-Fuller (ADF) test and Phillips-Perron (PP) test(Phillips-Perron, 1988).
ADF unit root test shows all the variables are non-stationary at level. Time series data for TBN and TGDP at level in intercept criteria show very significant level of stationary. Results of the ADF tests are given in Table 3. Unit root test of PP results shows time series data of CO from 1994-2010 is significant at level in Trend and Intercept criteria. Data series for variable TGDP and ND also shows very significant stationary status at level in Trend and Intercept criteria. Unit root test results of PP tests are given in Table 4.
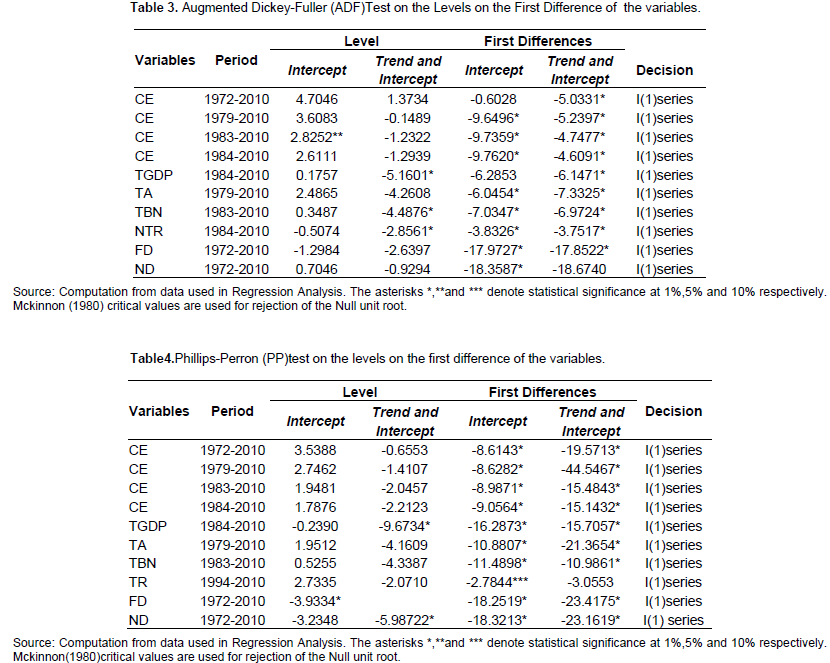
ADF test and PP test shows all the variables are stationary at first difference. The results are very significant at critical level of 1%. These results suggest that these variables are integrated into order I(1); series which are non-stationary at level but stationary at first difference.
Correlation tests
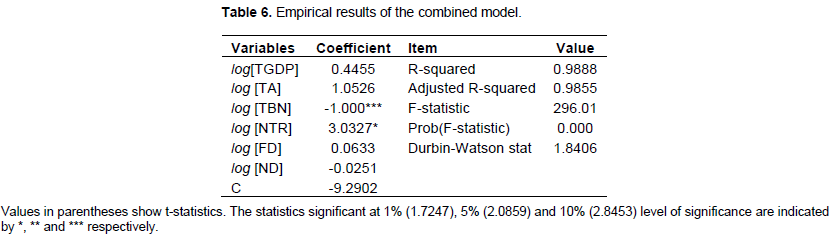
Each hypothesis was tested using Ordinary Least Square method for correlation between variables. Test result for model (1) shows very high correlation between variables. R2 for correlation between TGDP and CO is 0.96. The t-statistics shows the relationship is significant at 1% critical level. Probability of F-statics is 0 while Durbin-Watson statistics is 1.61. Coefficient of the dependent variable is positive and constant value is negative. Results of this test are shown in Table 5.
Relationship between TA and CO in model (2) is very significant with positive coefficient of the dependent variable TA. Correlation between two variables is 0.96 while probability of F-statistics is zero. The model seems not very fit to explain the relation with Durbin-Watsan statistics of 0.79. On the other hand t-statistics falls within 1% critical value describing the correlation is very significant and model parameters can be used for estimations. These results are given inTable 5.
As expected the correlation between TBN and CO is slightly lower than the TA. Test result of the model used to test the relationship between TBN and CO indicates that these two variables have very significant correlation.
Adjusted R-squared of the model is 0.95 with zero Probability of F-statistics. Durbin-Watson statistics of 1.12 indicates model is quite fit to explain the dependent variable. Coefficient of the dependent variable is positive and the sign of the constant is negative. T-statistics guarantees the results are significant at 1% critical level. Table 5 shows the results of TBN and CO correlation test.
Observation data from 1984 to 2010for relationship between number of tourist resorts (NT) and carbon emission show highly correlated direct relationship. Correlation coefficient of 0.98 is much expected result with positive coefficient; even though with negative constant probability of F-statistics is favorably zero. Critical value indicates that the results are significant at 1% critical level. Durbin-Watson statistics shown in Table 5 suggests that model is significantly fit to describe the dependent variable.
Results in Table 5 are the test results of last two hypotheses. Test results relationship between carbon emission and building resorts near to the airport indicate that relationship is not very significant. In Table 5, the adjusted R-squared for model (5) is 0.54 with positive coefficient of independent variable. Durbin-Watson statistics of 0.95 suggest that model is not very good to explain the dependent variable. Over all, the results are significant at 1% level.
On the other hand, the relationship between carbon emission and building resorts away from the airport shows much stronger correlation. The correlation co-efficient of the model is 0.67 while the model shows very good Durbin-Watson statistics. As given in Table 5, the coefficient of the independent variable is positive while the sign of the constant is negative. Results show the estimators are significant at 1% critical level and model is fit to explain dependent variable.
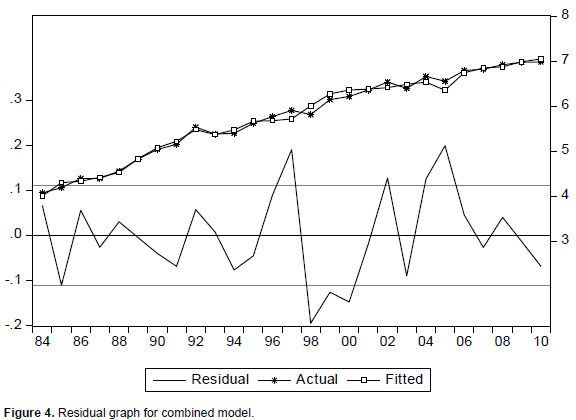
Result of the combined model is given in Table 6. Combined model shows very high correlation between carbon emission and tourism development indicators. Relationship coefficient of 0.98 indicates all the variables together can absolutely explain the carbon emission. F-statistics and Durbin-Watson statistics conclude the model is fit to predict the dependent variable. Tourism Bed Nights and Number of Tourist Resorts are only indicators that are significant to explain the carbon emission. Other indicators are not statistically significant to explain the carbon emission. Residuals show all the indicators can estimate the carbon emission jointly. Residual graph is given in Figure 4.
DISCUSSION OF RESULTS AND SUGGESTIONS
Our finding reveals that tourism development does enormously contribute to the increase in carbon dioxide. Tourism development indicators are the main key to increase emission in Maldives. High growth rate of the tourism industry in the last three decades not only increased the national receipts but also increased the emission of carbon dioxide and contributed lot to degradation of the fragile nature of the country.
Empirical tests results are very alarming to Maldives. The relationship between tourism development and carbon emission is positively correlated. Even though this result is not a surprise but the correlation of both variable confirms the general understandingof the hypothesis with statistical proof. Six indicators used for the development of the tourism also indicatethe relationships of these two variables are significantly correlated. The degree of the correlation differs in each model tested.
Maldives government targets a goal to receive certain amounts of tourism each year. In 2013, the goal was to receive 1 million tourists. The government has achieved this target. The test result shows the carbon emission will increase with an increasing in tourist arrivals. Our results suggest targeting to receive more and more tourists does not add much benefit to the economy, but it does increase environmental pollution across the nation. This result suggests government could increase more tourism related activities through stimulation packages to private sectors. Increase in tourism products will increase the tourism output without increasing the number of receiving tourists.
On the other hand, test results show that if any given tourist spends more time in the country the emission of the carbon dioxide is comparatively less. The relationship between tourist bed nights and carbon emission shows slight weaker relationship than that of the number of tourist arrivals. Almost for the last two decades the average tourist spends average 7 to 8 nights in Maldives. Maldives could reduce its carbon emission by increasing tourist bed nights and reducing number of tourist arrivals. This can be achieved by opening the tourism industry to convention tourism or medical tourism.
The positive relationship between increase in number of tourist resorts and carbon emission is very vivid. The test results confirm building more and more resorts would increase the carbon emission. Maldives government should reconsider the leasing of new islands for tourism development in the future. Government should generate new policies to increase the tourism capacity within the established resorts. Our hypothesis also proved that government should make policies to establish more tourist capacity closer to the international airport. Our finding reveals that when the tourist resorts are established near the international airport, the emission can be reduced. The best solution to this is establishing guest houses near the International airports. Guest house would provide accommodation for low income individual travelers and could limit the transfers to far destinations.
All six indicators show very positive correlation. Degree of correlation strength can be used as a reference to develop the particular indicator. For instant, results indicate the highest degree of correlation is that of Number of Tourist Resort. Policy makers can put restriction on opening of new resorts.According to the correlation coefficient, this study strongly recommends the government to change the policies to allow more tourism capacity in the upcoming tourist resorts and increases tourist related activities to increase the tourist stay in the country.
The correlation figures can be used to understand the behavior of the tourism development indicators tested. Our results suggests that if Maldives relies heavily on the development of the tourism as the main source of developing the economy, then it has to pay a huge price for the increase in carbon emission and degradation of the environment.
CONCLUSION
The main objective of the study is to empirically test the relationship of the tourism development and carbon emission in Maldives using tourism development indicators. This study has used different data sets for different models due to unavailability of data for all indicators in a given period of time. Study used six hypotheses to formulate six empirical models to test the relationship. Empirical results strongly disprove the general understanding that tourism is a pollution free environment friendly industry. Results reveal very positive direct relationship between the tourism development indicators and carbon emission. Few indicators show weak correlation, but most of the indicators show significant correlation. This study confirms that tourism development indicators drive carbon emission. On the other hand, this study is insufficient to understand weather carbon emission drives tourism development. This conclusion opens new avenue for future research on causality relationship between tourism development and carbon emission in Maldives.
CONFLICT OF INTERESTS
The authors have not declared any conflict of interests.
REFERENCES
|
Ahmed A, Laijun Z (2012). Empirical Study on Relationship between Environmental Pollution and Economic Growth of Maldives Using Environmental Kuznets Curve and OLS Method. Int. J. Bus. Manage. 7(21):15-24. doi:http://dx.doi.org/10.5539/ijbm.v7n21p15. |
|
|
|
|
|
Bob M, Bruce P, Catherine C, Rob L. (2009). Achieving Voluntary reduction in the carbon footprint of tourism and climate change. J. Sustain. Tour. 297-317. doi:http://dx.doi.org/10.1080/09669580903395022 |
|
|
|
|
|
Dickey DA, Fuller WA (1979). Distribution of the estimators for Autoregressive Time Series with a Unit Root. J. Am. Stat. Assoc. doi:http://dx.doi.org/10.1080/01621459.1979.10482531 |
|
|
|
|
|
DNP (2005). The 25 Years of Statistics. Retrieved 03 17, 2013, from Department of National Planning. |
|
|
|
|
|
DNP (2013). Maldives at a glance - July.Male', Maldives. |
|
|
|
|
|
DNP (2014, March).Publications. Retrieved from Department of National Planning |
|
|
|
|
|
Flora B, Khelil TB, Pichon V, Tissot L (2010). Maldives Carbon Audit. Male': President's office of Rep of Maldives. |
|
|
|
|
|
Friedl B, Getzner M (2003). Determinants of CO2 emissions in a small open economy. Ecol. Econ. 45:133-148. doi:http://dx.doi.org/10.1016/s0921-8009(03)00008-9 |
|
|
|
|
|
Maximiliano E, Korstanje G, Babu G. (2012). Sustainable tourism and global warmin: pannacea, excuse or just and accidential connection? Worldwide Hosp. Tourism Themes pp.383-394. doi:http://dx.doi.org/10.1108/17554211211255710 |
|
|
|
|
|
Ministry of Tourism, Arts and Culture.(2013). Tourism Year Book 2013.Male', Maldives. |
|
|
|
|
|
MMA (2014, March). Monthly Statistics 2014. Male', Male', Maldives. |
|
|
|
|
|
MMA (2014, January).Monthly Statistics 2014.Male', Maldives. |
|
|
|
|
|
Moomaw W, Unruh G (1997). Are environmental Kuznets curves misleadingus? The case of CO2 emissions. Environ. Dev. Econ. 2:451–463. doi:http://dx.doi.org/10.1017/s1355770x97000247 |
|
|
|
|
|
Phillips-Perron (1988).Testing for Unit root in Time Series Regression. Biometrica 75:335-346. doi:http://dx.doi.org/10.2307/2336182 |
|
|
|
|
|
Salah W, John PJ (2005). Tourism Development and Growth: The Challange of sustainability. London: Taylor and Francis e-Library. |
|
|
|
|
|
Schwarz G (1978). Estimating Dimensions of a Model.Ann. Stat. pp. 461-464.doi:http://dx.doi.org/10.1214/aos/1176344136 |
|
|
|
|
|
Scott D, Amelung B, Becken S, Ceron J-P, Dubois G, Gossling S (2008). Climate change and tourism: Responding to global challenges. Madrid, Spain: UNWTO, UNEP, WMO. doi:http://dx.doi.org/10.1016/j.annals.2011.11.002 |
|
|
|
|
|
The World Bank (2014, March). Data, Maldives. Retrieved from The World Bank |
|
|
|
|
|
UNWTO (2013). World Tourism Barometer. |
|
|
|
|
|
Zaman K, Khan MM, AhmadM (2011). Relationship between Economic Freedom and Pro-poor Growth: Evidence from Pakistan (1995-2010). Rom. J. Fiscal Pol. 24-35. |
|
Copyright © 2024 Author(s) retain the copyright of this article.
This article is published under the terms of the Creative Commons Attribution License 4.0


