ABSTRACT
The purpose of this study is to provide an explanation of factors Affecting Agricultural Cooperatives Marketing Performance (In The Case Of Gedeb Hasasa District). In this study, descriptive statistics tools were used to give clear picture about the socio-demographic characteristics of respondents. To answer the research questions and measure the construct and predictors effects on Agricultural Cooperatives Marketing Performance (ACMP), both Exploratory Factor Analysis (EFA) and Confirmatory Factor Analysis (CFA) were used. EFA results showed that the Kaiser-Mayer Olkin of 0.90 and Bartlett test of 0.00 shows that factor analysis is appropriate. The principal component analysis extraction method was used to analyze the data with Promax Rotation Method; five factors were extracted and statistically significant. The first factor explained 32.11% of the variance, the second factor explained 11.92% of the variance, the third factor explained 8.08% of the variance, the fourth factor explained 7.07% of the variance and the fifth factor explained 4.56 %, of the variance. The obtained results from the EFA results revealed that five extracted factors explained 63.75 % of the variation of influencing factors on agricultural cooperatives. Under CFA, Measurement Model and structural modeling techniques were used with the aid of AMOS and Smart PLS3 statistical packages to explain the relationships among multiple manifested variables and exogenous and endogenous factors. CFA confirmed that five factors have a significant positive impact on ACMP. Implications of this research work will help ACs and CPO to identify the major factors that can affect ACMP.
Key words: Agricultural cooperatives (ACs), agricultural cooperatives marketing performance (ACMP), cooperative governance factor (CGF), financial factor (FF), infrastructural factor (IF), marketing factor (MF) and members value factor (MVF).
Cooperative enterprise born in the Agricultural and Industrial Revolutions of the 19 and 20th centuries, modern cooperatives bear a long and rich history. Founded in 1844, the Rochdale Society of Equitable Pioneers usually considered as the first successful cooperative enterprise, following the - Rochdale Principles‖, used as a model for modern cooperatives. A group of 28 weavers in Rochdale, England, set up the society to open their own store selling items otherwise unaffordable. This first success was the one of a consumer coâ€operative (Euro Coop, 2008).
Cooperatives have existed for around two hundred years. While operating in all fields of economic activity, cooperatives have greater longevity than for-profit firms. The cooperative model has continually adapted to changing conditions, and innovative forms of cooperation have emerged to address new economic and social concerns (Carlo and Giulia, 2012).
Since 1884, many types of cooperatives have been established worldwide to meet their members common economic, social and cultural needs, including Consumer cooperatives, agricultural cooperatives, worker cooperatives, credit unions, credit cooperatives, and mutual-aid societies have been set up almost everywhere. According to the ICA (2011), in total, about one billion people are involved in cooperatives in some way, either as members/ customers, as employees/participants, or both. Cooperatives employ at least 100 million people worldwide. It has been estimated that the livelihoods of nearly half the world‘s population are secured by cooperative enterprises. The world‘s 300 largest cooperative enterprises have collective revenues of USD 1.6 trillion, which is comparable to the GDP of the world‘s ninth largest economy (Spain).
In Ethiopia, Cooperation among people has existed since history has been record. Traditional forms of cooperation involved community members voluntarily pooling financial resources through "iqub", which was an association of people having the common objectives of mobilizing resources, especially finance, and distributing it to members on rotating basis. There were also initiatives for labor resource mobilization that were to overcome seasonal labour peaks, known as “Jigie, -Wonfel, among others. There also was the idir, which was an association for provision of social and economic insurance for the members in the events of death, accident, damages to property, among others. These informal associations continue to operate in Ethiopia (Bezabih, 2009).
However, the formation of modern cooperative societies was started soon after the Italian invasion. It was only in 1960s that a cooperative legally enacted. During the reign of Haile Selassie, the cooperative legislation No241/1966 has proclaimed and about 154 different types of cooperatives were organized. During the Derg regime, cooperatives that organized earlier deliberated unnecessary and discarded. The newly orga-nized cooperatives under the regime have purposefully made instruments of political power. Their organizational procedures not based on internationally accepted co-operative principles. New era in cooperative development was then started in 1998 when new co-operative legislation No 147/1998 was enacted (FCA, 2009).
Recently, the number of cooperatives and their services delivery has shown improvement in Ethiopia. According to FCA (2014), cooperatives created approximately 802,752 job opportunities. Cooperatives also supply agricultural input since 2006/2007 up to 2014 approximately 3,504,194 ton DAP and UREA and since 2006/2007 up to 2014 approximately 3,693,219.88 quintal selected seed to members and non-members. In 2014, around 2496 consumers cooperative distributed 3,854,392,585 birr estimated consumption goods.
According to FCA (2015) annual report indicates, there are 56,355 primary and secondary cooperatives, both agricultural and non-agricultural sector, of which, 56,044 are primary and 311 secondary cooperatives. Throughout the country, the total member of primary cooperative reached to 9,393,201 of which, 7,177,525 are male and 2,215,678 are female members and holding a total capital of 11.3 billion birr. Much of this growth trend explained by expansion of cooperatives in Oromia, Addis Ababa, SNNP, Amhara, Tigray and Somali, where the number of cooperatives grew by 18431, 12132, 12002, 8843, 4813 and 1306 respectively. Furthermore, in Oromia regional state, where the study is to be conducted 18,431 primary and 120 secondary cooperatives found (FCA, 2014).
And in the study area, Gedeb Hasasa district which is found in west Arsi Zone of Oromia region, there are 66 cooperatives and out of these, 25 are agricultural cooperatives, 21 are saving and credit cooperatives, 11 are consumers cooperatives, 5 are mining cooperatives, 3 are seed multipliers and there is also one union (G HWCPO, 2015).
Even though, there are hopeful indicators of success in cooperative movement, growth and in their performance in Ethiopia as well in oromia region and in the study area, the sector has faced many challenges that hinder its optimum utilization. According to MOA, ATA and FCA, (2012), Admasu (1998), Belete (2008) and Adisu (2011) indicate that, cooperatives in Ethiopia have limited capacity to provide output-marketing services, have limited capacity and capability to improve the effectiveness and efficiency of their input procurement and distribution services. The output marketing infrastructure within which cooperatives operate is underdeveloped and cooperatives have limited access to financing invest in improving output marketing.
Therefore, the study aims to investigate the major factors that affect marketing performance of agricultural cooperative societies in Gedeb Hasasa district, Oromia Regional State.
Cooperative performance
According to Chamaru (2012), profitability and management efficiency indicators mostly used among those net profit, return on assets (ROA), return on
1.
1.
2.
investment (ROI), and earning per share (EPS) are some common examples of the profitability indicators. Effective use of capital, management stability and efficiency of operations are other most popular measurements.
Moreover, as Divandari et al. (2010) identified four types of performance measures: Key result indicators (KRIs) tell you how you have done in a perspective or critical success factor; Result indicators (RIs) tell you what you have done; Performance indicators (PIs) tell you what to do to increase performance dramatically.
However, the problem is whether those are suitable to measure cooperative performance. Because cooperatives are different up to some extend from this profit printed organizations. That means, cooperatives almost not differ from other business organization. They are doing business, but their objectives have some unique differences from other organizations. They have to provide goods and services to its members and thus enable them to attain improved income and savings, investments, productivity, and purchasing power and promote among them equitable distribution of net surplus through maximum utilization of economics of scale, cost-sharing and risk-sharing without, however, conducting the affairs of the cooperative for eleemosynary or charitable purposes. Because of that background, they do not have a profit maximization objective (Chamaru, 2012).
In addition, Chamaru (2012) suggested two main indicators to measure cooperative performances. That is cooperative business performance and cooperative principle performance. In other words, anyway, they are doing business (without profit maximization objective), therefore their business performance should be measured to get an idea about the performance.
Moreover, according to Anderson and Vincze (2000), performance expectations are based on a company’s strategic goals, the standards that met or exceeded by leading marketers. A firm establishes performance criteria consistent with its mission and objectives. Furthermore, Davis (1997) cooperative value performance can be measured through the actions and programs implemented by considering cooperative values practice in day-to-day operations.
Marketing performance
According to Neely (2007), assessing marketing performance is very challenging. Unlike purely internal measures of performance, such as defects per million, marketing performance based on external, largely uncontrollable actors, such as customers and competitors. Furthermore, Lamberti and Noci (2010) identify the following marketing performance indicators, such as financial output indicators, which compare the results of the marketing actions to the costs associated to implement the actions (for example, profits, sales, cash flow). Non-financial output indicators, such as market share, customer satisfaction and so on; input indicators, which reflect marketing performance in terms of effort (for example, marketing budget and marketing assets) and multiple, hybrid indicators that evaluate macro dimensions related to efficiency, effectiveness and interdependence of the multiple dimensions of the marketing performance management system. Hence, marketing performance measured on different techniques mentioned earlier, to make the study more manageable, the performance of agricultural cooperatives in Gedeb-Hasasa studied by giving strong emphasis on sales growth, marketing cost reduction, bargaining power and carrying for others (stabilizing the market) (GHCPO, 2014).
Key factors for cooperative performance
Several authors discuss factors that may affect the performance of cooperative societies. According to Mahazril et al. (2012), cooperatives’ strategic planning and participation from their members are the identified factors that contribute to their overall achievement and performance of cooperatives.
Moreover, as Opata et al. (2014) highlighted, the following factors that determine the efficiency of the performance of the cooperatives such as experience of managers, amount of credit from donors and volume of savings generated from members. Besides, (Prakash, 2003), the following factors enhance the impact of agricultural cooperatives:
(1) Internal factors are viable and integrated cooperative trained professional and motivated staff
(2) Well-honed means to encourage members’ involvement and participation
(3) Strong vertical structural support
(4) Dedicated, enlightened, and selfless leadership
(5) Inclusive programs for members’ education and information.
(6) Value-added activities with advance technologies
(7) Provision for reasonable coverage of risk for loss of crops and deposits.
(8) External factors are positive support and helpful role of the government
(9) Availability of basic infrastructure
(10) Market reforms
(11) Reasonable rate of growth in agriculture
(12) Healthy relationships with regulatory and development institutions.
Theoretical framework
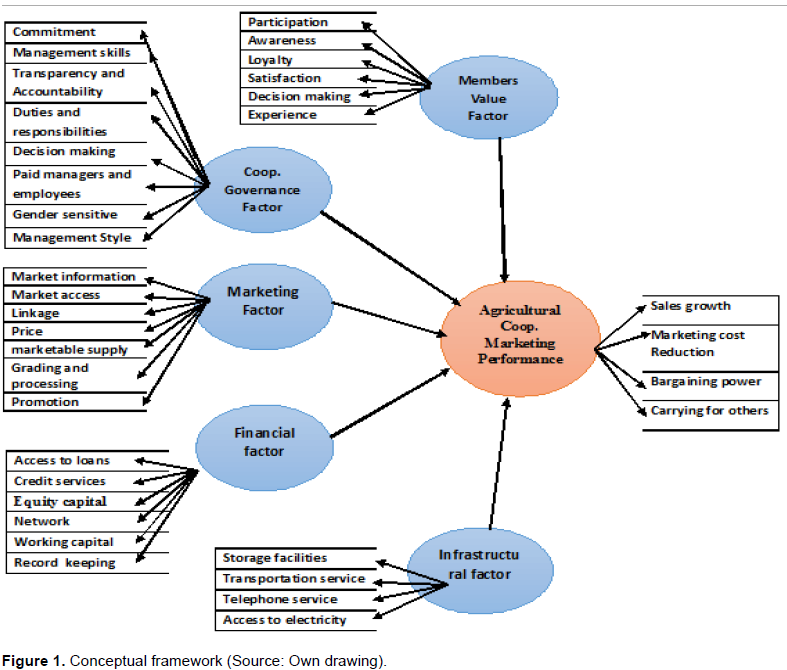
From the literature reviews the most important factors that affect ACMP selected for this study are presented in Figure 1.
Relationship between exogenous factors with endogenous factor and exogenous variables with endogenous variables
Description of endogenous factors and associated variables
Endogenous latent factor influenced by exogenous factors in the structural model, either directly or indirectly. The model should explain variation in values of endogenous variables since all latent variables that influence them are included in the model specification (Byrne, 1998). In this study, ACMP is Endogenous factor and its predictor’s manifested variables are sales growth, marketing cost reduction, bargaining power and carrying for others.
Description Of exogenous factors and associated variables
Exogenous latent factors are synonymous to independent variables which basis fluctuations in the values of other latent variables in the statistical model (Byrne, 1998). The set of exogenous latent factors and exogenous observed variables used in this study are;
(i) Members value factor shows the degree to which members of ACs exercise their right of ownerships, good understanding and general responsibilities towards their cooperative. This includes different predictors like members participation (MVF1), members awareness (MVF2), members loyalty (MVF3), member’s satisfactions (MVF4), Members Decision making ability (MVF5) and Members Experience (MVF6).
(ii) Cooperative governance factor include different predictor or variables like: Committee Members Commitment (CGF1), Committee Members Awareness, Knowledge And Skills (CGF2), transparency and accountability (CGF3), division of activities, duties and responsibilities (CGF4), decision making techniques (CGF5), paid managers and employees (CGF6), gender sensitive (CGF7) and management styles (CGF8).
(iii) Marketing factor refers to market information (MF1), Market access (MF2), linkage with unions and other cooperatives (MF3), Clear and competitive price for members’ supply (MF4), surplus marketable supply (MF5), Grading and processing (MF6) and promotion (MF7)
(iv) Financial factor include: Access to loans (FF1), credit services (FF2), equity capital (FF3), network (FF4), working capital (FF5), record keeping (FF6) and cash flow analysis (FIF7).
(v) Infrastructural factor include storage facilities (IF1), transportation service (IF2), access to communication service (IF3) and electricity (IF4).
Research design
The research design is a conceptual structure with which research was conducted; it constitutes the blueprint for the collection, measurement and analysis of data (Kothari, 2004). The descriptive and explanatory research design adopted in the study aims to assess factors affecting agricultural cooperative marketing performance. Descriptive research design is that the researcher has no control over the variables; he can only report what has happened or what is happening (Kothari, 2004). Explanatory research attempts to simplify why and how there is a relationship between two or more aspects of a condition or phenomenon. Explanatory research tries to find out explanations of observed phenomena, problems, or behaviors. It attempts to “connect the dots” in research, by identifying causal factors and outcomes of the target phenomenon (Anol, 2012). Based on time horizon, the research design is cross sectional. According to Michael (2014), a cross-sectional research design (also called a one-time correlational study) is a research in which, each person participates on one occasion, and all variables are measure at that time.
Data collection method and instrument
Primary and secondary data collected from appropriate sources of data. Primary data collected from respondents of five sample primary cooperatives through a structured questionnaire in order to assess the factors that influence Agricultural cooperatives marketing performance in the study area. A structured questionnaire with five point Likert - Scale was used to collect the opinions of respondents. Self-administered questionnaires were distributed randomly to the members of primary agriculture cooperatives in Hasasa District, oromia, Ethiopia. Out of the 324 questionnaires distributed for this research, 305 questionnaires filled and returned giving a response rate of 94%. According to Mugenda and Mugenda (2003), 50% response rate is adequate, 60% good, above 70% rate is very good. Therefore, in this study there was a very good response on the return of the questionnaires.
Target population
A population can be defined as all people or items (unit of analysis) with the characteristics that one wishes to study (Anol, 2012). The population in this study are all primary agricultural cooperatives which operate in the study area.
Sampling procedure and size determination
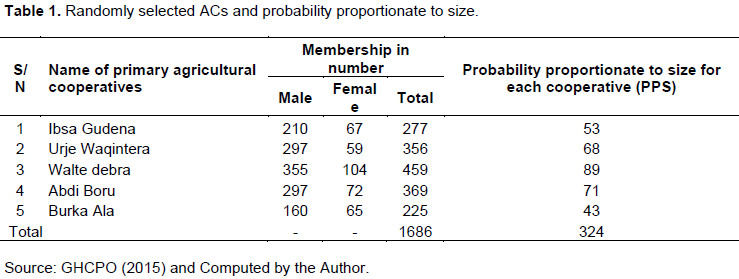
To select the respondents, multistage sampling method used. In stage one, by considering Mugenda and Mugenda (2003), a sample of 10 to 30% is good enough to define the sample frame of the target population, the available resource and time as well as homogenous nature of the population, five agricultural cooperatives (32%) of the population defined as target sample.
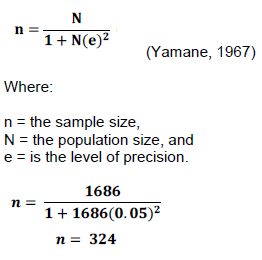
In stage two, from the target sample of five agricultural cooperatives (which have 1686 members), 324 sample respondents have drawn using the mathematical equation developed by (Yamane, 1967). The researcher used the following formula to define the required sample size at 95% confidence level, degree of variability of= 0.5 and with desired level of precision required = 0.5%.
In stage three, the determined sample size distributed to each cooperative on the basis of probability proportional to size (PPS).It is the quotient between the size of the population and the size of the sample (MaMaEuSch, 2001). Probability proportional allocation formula adopted according to (Kotari, 2004) as follow:
Where:
n= determined sample size
N= target population
N1= total number of population in each cooperatives
n1= number of samples in each cooperatives (Table 1)
In stage four, to select the specific individual respondent member from five agricultural cooperative societies, Convenience sampling technique is applied. This is for the reason that, convenience sampling is a generic term that covers a wide variety of ad hoc procedures for selecting respondents. Convenience sampling means that the sampling units are reachable, easy to measure and cooperative (Scott and Gerald, 2010).
Methods of data analysis
Descriptive date analyzed by investigating the distribution of responses based on frequencies and percentages through statistical package for social sciences (SPSS). Correlation analysis, factor analysis, measurement and structural model analysis was applied by using SPSS Version 20, AMOS 21 and Smart Partial Least Squares (Smart PLS 3) computer software.
Description of the study area
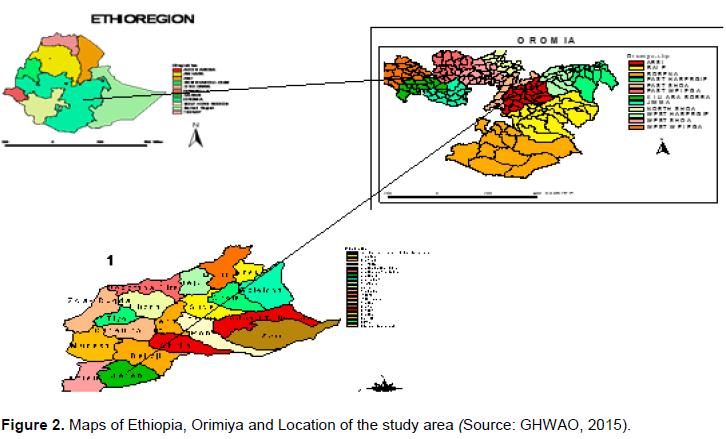
Gedeb-Hasasa district is located in west Arsi Zone of Oromia Regional State in Ethiopia. It is located at about 286 km away from the capital city, Addis Ababa in the southeast and 86 km away from Shashamane, the capital city of the west Arsi zone. It covers an estimated land area of 1135 square kilometers. Geographically, shares boundaries with Kore and Kersa in the north, Onkolo in the east, Dodola and Laga-Wabe in the south, and Kofale and Kore in the west bordered the district. The administrative center of the Woreda is Hasasa Town. It is subdivided into 32 kebele administrations, among these 25 of them are rural based administrative and seven of them are under the town administration (GHWAO, 2014). The district population estimated to be 187,799, of whom 92,912 were men and 94,887were women; 20,667 or 11.06% of its population were urban dwellers. The majority of the inhabitants were Muslim, with 80.68% of the population reporting they observed this belief, while 17.89% of the population said they practiced Ethiopian Orthodox Christianity, and 1.31% of the population were Protestant (CSA, 2008) (Figure 2).
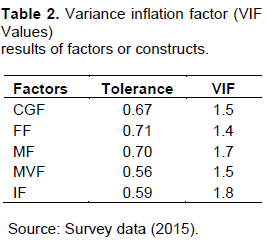
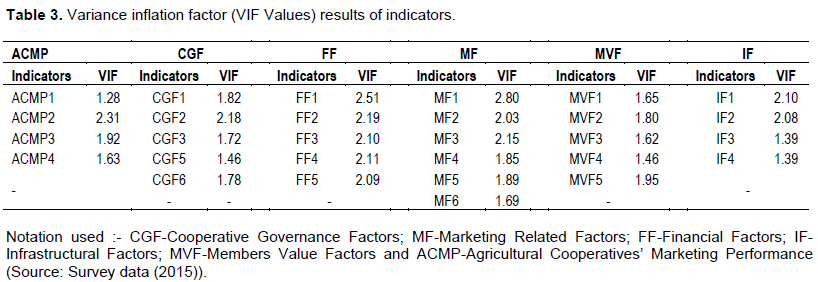
The co-linearity issues
Tolerance and variance inflation factor (VFI) help to explore presence of multicollinearity. Tolerance is the degree where by one construct varies from other constructs and presence of tolerance value less or equal to 0.1 indicates existence of multicollinearity. On the other hand, VFI is the opposite of tolerance and existence of its value greater or equal to 10 reveals presence of multicollinearity (Pallant, 2011). For this study, both VIF of constructs and VIF of indicators are assed as indicated in Table 2. Table 2 shows that all tolerance value greater than 0.1 and all VIF values for all factors are under 10, which demonstrated that the data set is free from multi-co linearity problems. The statistics of collinearity results presented in Table 3 shows VIF values for all indicators were under 10, which demonstrated that the there was no serious multi-co linearity problems in the survey data.
Results of descriptive analysis
Before conducting reliability, validation and further analysis for collected data, descriptive statistics must be conducted in advance (Pallant, 2011).
In this study, predictors of socio - demographic factors such as sex of participants, age of participants, marital status, educational status, duration of membership and reasons for membership were not considered as indicator variables. However, this is used to describe only the socio-demographic profile of respondents. Therefore, to give clear picture about the sample respondents, simple statistics such as frequencies, percentage and mean are used to describe the socio-demographic characteristics of respondents (Table 4).
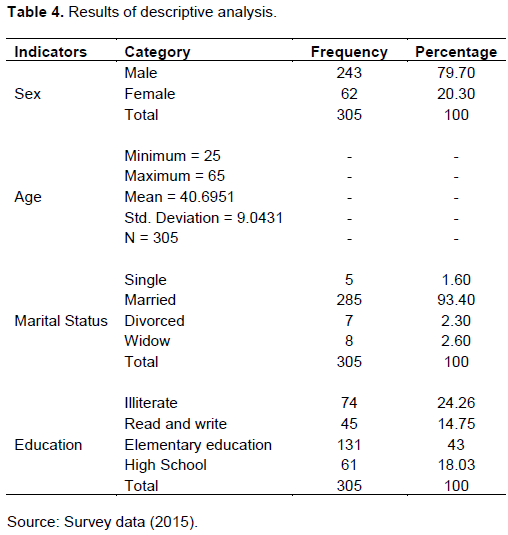
Regarding gender of participants, the majority of the respondents who participated in the study are male 243 or (79.7%), while 62 or (20.3%) are female. Therefore, this could be because male and female membership number disparity in cooperatives. In all selected ACs, numbers of male are greater than number of female. The age distribution of the sampled ranges from 25 to 65 minimum and maximum, respectively. The average age of sampled members is 40.69 years. This shows the majority of respondents are between ages of 25 and 45 years in which implies that the sample farmers are at an economically productive age.
In terms of marital status, respondents were categorized into four categories namely, single, married, divorced and widowed. Table 4 shows 84.92 percent of them were found to be married; While 1.6, 2.3 and 2.6% were single, divorced and widowed sequentially. This indicates the majority of the respondents are married and more they could be stable.
Regarding educational qualification, 74 (24.26%)% of the respondents’ are Illiterate, 45 (14.75%) of them could read and write, 131 (42.95%) attend elementary education, 61 (18.03%) percent respondents completed High School. This indicates that almost the majority of the respondent could read and write. This is a good opportunity for the cooperatives to inculcate and train the members to produce better leaders for better men to fits marketing role in the area.
Reliability and validity assessment
Cronbach's Alpha
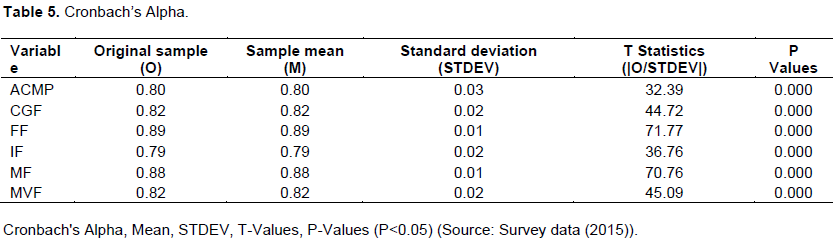
Cronbach's Alpha is a measurement of reliability that assumes equal indicator loadings (Hair et al., 2014). The value of Cronbach Alpha is classified based on the reliability index classification where 0.90 to 1.00 is very high, 0.70 to 0.89 is high, 0.30 to 0.69 is moderate, and 0.00 to 0.30 is low (Babbie, 1992) (Table 5). As Table 5 indicates, alpha values range from 0.792 to 0.888. Therefore, the analysis showed that the Cronbach Alpha value falls into the classification of high. This means all the reliability values of each construct are greater than the benchmark of 0.70 which recommended by (Hair et al., 2014). Since all the alpha coefficients were greater than 0.7, the conclusion is drawn that the instrument had a good internal consistency of the items in the scale and were appropriated for the study. For more clarification, see Table 4).
Composite reliability
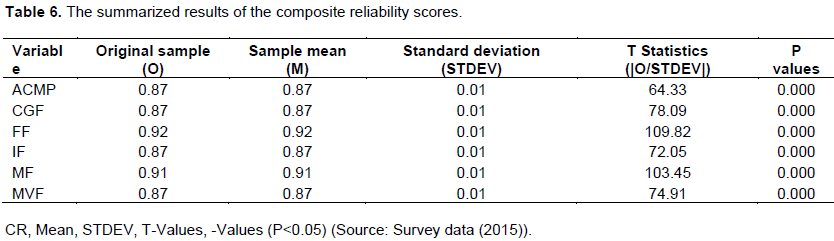
The composite reliability varies between 0 and 1, with higher values indicating higher levels of reliability. It is generally interpret in the same way as Cronbach's alpha. Specifically, composite reliability values of 0.60 to 0.70 are acceptable in exploratory research, while in more advanced stages of research, values between 0.70 and 0.90 can be regarded as satisfactory (Nunally and Bernstein, 1994). Therefore, composite reliability values below 0.60 indicate a lack of reliability (Table 6). As Tables 6 depicts, coefficients values of composite reliability range from 0.866 to 0.918, this means all the composite reliability values of each construct are greater than 0.70 recommended by Nunally and Bernstein (1994). This indicates there is high levels of internal consistency of the items in the scale and are appropriated for the study (For more clarification, see Table 6).
b
Convergent validity
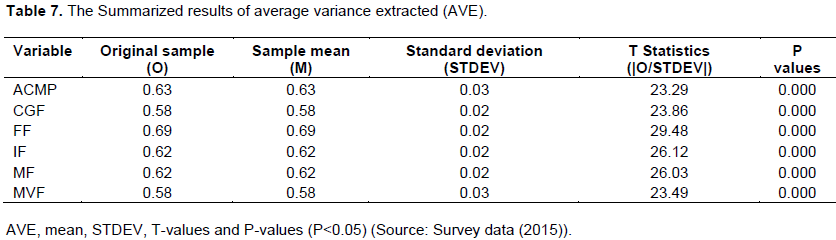
An AVE of less than 0.50 indicates that, on average, more error remains in the items than the variance explained by the construct (Hair et al., 2014). The convergent validity was considered satisfactory because all latent variables have high loading above 0.5 (Black et al., 2010; Hair et al., 2014). As shown in Tables 7, AVE values range from 0.580 to 0.690, representing high levels of internal consistency and validity. This indicates it explains more than half of the variance indicators (For more information (Table 7).
Correlation analysis
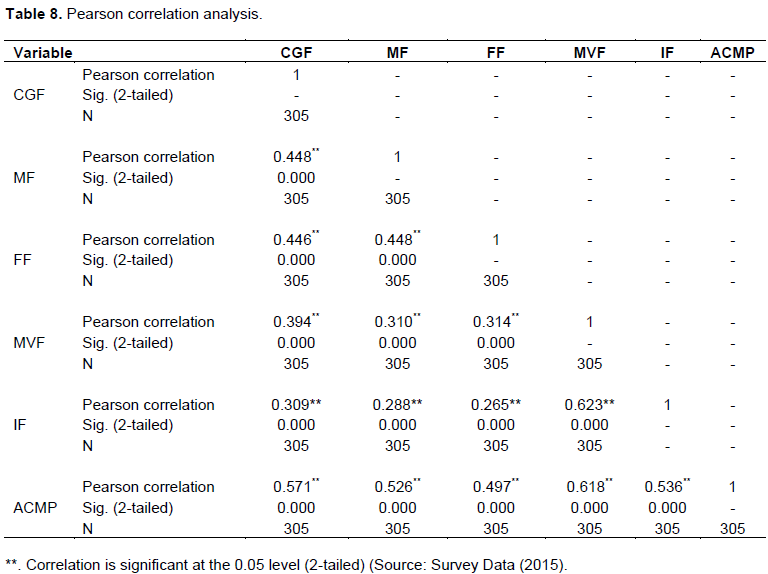
In this study to see connection between exogenous factors (independent variables) and endogamous factor (dependent variable) pearson correlation analysis is employed. Therefore, the following pearson correlation allows us to estimate the strength of connection between exogenous factors (independent variables) and endogamous factor (dependent variable). As Table 8 depicts, Pearson Correlation indicated that there is a positive significant relationship (r =0.62, p = 0.000) of Members Value Factors (MVF) with Agricultural Cooperatives Marketing performance (ACMP). There is a positive significant relationship (r = 0.57, p = .000) of Cooperative Governance Factor (CGF) with Agricultural Cooperatives Marketing performance (ACMP). In the same manner positive significant correlation is seen between Infrastructural Factors (IF), Marketing Related Factors (MF) and Financial Related Factors(FF) with Agricultural Cooperatives’ Marketing Performance(ACMP) respectively, whose values are (r = 0.54, p = 0.000), (r = 0.53, p = 0.000) and (r = 0.50, p = 0.000).
Exploratory factor analysis (EFA)
EFA is a statistical technique that used to conduct two main results, such as data summarizing and data reduction (Tabachnick and Fidell, 2001). In this study, EFA was conducted through principal component analysis with promax rotation. The purpose of using EFA with principal component analysis is to derive a linear combination of items such that maximum variance extracted from the construct. EFA analysis includes the testing of correlations using KMO and Barlett’s test of sphericity.
Kaiser-Meyer-Olkin (KMO) and Bartlett's test
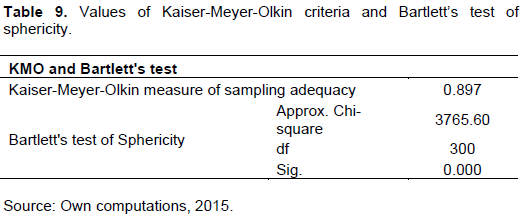
As seen in Table 9, KMO measure of sampling adequacy result is approximately 0.90 which indicates the data are great and suitable for factor analysis (Table 9). The strength of the relationship among variables was measures by Bartlett test of Sphericity. It provides a chi-square output that must be significant. It indicates the matrix is not an identity matrix and accordingly it should be significant (p<0.05) for factor analysis to be suitable (Anderson et al., 1995). The Bartlett test for these data is 0.000 less than 0.05. This shows the significance of the factor analysis. In general, The KMO of 0.90 and Bartlett test of 0.00 shows that factor analysis is appropriate (See the KMO and Bartlett Test in Table 9).
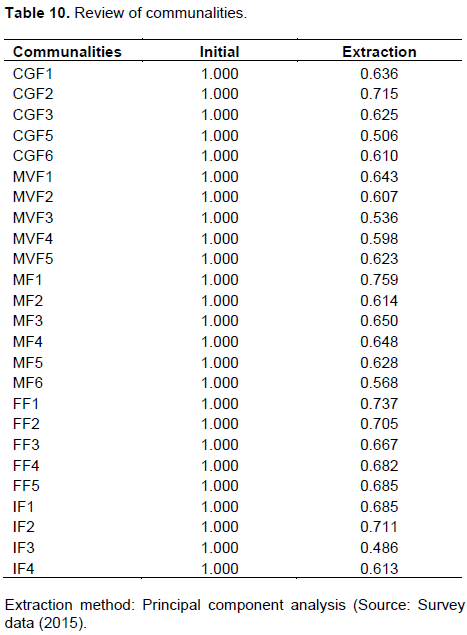
Table 10 shows, the communalities chart that indicates the proportion of variance of each item that explained by the factors. Communalities calculated of the initial solution and then after extraction. This is described in the
initial and extraction. Under the extraction heading, we want values equal to or greater than 0.50. According to Hair et al. (2010) variables which communalities less than 0.50 are not having sufficient explanation and excluded from the analysis.
Moreover, Comrey and Lee (1992) suggest that communalities values of 0.45 are considered fair. Therefore, in this research out of 31 indicators 5 predictors which communalities less than the required level have excluded from exploratory analysis. Therefore, only 25 predictors meet acceptable level of explanation and retain for interpretation and further analysis.
Table 11 shows all the factors extractable from the analysis related with each linear component (factor) before extraction, after extraction and after rotation. According to the K1 - Kaiser’s (Kaiser, 1960) method, only constructs which has the eigenvalues greater than one are retained for interpretation. Therefore, as seen earlier, the total variance explained the table, the first five factors are statistically significant which have Eigenvalues > 1 retained for interpretation and further analysis.
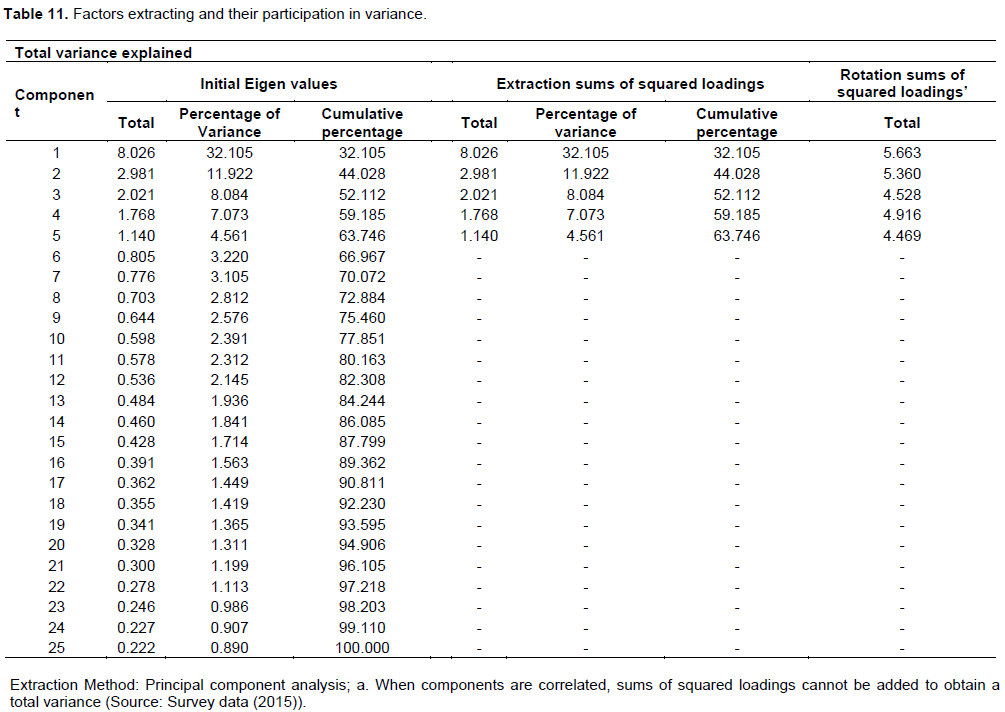
The first factors account for 32.11% of the variance, the second accounts for 11.92% of the variance, the third factor illustrate 8.08% of the variance, the fourth factor explained 7.07% of the variance and, the fifth factor explained 4.56% of the variance all factors with eigenvalues greater than 1. These five extracted factors/ components explained 63.75% of the variance. It should be clear that the first few factors explain relatively larger amounts of variance whereas subsequent factors explain small amounts of variance. The Extraction Sums of Squared Loadings provides similar information based only on the extracted factors and Rotation Sums of Squared Loadings results have showed more evenly distributed across the factors (Figure 3). A scree plot was drawn based on the variables to determine how many factors the model should have (Cattell, 1966).
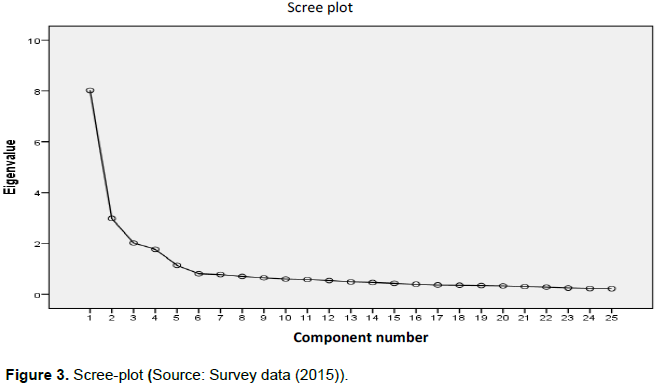
According to the aforementioned scree plot result, we have retained five components that the model should keep. Retain factors that are above the ‘bend’ – the point at which the curve of decreasing eigenvalues change from a steep line to a flat gradual slope. The cutoff point of in the eigenvalue of one in the scree plot clearly showed that there are five relatively high and statistically significant (factors 1, 2, 3, 4 and 5) eigenvalues (Table 12).
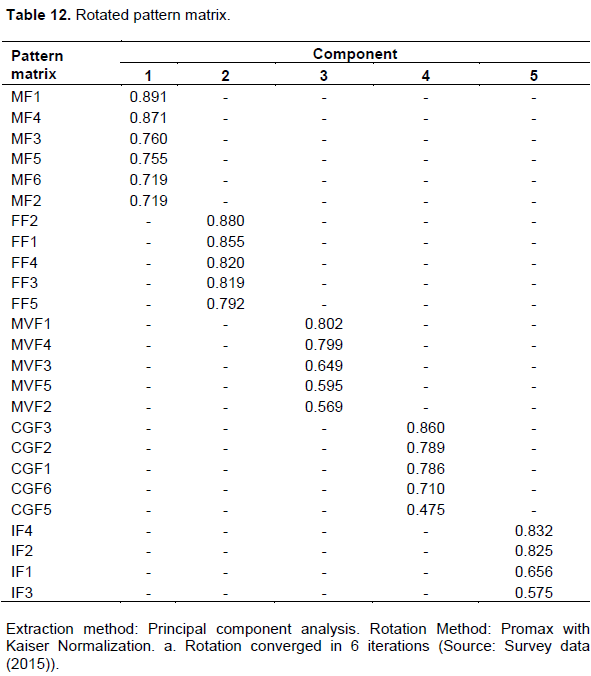
Table 12 shows the factor loadings for the rotated solution. The Pattern matrix comprises the loadings of each variable into each factor. Factor loadings are similar to regression weights (or slopes) and indicate the strength of the association between the variables and the factors. The Pattern Matrix shows the values of the retained factors and the associated variables. The Pattern Matrix was rotated to achieve an interpretable structure. Factors were construed through their loadings. The greater the loading, the more the variable is a pure measure of the factor. According to Hair et al. (2010) in a sample of 250 respondents, factor loading of 0.35 and above are significant. Therefore, the aforementioned-rotated factors loading results are statistically significant because all indicators loading values are greater than the required level.
Summary of exploratory factor analysis
Based on the earlier mentioned analysis, there are five statistically significant factors or influential factors, which have Eigenvalues > 1, and explain 63.75 % of studied phenomenon. Namely:
(1) Component 1 is Marketing factor (MF). This factor consists of five variables explaining 32.11 % of the total variance. Highest contribution to the factor is made by the MF1 (factor weight: 0.89) variable stating that “Market information.” Variables contributing to the factor are as follows: MF4 (factor weight: 0.87) “price.”, MF3 (factor weight: 0.76) “linkage.” MF5 (factor weight: 0.76) “surplus marketable supply.” MF2 (factor weight: 0.72) “Market access” and MF6 (factor weight: 0.72) “Grading and processing members’ products.” Moreover, the factor had an eigenvalue of 8.15.
(2) Component 2 refers to the Financial Factor (FF).This factor consists of five variables explaining 11.92 % of the total variance. The highest contribution to the factor are made by FF2 (factor weight: 0.88) “Equity capital” and FF1 (Factor weight: 0.86) “Access to loans”. The other variable contributing to the factor are as follows: FF4 (factor weight: 0.82) “Network with Financial institutions”, FF3 (factor weight: 0.82) “Credit services to its members” and FF5 (factor weight: 0.79) “working capital management.” Moreover, this factor had an eigenvalue of 2.99.
(3) Component 3 is Members Value Factor (MVF). This factor consists of five variables explaining 8.08 % of the total variance. Highest contribution to the factor is made by MVF1 (factor weight: 0.80) variable stating that “Members participation.” The others Variables contributing to the factor are as follows: MVF4 (factor weight: 0.80) “Member’s satisfactions.” MVF3 (factor weight 0.65) “Members loyalty to their Cooperatives” MVF5 (factor weight: 0.60) “Decision making ability” MVF2 (factor weight: 0.57) “Members Awareness”. Moreover, the factor had an eigenvalue of 2.04.
(4) Component 4 is Cooperative Governance Factor (CGF). This factor consists of six variables explaining 7.07 %, of the total variance. Highest contribution to the factor are made by CGF3 (factor weight: 0.86) “Transparency and Accountability.” The other variables contributing to the factor are CGF2 (factor weight: 0.79) “Management committee awareness, knowledge and skills.” CGF1 (factor weight: 0.79) “Management committee commitment (CGF1).” CGF6 (factor weight: 0.71) “Paid managers and employees.” CGF5 (factor weight: 0.48) “participatory approach decision making techniques.” Moreover, the fourth factor had an eigenvalue of 1.87.
(5) Component 5 is Infrastructural Factor (IF): This factor consists of four variables explaining 4.56 % of the total variance. Highest contribution to the factor is made by IF4 (factor weight: 0.83) “Access to electricity.” Variables contributing to the factor are as follow: IF2 (factor weight: 0.83) “Transportation service IF1 (factor weight: 0.66) “Storage facilities,” IF3 (factor weight: 0.58) “Communication service. Moreover, the factor had an eigenvalue of 1.16.
Confirmatory factor analysis
Confirmatory factor analysis (CFA) is a much more sophisticated method usually used in the advanced stages of the research process to test a theory about latent processes (Tabachnick and Fidell, 2007). Structural Equation Modeling (SEM) encompasses two components: a measurement model connecting a set of observed variables to a usually smaller set of latent variables and a structural model linking the latent variables through a series of recursive and non-recursive relationships. CFA analysis includes the testing of goodness of fit indices consisting on Chi-square, degree of freedom, level of significance, CFI, GFI and AGFI, IFI, NFI, RMR and RMSEA (Naveed et al., 2014).
Measurement mode
To test the measurement model, validate the research model fitness and to explain how measured variables logically and systematically represent latent variables involved in a theoretical model a measurement model was conducted using Amos version 21 statistical software program. According to Hair et al. (2006), acceptable model fit is indicated by chi-square value over degree of freedom (χ2/df) of value between 1 and 3, the values of goodness-of-fit index (GFI) equal to or greater than 0.90, incremental fit index (IFI) equal to or greater than 0.90, comparative fit index (CFI) equal to or greater than 0.90.
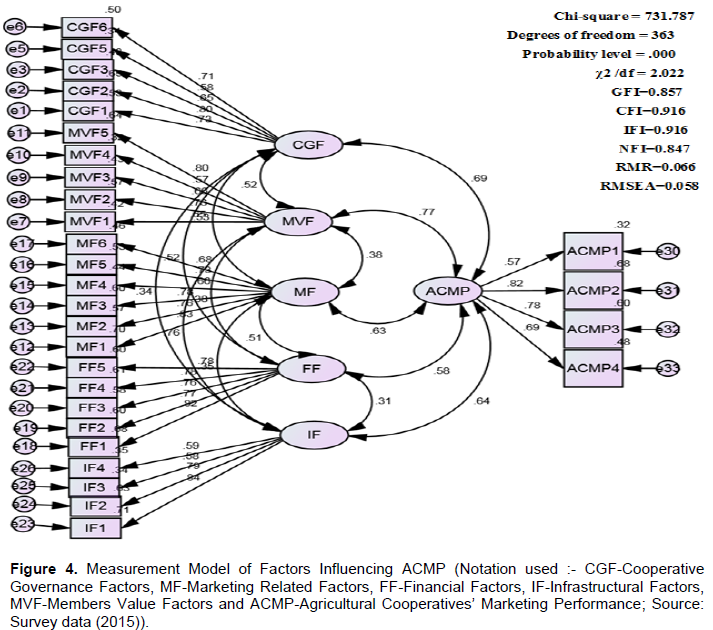
In addition, the Normed fit index (NFI) equal to or greater than 0.90, the root mean square error of approximation (RMSEA) value to be equal to or less than0.08 while root mean square residual (RMR) values to be less than 0.08. Moreover, Bagozzi and Yi (1988) suggested that AGFI and GFI are reasonably good if they are more than 0.90 and 0.89, however 0.80 should be acceptable. Because, the assessment values associated with acceptable models vary from condition to condition and depend significantly on the number of measured variables, the sample size, and the communalities of the factors (Black et al., 2010) (Figure 4).
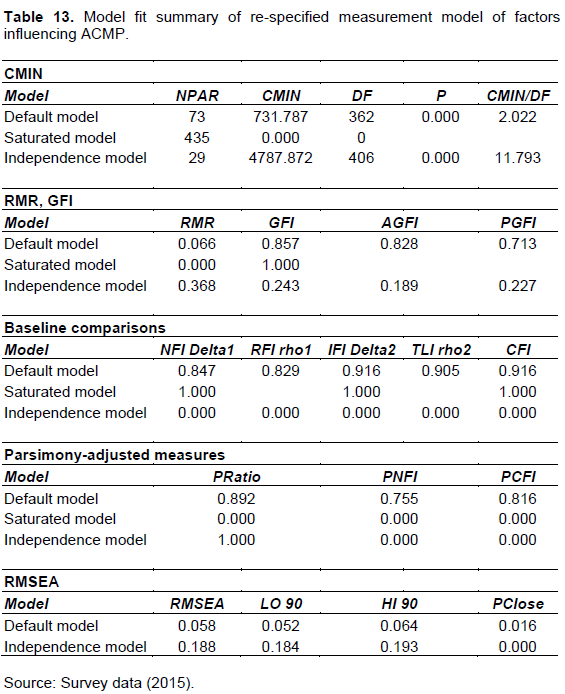
In the analysis of agricultural cooperatives marketing performance measurement model, the results showed that the model was fitted with the empirical data with the following values; Chi-square = 731.787, Degrees of freedom = 362, Probability level = .000, χ2 /df = 2.022, GFI=0.857, CFI=0.916, IFI=0.916, NFI= 0.847, RMR= 0.066 and RMSEA= 0.058.
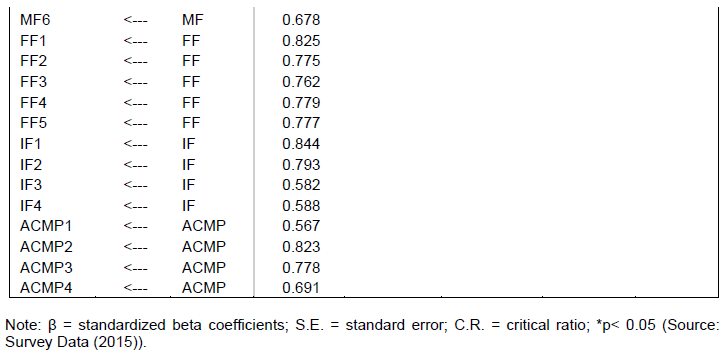
These results indicate that the models are acceptable. Significance level of 0.000 shows as measurement model is good fit to the data. Measurement indices χ2 /df, GFI, CFI, IFI, NFI, RMR and RMSEA were within the expected range of values. This is presented in Tables 13 to 15. Tables 13, 14 and 15 shows the sample of the regression weight, standardize regression weight, correlations and covariances of six latent factors and observed variables. As we have seen from the unstandardized regression weights, all the critical ratios are greater than 1.96 and all factors loading are statistically significance. The standard regressions weight also weighting ranging from 0.565 to 0.844. This means that all the indicators weight estimates above 0.50 which is suggested by (Hair et al., 2006). This indicates that all the indicator variables have strong influences on the variation of their respective latent variables or it indicates that all variables significantly related to their specific constructs.
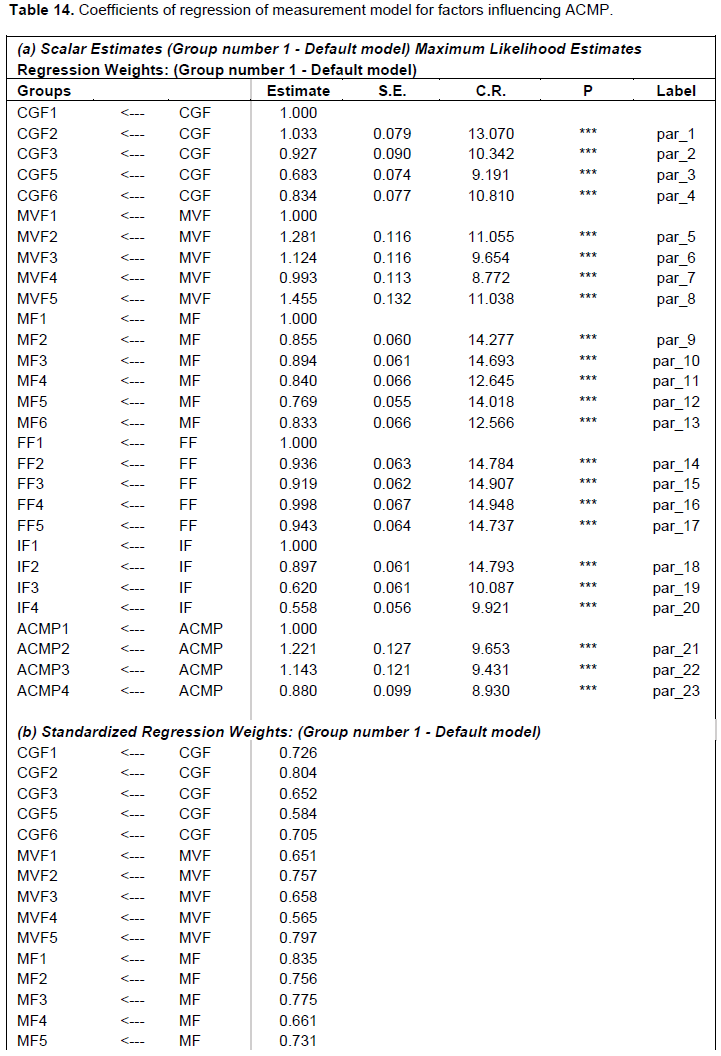
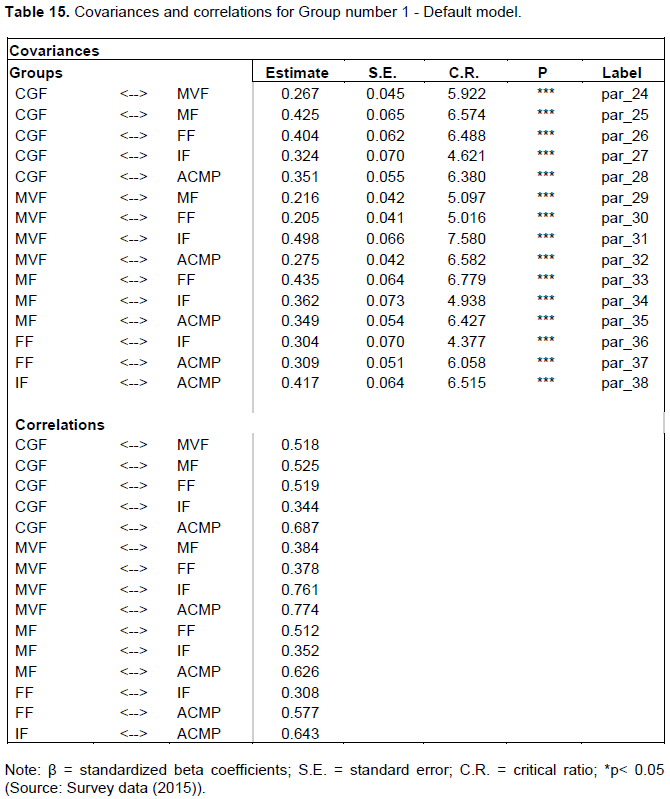
The sample correlations ranged from 0.308 to 0.774. According to Pallant (2010), the value of correlations among variables should be greater than 0.3. This means all the correlations value indicating that there is reasonably statistically significance correlation among latent factors.
Structural model
To asses a set of relationship between independents and a dependent variable the SEM method was used. Once an acceptable measurement model is available, the structural model estimation should be able to start (Bentler and Hu, 1999).
A structural equation model uses equations of a covariance structure, and its been use to access causality between an observed and theoretical model. Structural equation models are able to describe potential factors without measurement errors using confirmatory factor analysis and a method that links the potential factors via regression analysis.
Furthermore, the SEM appropriately pools with factor and regression analysis to examine causal relationships (Jung et al., 2015). In order to test the relationships between the exogenous latent factors with endogenous latent factors in the structural model or to test the effects of different Factors on ACMP, a SEM was undertaken using Smart PLS 3 statistical software (Figure 5).
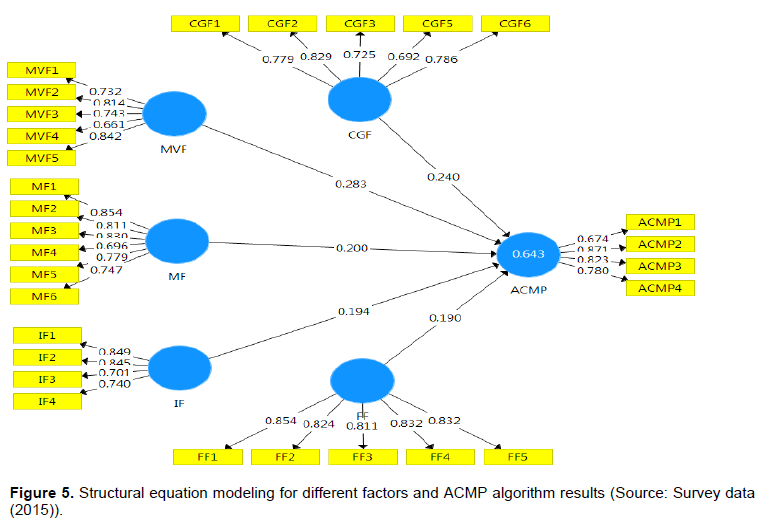
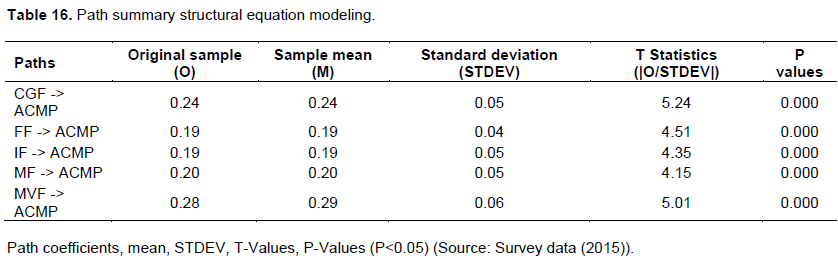
Path coefficients are the relationships between the latent variables in the structural model. The path coefficients have standardized values between -1 and + 1. Estimated path coefficients close to +1 represent strong positive relationships (and vice versa for negative values) that are almost always statistically significant (that is, different from zero in the population). The closer the estimated coefficients are to 0, the weaker the relationships. Very low values close to 0 are usually non- significant. Path coefficients with standardized values below 0.10 are usually not significant (Hair et al., 2014) (Figure 6).
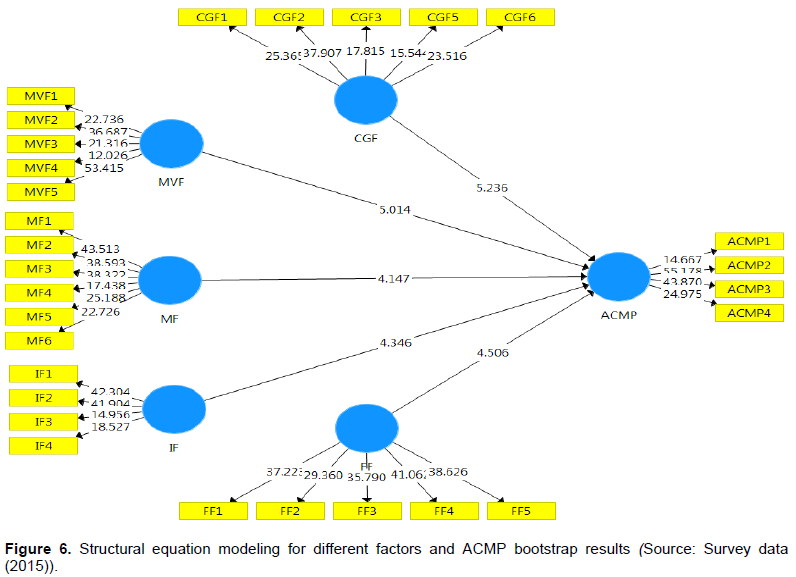
As we have seen in Table 16, all paths are statistically significant considering significance value is above 1.96. Because, according to Hair et al. (2014), this is to determine critical t-values (or theoretical t-values) for significance testing. Therefore, when the size of the resulting empirical t-value is above 1.96, we can assume that the path coefficient is significantly different from zero at a significance level of 5% (α= 0.05) (Table 16).
The present research employed correlation analysis, exploratory and confirmatory factor analysis and presented positive and significant relationship between exogenous factors (members value factor, cooperative governance factor, marketing factor, financial factor, and infrastructural factor) and endogenous factor (agricultural cooperatives marketing performance). According to the result of correlation analysis, exploratory factor analysis and measurement model, MVF, CGF, MF, FF, and IF were found to have a very strong and significant relationship with ACMP. Moreover, structural model results confirmed that, MVF, CGF, MF, FF, and IF have positive and significant effect on ACMP.
Agricultural cooperative marketing performance requires effective members’ participation, members’ decision-making abilities and members’ loyalty; financial strength, management and technical skills of committees, infrastructural access and adequate and onetime market information. Members are the most important assets of cooperatives. They are owners, users of the services available and responsible to control the overall activities. Cooperative success depends on effective members’ participation, members’ decision-making abilities and members’ loyalty. To improve members’ participation, members awareness, and members decision making abilities. Cooperative promotion office, primary cooperatives themselves, unions and other concerned stakeholders should give attention to empower cooperative members awareness and members decision making abilities through open discussion and through short term and long-term well programmed trainings and educations.
Management committees are the responsible bodies to lead the overall activities of cooperatives. They monitor the day-to-day activities of cooperatives, hire and fire employees, approve transactions and evaluate performances of employees. Unless they are well equipped with the principles and values of cooperatives and technical and managerial skills of management, it is too difficult to them to have meaningful role in managing activities and giving the right directions.
However, Most of the Management committees’ members of cooperatives have no awareness on conceptual, technical and managerial skills to manage their cooperatives. And lack of transparency and accountability, low commitment and unwillingness of committee members were also another observed problems. Therefore, Cooperative Promotion office, non-governmental organisations (NGOs), secondary cooperatives (unions) and primary cooperatives themselves should give attention to upgrade the conceptual, technical and managerial skills of management committees, control committee, others sub-committee members and employees through short term and long term training program.
Agricultural cooperatives in the study area need to involve effectively in marketing of farmers output by offering competitive prices to farmers produce. To search market and to marketing the farmers produce at better price, cooperatives should create linkage with unions, other primary cooperatives and privet and government organization.
Moreover, cooperative promotion office, NGOs and secondary cooperatives (unions) should give due attention to give technical and material support to strengthen their capacity that help to engage for further value addition activities. The main aim of organizing ACs in the rural part of the country is to enhance farmers‟ access to information, market, agricultural inputs, credit services and to improve negotiation power of farmers, attain economies of scale and market farmers output. In the study area ACs were relatively better in the supply of farm inputs. But they lag behind to collect members’ products well during harvesting season with fair price and dawn payment market farmers produce. Therefore, cooperatives, cooperative promotion office and other stakeholders need to give due attention to improve the services of the cooperatives in this regard through technical and material support.
The poor finance of the cooperative societies should be solved by increasing equity capital through designing a mechanism of promote members’ saving and to buy additional shares. Moreover, governments and other financial institutions should arrange for long-term financial credit. Working capital management, record keeping and documentation system weakness can be improved by giving training and education to employees and management committees and control committee members’.
Furthermore, agricultural cooperatives marketing performance should be influenced by marketing infrastructures. Therefore, government and others stakeholders should provide support to improve marketing infrastructures such as transportation facility, storage facility, communication facilities and electricity services.
DIRECTIONS FOR FUTURE RESEARCH
This study attempted to investigate factors influencing ACMP. However, this study is limited to one district only which makes it difficult to generalize and make inference to the whole region. Thus, future research may make an in-depth study in this regard by considering other district of the region or the country to clearly factors influencing agricultural cooperatives marketing performance. Future research could also be consider for the embeddedness of other factors like legal and political factors, technological factors, organizational linkage factors, and cultural factors as construct factors and as predictors’ variables.
The author has not declared any conflict of interests.
REFERENCES
|
Admasu S (1998). Performance evaluation of coffee marketing in sidamo zone. M.Sc. thesis presented to Alemaya University of Agriculture, Alemaya .
|
|
|
|
Almaz MT (2008). Comparative study on the performance of dairy cooperative input and output marketing: In Astbie Womerta, Alamata and Enderta woreda in Tigray Region Ethiopia.
|
|
|
|
Anderson C, Vincze J (2000). Strategic Marketing Management. Houghton Mifflin Company.
|
|
|
|
Anol B (2012). Social Science Research: Principles, Methods, and Practices. Florida: Textbooks Collection.
|
|
|
|
Azmah O, Fatimah K (2008). Enhancing Co-operative Movement to Achieve Malaysias Development Goals.
|
|
|
|
Babbie E (1992). The practice of social research. Belmont, California: Wadsworth Publishing.
|
|
|
|
Bagozzi R, Yi Y (1988). On the evaluation of structural equation models. J. Acad. Market. Sci. 16 (1):74-94.
Crossref
|
|
|
|
Belete AF (2008). A Study on Marketing Performance of Damot Multipurpose Farmer Cooperative Union and its Affiliates, Amhara Region. M.A thesis, Mekelle University, Ethiopia .
|
|
|
|
Bentler PM, Hu L (1999). Cutoff criteria for fit indexes in covariance structure analysis: Conventional criteria versus new alternatives.6(1):1-55.
|
|
|
|
Bezabih E (2009). Cooperatives : a path to economic and social empowerment in Ethiopia. Coop. AFRICA working paper, 9, 1 & 26.
|
|
|
|
Byrne BM (1998). Structural Equation Modeling with LISREL, PRELIS, and SIMPLIS: Basic Concepts, Applications, and Programming. Lawrence Erlbaum Associates, Inc.
|
|
|
|
Carlo B, Giulia G (2012). Promoting the Understanding of Cooperatives for a Better World. Venice, Italy, 6.
|
|
|
|
Cattell RB (1966). he scree test for the number of factors. Multivar. Behav. Res. 1(2):245.
Crossref
|
|
|
|
Chamaru D (2012). The New Mechanism For the Performance Evaluation of Cooperatives. Math. Comput. Contemp. Sci. P19.
|
|
|
|
Comrey AL, Lee HB (1992). A first course in factor analysis (2nd ed.). Hillsdale, NJ: Lawrence Erlbaum Associates.
|
|
|
|
Davis P (1997). Cooperative Identity and Cooperative Management. International Cooperative Information Center.
|
|
|
|
Divandari A, Pourzarandi EM, Karimi S (2010). Using KPIs for Strategic Management of IT in Mellat Bank. Int. J. Infor. Sci. Manage. P 48.
|
|
|
|
European Community of Consumer Cooperatives (Euro Coop). (2008). Consumer Cooperative Social Responsibility: Bringing Values in to Retail Business, P 7.
|
|
|
|
Federal Cooperative Agency (FCA). (2014). Federal Cooperative Agency Anual Report. Addis Ababa: Unpublished.
|
|
|
|
Gedeb-Hasasa Cooperative Promotion Office (GHCPO) (2014). Districts Cooperatives Profiles. Hasassa: Unpublished Documents.
|
|
|
|
Hair JE, Anderson RE, Tatham RL, Black WC(2006). Multivariate Data Analysis: A Global Perspective (7th ed.).
|
|
|
|
Hair JF, Black WC, Babin BJ, Anderson RE (2010). Multivariate Data Analysis (7th ed.). Upper Saddle River, New Jersey: Prentice Hall.
|
|
|
|
Hair JF, Hult TM, Ringle CM, Marko S (2014). A Primer on Partial Least Squares Structural Equation Modeling (PLS-SEM). London, United Kingdom: SAGE Publications Ltd.
|
|
|
|
Jung IK, Yen YY, Jeong RK (2015). An Empirical Study as to an Effect on Policy Satisfaction of Small and Medium-Sized Firms which got Consulting. Indian J. Sci.Technol. 8(S7):701-710.
Crossref
|
|
|
|
Kaiser H (1960). The Application of Electronic Computers to Factor Analysis. Educ. Psychol. Meas. 20:141-151.
Crossref
|
|
|
|
Katar S, Pundir RS (2000). Cooperatives and Rural Development in India. Institute of Rural Kifle, T. (2015). Cooperative Movement in Ethiopia: Development, Challenges and Proposed Intervention. J. Econ. Sustain. Dev. P 38.
|
|
|
|
Kothari C (2004). Research Methodology: Methods and Techniques (2nd ed.). New Delhi: New Age International.
|
|
|
|
Lamberti L, Noci G (2010). Marketing strategy and marketing performance measurement system: Exploring the relationship. Eur. Manage. J. 28(2):141.
Crossref
|
|
|
|
Mahazril Y, Hafizah H, Zuraini Y (2012). Factors Affecting Cooperatives' Performance In Relation To Strategic Planning and Members' Participation. Procedia - Social and Behavioral Sciences, 104.
|
|
|
|
Michael WP (2014). Research Methods Concepts and Connections. New York: Worth Publishers, Macmillan Higher Education.
|
|
|
|
Ministry of Agriculture (MOA), Agricultural Transfor Agency (ATA), Fedral Cooperative Agency (FCA) (2012). Agricultural Cooperative Sector Development Strategy 2012-2016. Addis Ababa: Universal Printing Press.
|
|
|
|
Mugenda MO, Mugenda GA (2003). Research Methods. Nairobi: Acts Press.
|
|
|
|
Muthyalu M (2013). Analyze the Performance of Multipurpose Cooperatives in Input and Out Agricultural Marketing in Adwa Woreda, Tigray Region, Ethiopia. IFSMRC AIJRM, 2, 14, 15 &129.
|
|
|
|
Naveed RK, Marinah A, Arsalan MG (2014). Organizational Commitment Construct: Validity Measure Using SEM. Sci. Int. (Lahore).
|
|
|
|
Nunally JC, Bernstein I (1994). Psychometric Theory. New York: McGraw-Hill.
|
|
|
|
Opata P, Nweze N, Ibrahim M, Akerele D (2014). Performance Evaluation Of Women Cooperative Societies In Rural South-East Nigeria. IOSR J. Bus. Manage. (IOSR-JBM) . pp.15-19.
|
|
|
|
Pallant J (2001). SPSS Survival Manual (4th ed.): A step to step guide to data analysis using SPSS for Windows. Australia: Allen and Uwin Book Publishers.
|
|
|
|
Prakash D (2003). Development of Agricultural Cooperatives-Relevance of Japanese Experiences to Developing Countries. Rural Development and Management Centre, 6 & 25.
|
|
|
|
Scott SM, Gerald AS (2010). An Introduction to Marketing Research. New Mexico: Qualtrics Survey University.
|
|
|
|
Tabachnick BG, Fidell LS (2001). Using Multivariate Statistics (4th ed.). Boston: Allyn & Bacon.
|
|
|
|
Tabachnick B, Fidell L (2007). Using Multivariate Statistics (5th ed.). USA: Pearson Education.
|
|
|
|
Tainini KK (1997) Cooperatives in the New Environment. A Study of the Role of Registrar of Cooperative Societies in selected countries in Asia. FAO, Rome.
|
|
|
|
Vigneshwara V (2003). Cooperative Marketing In India: Challenges and Opportunities. Vivekananda College, Dept. of Economics.
|