ABSTRACT
The purpose of this paper is to verify the impact of a series of company’s variables in small and medium-sized companies, which affect their debts degree. We referred to Giacosa (2015) and Broccardo et al. (2016) as a framework, which identified some company’s variables which impact on its financial structure. Our sample contains small and medium-sized enterprises, belonging to the Italian manufacturing sector. The choice of the manufacturing context is linked to the fact that this sector is the one with the highest population in the Italian economic context and is therefore, a representative of the Italian economy. We identified a series of variables affecting the company’s indebtedness, working in a systemic perspective. Indeed, the company has been considered as a system, in which different factors have specific roles in the business (Ferrero, 1968, 1987) and are linked not through a simple cause-effect relationship; but through a sort of concatenation, and this relationship impacts on the debts recourse. In particular, by observing the survey of the reference sample, a relationship between main variables identified by the literature emerged that permits illustration of the company’s debts degree.
Key words: Company’s indebtedness, debts degree, small and medium companies, financial structure.
Some countries are characterized by small and medium-sized companies, such as in several European countries and especially Italy. Small and medium-sized enterprises represent 99% of the European ones (European Commission, 2016). Consequently, the researchers’ interest in observing their behavior under various observation profiles is very high.
Researchers focused on the financial structure of a company, especially focusing on large-sized companies. Also small and medium-sized companies have been observed especially because they can rely on lesser alternative financing sources than large-sized ones (Broccardo et al., 2016; Busetta and Priest, 2008; Cellini and Rossini, 1990). It results in the need of careful financial management, both in terms of planning of financial requirements, and the funding policy manage-ment (Miglietta, 2004).
A series of studies affirmedt hat Italian small and medium-sized enterprises are characterized by a financial structure markedly dependent on the banking system, less convinced to recourse to the equity (Arcellis, 1994; Belli et al., 2013; Caruso and Palmucci, 2008; Forestieri, 2014; Troisi, 2014). This attitude characterizes not only the Italian economy, but also economies of other countries. Therefore, it is very interesting to identify which variables could impact on the company’s indebtedness.
The purpose is to verify the impact of a series of company’s variables in small and medium-sized companies, which affect their debts degree. In particular, we identified a series of variables affecting the company’s indebtedness, working in a systemic perspective. Indeed, as the company has to be considered as a system, different factors have a specific role into the business (Ferrero, 1968, 1987). They are not linked through a simple cause-effect relationship, but in a sort of concatenation and this relationship impacts on the debts recourse.
We referred to Giacosa (2015) and Broccardo et al. (2016) as a framework, which identified some company’s variables which impact on its financial structure. In addition, we contextualized our survey into the systems theory (Brusa, 2013; Culasso, 1999; Ferrero, 1968 and 1987; Giacosa, 2011).
The originality of the work is coherent of the current context of the reference. Indeed, the context is characterized by significant variability because of economic and normative reasons, presenting a different perspective in the light of companies’ behaviour of the last years. In addition, conditions in which Italian banking systems currently operate and unavailability/inadequacy of financial sources for the companies obliged them to control their indebtedness, as it affects their financial structure.
The research is linked to the company’s need of understanding which company’s variables affect the most their indebtedness, also in terms of monitoring the role of financial external parties.
The research has the structure illustrated above. The literature review is contained into the second paragraph and, in particular, we referred to different variables affecting the companies’ indebtedness. The research method is analyzed in the course of the paper, findings are presented and discussed. Thereafter, the conclusions, implications and limitations of the research are presented.
Researchers focused on a series of aspects belonging to the financial structure of small and medium-sized companies. This phenomenon is of particular interest, both because in some countries small and medium sized companies constitute the main type of company (think for example, that in Europe small and medium-sized companies account for 99% (European Commission, 2016) and because, initially, the main theories of financial structure take into consideration the large enterprises and, more in depth, small and medium-sized ones (Ang, 1991).
Respecting the aim of our research, we focused on a series of aspects which impact on the debts degree of small and medium-sized companies. Below, those factors that have caught more interest are examined (Broccardo et al., 2016): a) The company’s size (Chung, 1993; Confindustria, 2007; Fama and French, 2002; Frank and Goyal, 2003; Sogorb-Mira, 2005): The conclusions are not always coherent. In some opinions, company’s size is not influenced by financial structure and debts degree (Kim and Sorensen, 1986). The relationship between the size of the company and its financial structure has been analyzed in detail. Particularly, a positive correlation emerged between the company’s size and its level of indebtedness, confirmed by the Static trade-off theory (Michaelas et al., 1999; Romano et al., 2000; Sogorb-Mira, 2005). It is mainly due to different levels of Agency costs (Sogorb-Mira, 2005), information imbalances (Fama and Jensen, 1983) and the diversification of different business (Rajan and Zingales, 1995), making a comparison between small, medium-sized and big companies. Referring to Chung (1993), Chittenden et al. (1996) and Titman and Wessels (1988), small and medium-sized companies have greater debt recourse than the big ones, in respect of Pecking Order Theory. In particular, small companies show a greater recourse to short-term debt comparing to big companies, because of difficulties in obtaining long-term debts.
b) The company’s sector: Those belonging to a specific sector could impact on the company’s indebtedness; indeed, companies operating in different sectors are characterized by different financial structures (Scott and Martin, 1975; Michaelas et al., 1999; Harris and Raviv, 1991; Riding et al., 1994). For instance, a lower bank debts’ degree characterized the industry sector compared to other ones, as typically, companies have a higher level of self-financing (Miglietta, 2004). Other studies affirmed that the observation has to be made according to specific companies, and not only in terms of a specific sector (Balakrishnan and Fox, 1993; Michaelas et al., 1999; Romano et al., 2000). Studies focused on manufacturing sector, trade and services which occasionally obtained discordant results (Bradley et al., 1984; Frank and Goyal, 2009; Titman and Wessels, 1988).
c) The age of the company: Different opinions on the topic emerged. Gaud et al. (2005), Petersen and Rajan (1994) and Van Der Wijst (1989) concluded that the company’s age influences on the financial structure, due to its life cycle. In particular, older companies could count on higher accumulated profits, reducing their needs in terms of external financial sources. On the contrary, Chittenden et al. (1996) confirmed that the company’s age does not impact on the financial structure, while Dollinger (1995) stated that rather the company’s economic conditions over time impact on the financial structure rather than the age of the company;
d) The company’s growth perspectives, as they impact on the company’s financial needs (Becchetti and Trovato, 2002; Dallocchio, 2011; Fazzari et al., 1988; Carpenter and Petersen, 2002; Frielinghaus et al., 2005; Herrera, and Minetti, 2007; Honjo and Harada, 2006; Gregory et al., 2005; La Rocca et al., 2011; Oliveira and Fortunato, 2006): Small-sized companies could use limited growth opportunities due to different environment’s constraints (Penrose, 1984). Additionally, this growth perspectives have been differentiated depending on the phase of the company’s life cycle (Banca Intesa, 2000; Berger and Udell, 1988; Dessy and Vender, 1996; Dickinson, 2011; Fluck, 1999; Rija, 2006). In addition, companies with a higher investment growth rate and a more marked diversification have a higher indebtedness degree level (Hall et al., 2000; Michelas et al., 1999; Venanzi, 2003). Michaelas et al. (1999), Aybar et al. (2001), Sogorb-Mira (2005), Titman and Wessels (1988) stated that small and medium-sized enterprises with high opportunities of growth are more indebted than those with limited or absent opportunities for growing. Some scholars stated that there is a positive relationship between growth opportunities and financial position; however, it was not statistically significant (Chittenden et al., 1996; Jordan et al., 1998).
e) Repay’s attitude of financial debts (Culasso, 2009, 2012): The company’s attitude in generating constant financial cash-flows through operating activity influenced the recourse to external debts (Giacosa, 2012a, b), as the level of indebtedness decreases when this risk increases. If the cash-flow from operating activities is not sufficient to meet financial needs of management, the most widely used sources of funding is the bank debt (preferred than the stock market) (Dessy, 1995; Galbiati, 1999; Miglietta, 2004; Partner Equity Markets, 2009; Venanzi, 1999).
f) Revenues: Lower sales are generally combined to a higher level of debts (Confindustria, 2007; Partner Equity Markets, 2009), as financial resources derive also from the revenues, in terms of the collection of trade receivables (Miglietta, 2004);
g) Profitability: First, bank debt represents the most used source of financing if operating activity cash flow is not sufficient (Caselli, 2002; Dessy, 1995; Galbiati, 1999; Miglietta, 2004; Onado, 1986; Partner Equity Markets, 2009). The relationship between the profitability and financial structure is negative, as more efficient companies are characterized by lower level of indebtedness. Indeed, they tend to prefer internal financial resources (Centrale dei Bilanci, 2003; Chittenden et al., 1996; Myers, 1984; Holmes and Kent, 1991; Venanzi, 2003), for maintaining the control over the company.
The sample
Our sample is composed of Italian economic context and considered period is 2012-2014. We considered manufacturing companies, as manufacturing sector is the main representative sector in Italy context. We used Aida Bureau Van Dijk database (containing economic-financial information on over one million Italian companies), referring to Ateco’s economic activities adopted by ISTAT.
Manufacturing companies in the sample have the following criteria (Broccardo et al., 2016):
i) active limited companies;
ii) non-listed companies;
iii) available companies’ financial statements 2012, 2013 and 2014 not prepared in accordance with International Accounting Standards;
iv) companies with the average production value between 5-50 million euro. Small companies have revenues between 5 and 10 million euro, while medium-sized ones between 10 and 50 million euro (European Union Recommendation n.361 from 2003). Large-sized companies have been excluded from the sample for maintaining certain homogeneity of the sample;
v) companies whose financial statements containing all information for calculating indicators.
We excluded companies containing outlier values. Meanwhile, the final sample is composed of 6.198 Italian manufacturing companies.
Research Question: Which variable has the biggest impact on the company’s indebtedness?
The research methodology may be illustrated through the following steps:
i) identification of the dependent variable (that is debts degree) according to the research purpose;
ii) identification of the variables which influence the debts degree of small and medium-sized companies (independent variables). These variables have been identified on the basis of literature, having as objective the companies’ financial structure in terms of debts;
iii) model’s creation.
A) Dependent variable
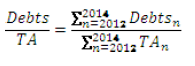
The dependent variable is represented by the company’s debts degree (using Debts/Total Assets), which analyze which part of the company’s investment is financed by external debts. Moreover, it allows evaluating, even indirectly, the balance between internal and external financing sources:
where:
Debtsn = Total debts in the year n
TAn = Total assets in the year n
n = year, which can mean 2012, 2013 and 2014
B) Independent variables
The following variables influence the debts degree (Broccardo et al., 2016):
a) Company’s growth: The company’s growth could be measured both quantitatively (through sales, production value, added value, number of employees, invested capital, market share, etc.) and qualitatively (with reference to multiplicity of internal factors linked to the development of new skills and for improvement of those already owned). In the current analysis, we referred to quantitative terms. The company’s growth in quantitative terms has been observed with a special reference to the following aspects of observation:
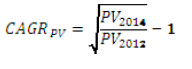
i) production value, by using CAGR indicator (Compound Annual Growth Rate) on the production value on the period 2012-2014. The basis of this choice is the fact that CAGR permits to neutralize the effects of growth rates volatility calculated in individual years:
where:
PV2014 = company’s production value in 2014
PV2012 = company’s production value in 2012
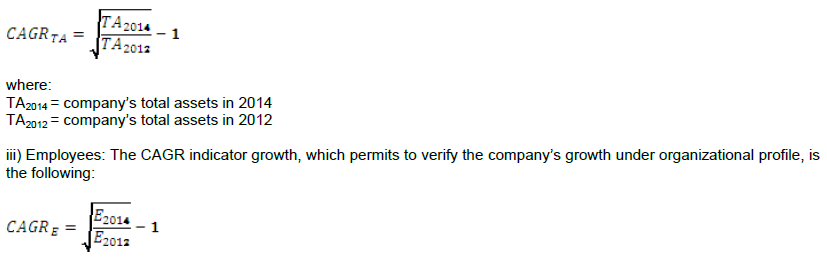
ii) Invested capital: The CAGR indicator on invested capital has been calculated over the three-year period. This formula indicates the company’s growth:
where:
TA2014 = company’s total assets in 2014
TA2012 = company’s total assets in 2012
iii) Employees: The CAGR indicator growth, which permits to verify the company’s growth under organizational profile, is the following:
where:
E2014 = employees number in 2014
E2012 = employees number in 2012
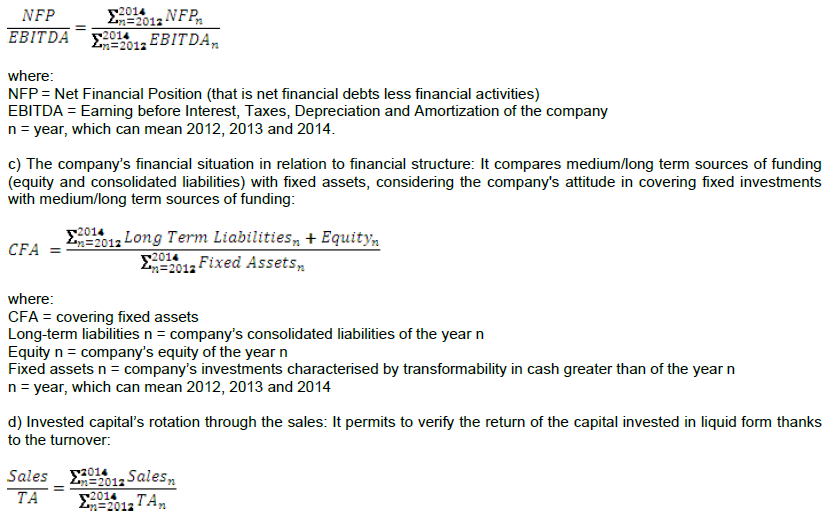
b) Repay’s attitude of financial debts thanks to the operating activities: This indicator represents a financial risk indicator of each company. Indeed, the greater this indicator, the greater is the risk for difficult financial situation. EBITDA is a particularly indicative value, as it affects the operating activity’s ability to create financial resources. The sales (contemplated in EBITDA) give rise to receivables, collection of which provides financial sources that can be used to pay financial debts:
where:
Salesn = company’s sales realized over the year n
TAn = invested capital (total assets) of the year n
n = year, which can mean 2012, 2013 and 2014
e) Company’s age: We consider the natural logarithm of the years from the constitution of the company, in order to verify the level of its age:
Age = ln (number of years since the company’s foundation)
where:
Age = age of the company
ln = natural logarithm
f) Company’s size: The size has been measured in terms of natural logarithm of the sales.
Size= log (average sales in three-year period)
where:
Size = company’s size
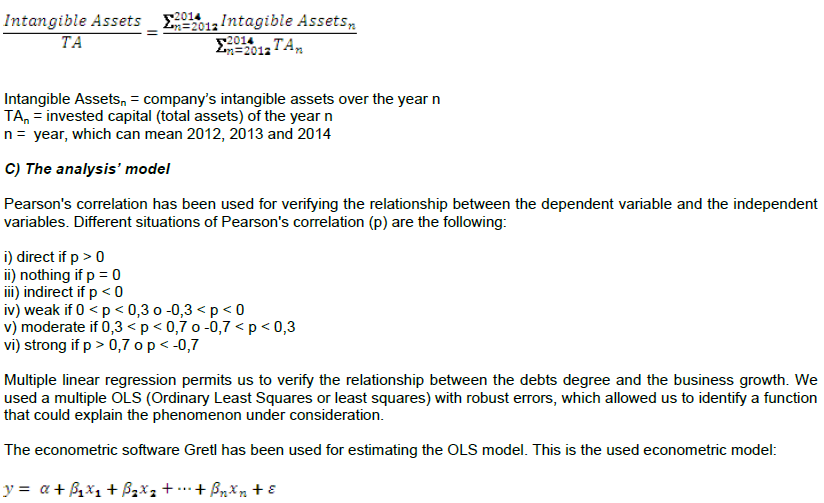
g) Impact of intangible assets on invested capital: Because of relevance of intangible assets in influencing the company’s growth opportunities, it was decided that this parameter be taken into account. In particular, we compared intangible assets to total invested capital for verifying their representativeness in the investment strategy:
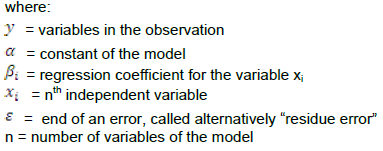
We then use the R-correct framework for verifying the goodness of the model. Subsequently, we made an analysis of emerging residues deriving from multiple linear regression. It permits to verify the normality of residuals. Lastly, we used the residue normality test and the graph Q-Q plot for evaluating the normality of the residues.
The study findings have been illustrated as both correlation matrix and multivariate analysis.
Correlation matrix
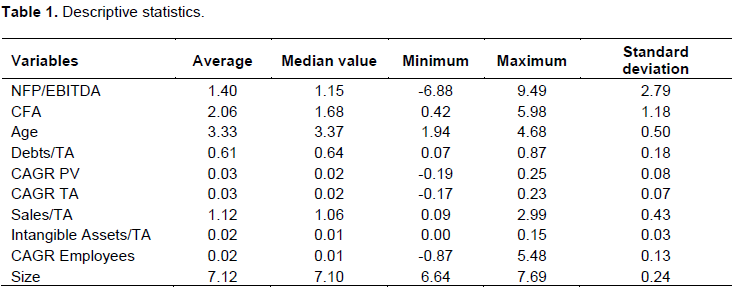
In the Table 1 descriptive statistics of the variables included in our model are presented. For each variable the average, median value, minimum, maximum and standard deviation have been calculated.
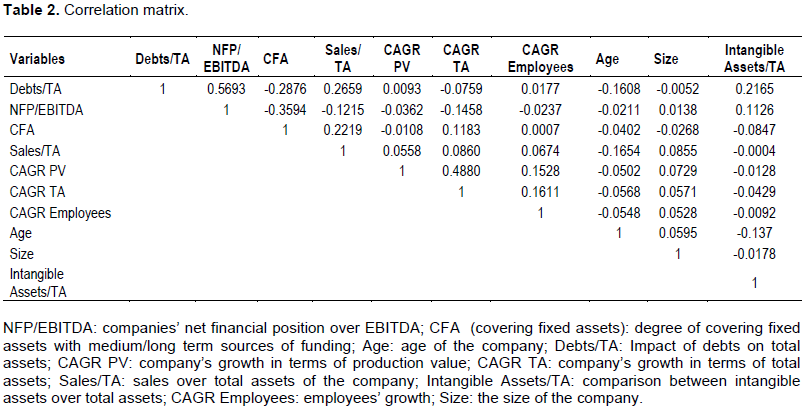
Each variable may assume values varying between a minimum of 7% and a maximum of 90%. On average, the companies finance their activity by recourse to third parties funds, equal to 62%. Table 2 contains information about variation and co-variation matrix.
It emerged a moderate correlation between the dependent variables, on one side, and the independent variable, on the other. In particular, the correlation results is weak for the following variables: CFA, Sales/TA, age, size, growth in terms of production value, growth in terms of total assets and employees. Dependent variables and individual dependent variables are linked with a positive relation, while the relation between CFA, growth in terms of total assets, age and size is negative.
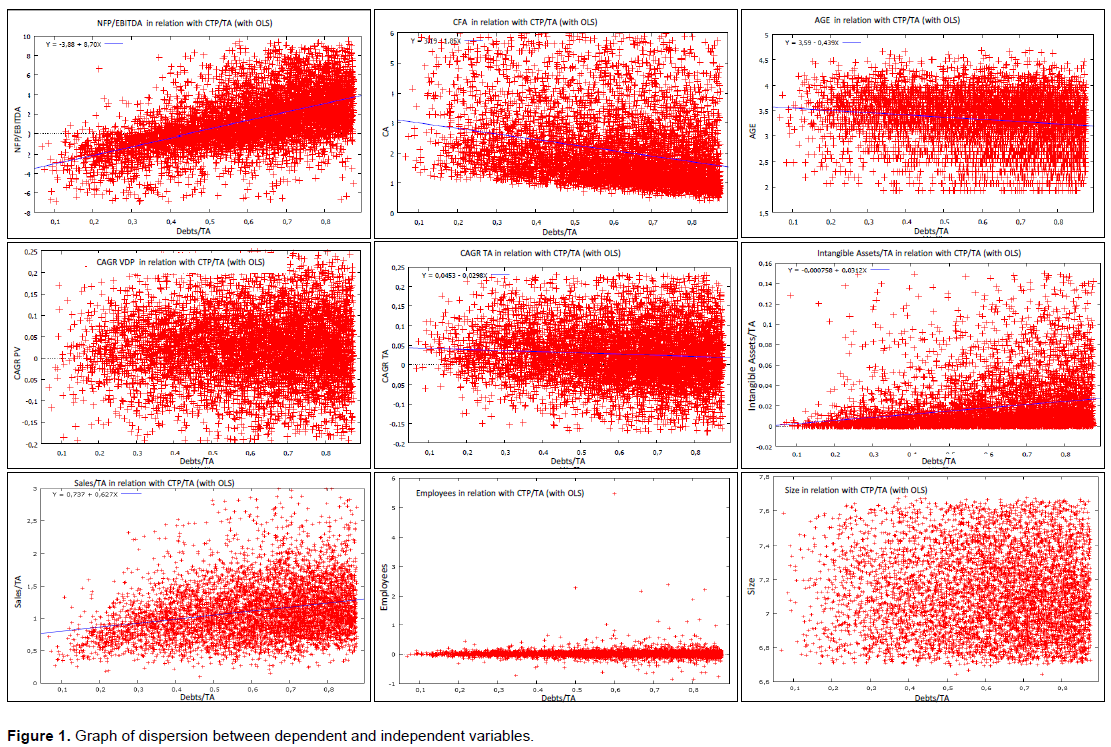
Figure 1 represents the graph of dispersion between dependent and independent variables (Figure 1). It emerged that it is possible to present graphically the relation between depended variable (Debts degree) and the individual variables (such as NFP/EBITDA, CFA, Age, Growth in terms of invested capital, Sales/TA and Intangible Assets/TA). On the contrary, the relation between dependent variable (Debts degree) and any other individual independent variable (such as growth in terms of production value, growth in terms of employees and the company’s size) cannot be presented on the graph.
Multivariate analysis
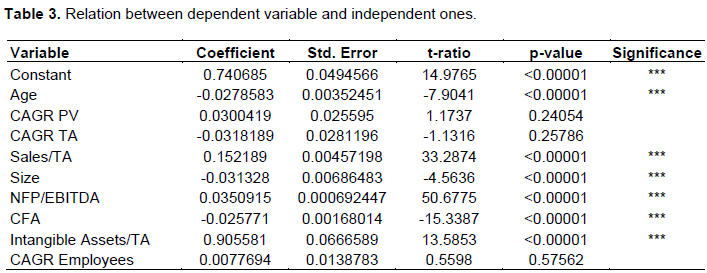
The dependent variable was regressed (using the OLS) on independent variables in order to verify the relation between dependent variables and independent ones (Table 3).
All variables (except variables measuring the companies’ growth) are significant. The t-ratio [(estimating value – value under null hypothesis)/ estimating standard error] (equal to 14.9765 for the constant, 50.6775 for NFP/EBITDA, -15.3387 for CFA, -7.9041 for the company’s age, 33.2874 for Sales/TA, -4.5636 for the company’s size) is not contained in the interval between -1.96 and 1.96. Additionally, this values are out of the interval between -2.58 and 2.58 (which corresponds to a p-value of 1% two-tailed).
Otherwise, the relations t for the growth of total assets (0.25786), for the growth in terms of production value (-0.24054), and for the growth in terms of number of employees (0.57562) are contained in the interval -1.96/1.96, as the variables are significant, and it doesn’t exist a relation between growth and debts degree (Table 4).
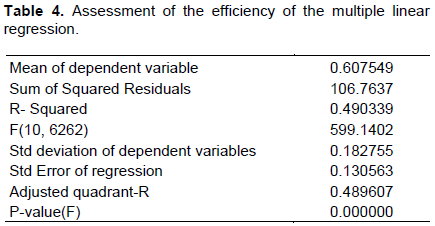
The average of dependent variable is 0.607549, as debts degree is on average equal to 60.75%. Standard deviation of dependent variables is 0.182755, referred to variability of the individual observations.
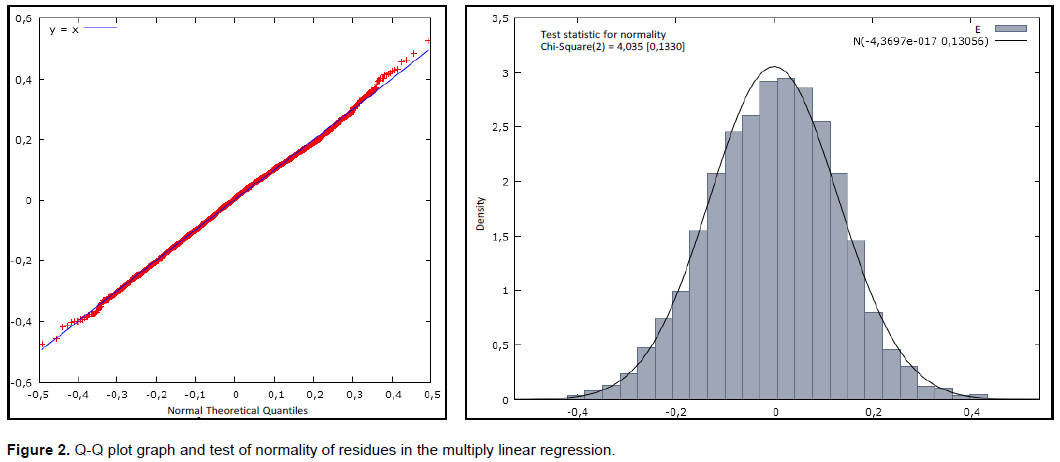
We conducted an analysis on residues from the multiple linear regressions for evaluating the model’s effectiveness. We used the Q-Q plot graph, comparing the quintiles emerged from a normal distribution with those from the distribution of residues (Figure 2).
It emerges almost perfect overlap of the quintile of two distributions (one normal and one of the residues), that is the residues seem to be a normal distribution. Moreover, observing the normality tests conducted on the residues, it emerges acceptance of null hypothesis of normality at the level of 5% (or even of 10%), because its p-value is equal to 0.1330. This element is important to assess the model’s quality.
Taking into account the correlation matrix, it is possible to affirm that the correlation between the growth in terms of production value and growth in terms of total assets is moderate. Therefore, in the regression model it was also included a parameter that considers the joint effect which the growth in terms of value of production and in terms of invested capital have on the debts degree.
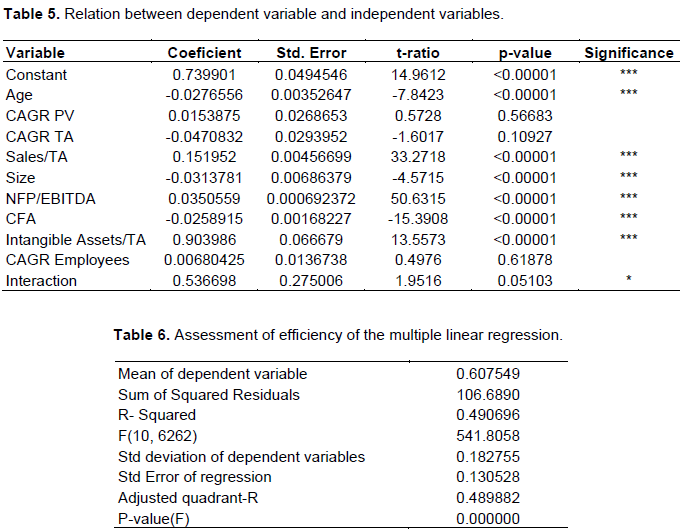
The regression’s results are presented below (Table 5). It shows that all of the variables (except the ones that measure the company's growth) are significant. The interaction term (CAGR PV and CAGR TA) is significant at a significance level of 10%, considering that the corresponding p-value indicates acceptance of the hypothesis of the presence of a growth effect for values greater than 0.05103. Below, the efficiency of the multiply linear regression is exposed (Table 6).
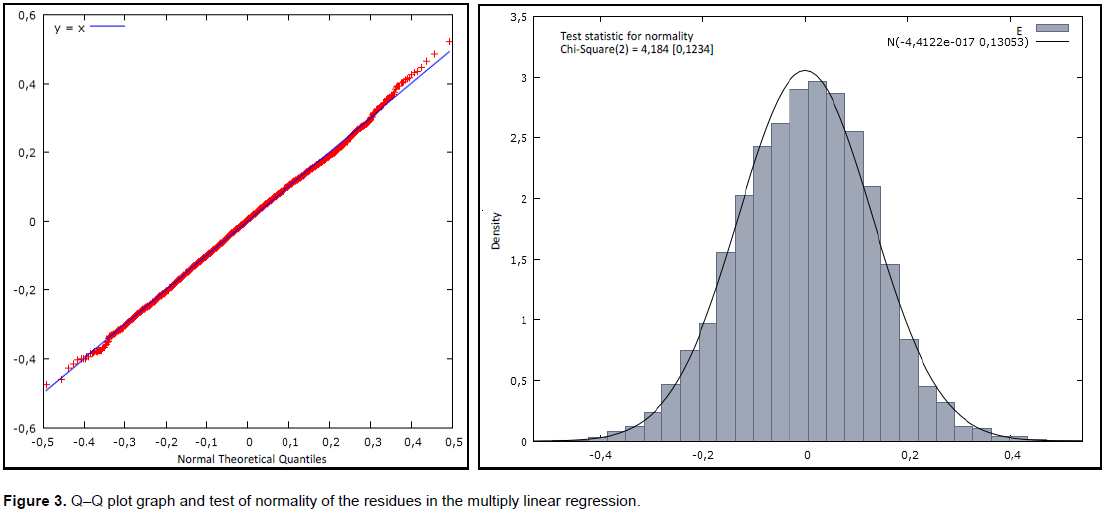
It emerges that the Sum of Squared Residuals slightly decreases in comparison to the first model illustrated, passing from 106.7637 to 106.6890, while the standard error of the regression passes from 0.130563 to 0.130528. Also correct quadrant-R records a slight improvement, from 48.96% to 48.99%. Below, the analysis conducted on the regressions’ residues is illustrated (Figure 3).
It emerged that the quintiles of two distributions (the normal one and the one of the residues) overlap almost perfectly, meaning that the residues are considered as a normal distribution. In addition, the normality test conducted on residues leads to acceptance of null hypothesis of normality at level of 5% (or even of 10%), because the relative p-value is equal to 0.1234. This fact constitutes an important element in assessing the quality of the model.
Referring to our RQ, different aspects emerge according to the different analyzed variable in our model: the company’s age, the growth in terms of production value, the company's size, company's ability to repay debts, coverage of fixed assets thanks to medium-long term funds, the growth opportunities.
In terms of the company’s age, it emerged that the debts degree decreases when the company’s age increases. Indeed, higher accumulated profits emerge when the years of the company’s activity increase (if other things being equal). Consequently, new debts are not due.
Second, regarding growth in terms of production value, total assets and number of employees, there is not a relationship between the individual variables and the degree debts.
Third, according to the company's size, small companies recourse more frequently to external sources of financing, because the companies can count on higher profits. It is observed that the findings are in line with the trade off theory.
In terms of company's ability to repay debts, this variable is positively correlated with the debts degree: when the indicator’s increase, we observed an increase of debts degree. This is in contrast with the literature for the large-sized companies; indeed, when the increase of the company’s risk level occurs, the debts degree decreases. On the contrary, it is in accordance with previous studies on small and medium-sized companies. For instance, British companies are characterized by a positive relationship between operational risk level and level of the company’s debt (Michelas et al., 1999).
Regarding the coverage of fixed assets thanks to medium-long term funds, the companies whose long-term investments are financed with a medium-long term funds are characterized by less debts. In addition, when we consider the growth opportunities, a positive relationship with debts emerged. This means that companies with higher growth opportunities have a higher recourse to debt. More in depth, the companies that investment especially in intangible assets, very often tend to use debts.
CONCLUSIONS, IMPLICATIONS AND LIMITATIONS
In this paper, we identified a series of variables which affect the company’s indebtedness, if they are contextualized in a systemic perspective. Indeed, the impact of above mentioned variables on the indebtedness has to be understood not as simple cause-effect relationship: if the company is a system consisting of interrelated and connected elements, the relations which unite them, creating a circuit of concatenation between variables, which can impact on the recourse to the debts.
In particular, by observing the survey of the reference sample, it emerged that there exists a relationship between the main variables identified by the literature, that allows illustration of the debts degree. More specifically, our final considerations are as follows.
Firstly, the debts degree decreases when the company’s age increases (assuming other conditions being equal). This is due to the fact that the profits accumulated permit the company to count on internal financial resources, reducing its recourse to debts.
Secondly, in terms of growth, there is not a relationship between the individual variables and the debts degree (which means between the growth in terms of production value and the debts degree, the growth in terms of employees and the debts degree, and the growth in terms of invested capital and the debts degree). Nevertheless, a positive relationship emerged between the interaction of two variables (meaning between growth in terms of production value and total assets’ growth), on the one hand, and debts degree, on the other. Therefore, small and medium-sized companies growing both in terms of investment and production value, require additional external debts.
Thirdly, a debts degree increase is also linked to an increase of rotation degree of invested capital. Indeed, for strengthening the business structure, capable of increasing the rotation of invested capital, new financial resources are due.
Fourthly, the debts degree is also positively correlated due to the company’s ability to reimburse the debts. Indeed, when own resources are able to repay the debts, the company has an attitude to timely respect financial liabilities. Therefore, it increases the use of debts, both because this attitude is enhanced in the phase of request of the new external financial resources from banking institution or other funders, and because the company feels more robust in its ability to meet its financial commitments.
Contextualizing the scope of research in systems theory (Ferrero, 1968, 1987), a need to consider the combination of a number of variables and the weight of debts emerged. Consequently, each component of the company’s system should be considered in its interdependence, and the relationships between them are linked by an extensive network of relationships. Therefore, the debts degree phenomenon could not be analyzed by outlining a simple cause-effect relation between two individual variables, but it requires more indepth consideration.
The research is characterized by theoretical and practical implications:
i) According to theoretical implications: We create a general reference model which permits explanation of the trend of the debts degree phenomenon contextualized to the systems theory, thanks to the recourse of a series of interdependent company’s variables. These implications may be interesting both for the management and the ownership, as the proposed model permits evaluation of the decisions’ effects regarding certain corporate variables in terms of the company’s indebtedness;
ii) According to practical implications: The proposed model has been analyzed in two different ways. The size of the sample, as our model has been applied to a large number of enterprises operating in many sectors; the sector relevance permits to find specific features of each sector.
Limitations of the research could be stated as follows:
i) About the sample: our sample is composed of a single economic sector (the manufacturing sector), as it is the most representative one in the Italian economy. Therefore, our model does not highlight the impact of the “economic sector” variable on the debts degree, which could influence on its trend;
ii) About the method used: our model does not include qualitative variables, which could explain the debts degree. For instance, we did not consider the customers and employees’ satisfaction level, the uniqueness of the product range and the personalization’s degree;
iii) About the variable “debts degree”: we did not make a distinction in terms of debts deadline (medium/long-term debt, and short-term debt). It could permit to verify the impact on certain attitudes of the companies in terms of the choice of financing.
The authors have not declared any conflict of interests.
REFERENCES
|
Ang J (1991). Small business unqiueness and the theory of financial management. J. Small Bus. Financ. 1(1):1-13.
|
|
|
|
Arcelli M. (1994). Il finanziamento delle piccole e medie imprese: situazione attuale e prospettive. Economia italiana 3(1):2-28.
|
|
|
|
Balakrishnan S, Fox I (1993). Asset specificity, firm heterogeneity and capital structure. Strat. Manage. J. 14(1):3-16.
Crossref
|
|
|
|
Banca Intesa (2000). Le piccole e medie imprese italiane. Un'analisi sui dati di bilancio, FrancoAngeli, Milano.
|
|
|
|
Becchetti L, Trovato G (2002). The Determinants of growth for small and medium sized firms. The role of the availability of external finance. Small Bus. Econ. 19(4):291-306.
Crossref
|
|
|
|
Belli M, Facile E, Medioli G (2013). Credito per le PMI. Come farsi finanziarie l'azienda dalle banche. Il Sole 24 Ore, Milano.
|
|
|
|
Berger A, Udell G (1988). The economics of small business finance: the roles of private equity and debt markets in the financial growth cycle. J. Bank. Financ. 22(6-8):613-673.
Crossref
|
|
|
|
Bradley M, Jarrell GA Kim EH (1984). On the existence of an optimal capital structure: Theory and evidence. J. Financ. 39(3):857-878.
Crossref
|
|
|
|
Broccardo L, Halili E, Ferraris A, Mazzoleni A (2016). Why the company's debts degree vary, when considering the company as a system?, in Proceedings of 9th Annual Conference of the EuroMed Academy of Business "Innovation, Entrepreneurship and Digital Ecosystems", Warsaw, Poland, September 14-16. pp. 377-392.
|
|
|
|
Busetta G, Presbitero AF (2008). Confidi, piccole imprese e banche: un'analisi empirica", in Zazzaro A I vincoli finanziari alla crescita delle imprese. Carocci, Roma.
|
|
|
|
Carpenter R, Petersen B (2002). Is the growth of small firms constrained by internal finance. Rev. Econ. Statistics 84(2):298-309.
Crossref
|
|
|
|
Caruso A, Palmucci F (2008). Scelte di finanziamento della crescita: un'indagine sulle PMI Italiane. Banca Impresa Società. 3(1):453-476.
|
|
|
|
Caselli S (2002). Corporate banking per le piccole e medie imprese. Bancaria Editrice, Roma.
|
|
|
|
Cellini R, Rossini G (1990). Piccole e medie imprese e scelte finanziarie. Sipi, Roma.
|
|
|
|
Centrale dei Bilanci (2003). Economia e finanza delle imprese italiane, XVI Rapporto. Bancaria Editrice, Roma.
|
|
|
|
Chittenden F, Hall G, Hutchinson P (1996). Small firm growth, access to capital markets and financial structure: Review of Issues and an empirical investigation. Small Bus. Econ. 8(1):59-67.
Crossref
|
|
|
|
Chung KH (1993). Asset Characteristics and corporate debt policy: an empirical test. J. Bus. Financ. Account. 20(1):83-98.
Crossref
|
|
|
|
Confindustria (2007). Finanza e sviluppo, gli strumenti a disposizione delle PMI. Confindustria, Roma.
|
|
|
|
Dallocchio M, Tzivelis D, Vinzia MA (2011). Finanza per la crescita sostenibile. Egea, Milano.
|
|
|
|
Dessy A (1995). Politiche finanziarie e indebitamento nelle piccole e medie imprese. Egea, Milano.
|
|
|
|
Dessy JA, Vender J (1996). Capitale di rischio e sviluppo dell'impresa. Egea, Milano.
|
|
|
|
Dickinson V. (2011). Cash flow patterns as a proxy for firm life cycle. Account. Rev. 86(6):1969-1994.
Crossref
|
|
|
|
Dollinger M (1995). Entrepreneurship: Strategies and Resources. Irwin/Austen Press, Flossmoor IL.
|
|
|
|
European Commission (2016). Entrepreneurship and Small and medium-sized enterprises (SMEs).
View
|
|
|
|
Fama EF, French KR (2002). Testing Trade-Off and Pecking Order Predictions about Dividends and Debt. Rev. Financ. Stud. 15(1):1-33.
Crossref
|
|
|
|
Fama EF, Jensen MC (1983). Separation of Ownership and Control. J. Law Econ. 26(2):301-326.
Crossref
|
|
|
|
Fazzari S, Hubbard G, Peterson B (1988). Financing Constraint and Corporate Investments. Brooking Papers on Economic Activity 19(1):141-195.
Crossref
|
|
|
|
Ferrero G (1968). Istituzioni di economia d'azienda. Giuffré, Milano.
|
|
|
|
Ferrero G (1987). Impresa e management. Giuffré, Milano.
|
|
|
|
Fluck Z (1999). Capital structure decisions in small and large firms: a life-cycle theory of financing. NYU Working Paper No. FIN-99-069, October.
View
|
|
|
|
Forestieri G (2014). I nuovi canali di finanziamento delle imprese. Minibond, cartolarizzazioni, capitale di rischio. Bancaria 6(1):3-15.
|
|
|
|
Frank MZ, Goyal VK (2003). Testing the pecking order theory of capital structure. J. Financ. Econ. 67(2):217-248.
Crossref
|
|
|
|
Frank MZ, Goyal VK (2009). Capital structure decisions: Which factors are reliably important. Financ. Manage. 38(1):1-37.
Crossref
|
|
|
|
Frielinghaus A, Mostert B, Firer C (2005). Capital structure and the firm's life stage. South Afr. J. Bus. Manage. 36(4):9-18.
|
|
|
|
Galbiati P (1999). La struttura finanziaria delle imprese: Modelli teorici e scelte operative. Egea, Milano.
|
|
|
|
Gaud P, Jani E, Hoesli M, Bender A (2005). The capital structure of Swiss Companies: An empirical analysis using dynamic panel data. Eur. Financ. Manage. 11(1):51-69.
Crossref
|
|
|
|
Giacosa E (2015). Fabbisogno finanziario ed indebitamento nelle piccole medie imprese. FrancoAngeli, Milano.
|
|
|
|
Gregory B, Rutherford M, Oswald S, Gardiner L (2005). An empirical investigation of the growth cycle theory of small firm financing. J. Small Bus. Manage. 43(4):382-392.
|
|
|
|
Hall G, Hutchinson P, Michaelas N (2000). Industry effects on the determinants of unquoted SMEs capital structure. Intl. J. Econ. Bus. 7(3):297-312.
Crossref
|
|
|
|
Harris M, Raviv A (1991). The theory of capital structure. J. Financ. 46(1):297-355.
Crossref
|
|
|
|
Herrera AM, Minetti R (2007). Informed finance and technological change: Evidence from credit relationship. J. Financ. Econ. 83(1):225-269.
Crossref
|
|
|
|
Holmes S, Kent P (1991). An Empirical Analysis of the financial structure of small and large Australian manufacturing enterprises. J. Small Bus. Financ. 1(2):141-154.
|
|
|
|
Honjo Y, Harada N (2006). SME policy, financial structure and firm growth: Evidence from Japan. Small Bus. Econ. 27(4):289-300.
Crossref
|
|
|
|
Jordan J, Lowe J, Taylor P (1998). Strategy and financial policy in U.K. small firms. J. Bus. Financ. Account. 25(1):1-27.
Crossref
|
|
|
|
Kim WS, Sorensen EH (1986). Evidence on the impact of the agency costs of debt on corporate debt policy. J. Financ. Quantit. Anal. 21(2):131-144.
Crossref
|
|
|
|
La Rocca M, La Rocca T, Cariola A (2011) Capital structure decisions during a firm's life cycle. Small Bus. Econ. 37(1):107-130.
Crossref
|
|
|
|
Michaelas N, Chittenden F, Poutziouris P (1999). Financial policy and capital structure choice in U.K. SMEs: Empirical evidence from company panel data. Small Bus. Econ. 12(2):113-130.
Crossref
|
|
|
|
Miglietta N (2004). La struttura finanziaria obiettivo nel sistema impresa. Giappichelli, Torino.
|
|
|
|
Myers SC (1984). The capital structure puzzle. J. Financ. 39(3):575-592.
Crossref
|
|
|
|
Oliveira B, Fortunato A (2006). Firm growth and liquidity constraints: A dynamic analysis. Small Bus. Econ. 27(1):139-156.
Crossref
|
|
|
|
Onado M (1986). Sistema finanziario e industria. Il Mulino, Bologna.
|
|
|
|
Partner Equity Markets (2009). Il mercato di borsa per le PMI: Aim Italia. Il Sole 24 Ore, Milano.
|
|
|
|
Penrose E (1984). La posizione delle grandi e delle piccole imprese in un sistema economico in espansione, in AA.VV., Introduzione alla finanza delle piccole e medie imprese. Unicopli Universitaria, Milano.
|
|
|
|
Petersen MA, Rajan RG (1994). The Benefits of Lending Relationships: Evidence from small business data. J. Financ. 49(1):3-37.
Crossref
|
|
|
|
Rajan RG, Zingales L (1995). what do we know about capital structure? Some evidence from international data. J. Financ. 50(5):1421-1460.
Crossref
|
|
|
|
Riding A, Haines, GH, Thomas R (1994). The Canadian Small Business-Bank Interface: A Recursive Model. Entrep. Theory Pract. 18(4):5-24.
|
|
|
|
Rija M (2006). L'investimento istituzionale nel capitale di rischio delle piccole e medie imprese. FrancoAngeli, Milano.
|
|
|
|
Romano CA, Tanewski GA, Smyrnios KX (2000). Capital structure decision making: A model for family business. J. Bus. Venturing 16(3):285-310.
Crossref
|
|
|
|
Scott DF, Martin JD (1975). Industry influence on financial structure. Financ. Manage. 4(1):67-73.
Crossref
|
|
|
|
Sogorb-Mira F (2005). How SME uniqueness affects capital structure: Evidence from a 1994–1998 Spanish data panel. Small Bus. Econ. 25(5):447-457.
Crossref
|
|
|
|
Titman S, Wessels R (1988). The determinants of capital structure choice. J. Financ. 43(1):1-19.
Crossref
|
|
|
|
Troisi G (2014). Come finanziare le PMI. Ipsoa, Milano.
|
|
|
|
Van Der Wijst D (1989). Financial Structure in Small Business, Theory, Tests and Applications. Springer-Verlag, Berlin.
Crossref
|
|
|
|
Venanzi D (1999). La scelta della struttura finanziaria: teoria ed evidenza empirica. Utet, Torino.
|
|
|
|
Venanzi D (2003). Le decisioni di struttura finanziaria delle imprese italiane. Morlacchi, Perugia.
|