ABSTRACT
This study aims to evaluate the influence of service dimensions’ satisfaction on hotel guest’s overall satisfaction. Confronting the theory originally stated with the specificity of satisfaction in the hotel sector, we developed hypotheses linking each of the service dimensions with overall satisfaction declared by the consumer. The data collected with a questionnaire were analyzed through a series of Multiple Component Analysis, cross-tabulations and Pearson Chi-square tests. Interpretation of the results allows us to reach the conclusion that three dimensions (groups of attributes) only out of the six initially considered contribute to overall satisfaction that is, service availability, interaction with the service provider and services received. The results of this research provide hotel managers with specific information. The first information is that word of mouth is one of the most important sources of information for hotel guests in Cameroon, so managers of these institutions should work towards stimulating it. Moreover, in order to increase guests’ overall satisfaction, it is necessary to improve their satisfaction with the aforementioned service dimensions.
Key words: Service dimension, overall satisfaction, word-of-mouth.
Competition in the hotel sector is becoming increasingly harsh and seems to be accentuated by the fact that hotels in the same category offer services of the same level of quality. The question on how to undersell rivals and lead the market is a permanent concern for hotel managers. Thus, continuous quality improvement and its corollary customer satisfaction seem to be profitable strategies. Customer satisfaction has been one of the major themes studied in marketing research for the past thirty years (Oliver, 1980; Churchill and Surprenant, 1982; Yi, 1990; Fornell, 1992; Evrard, 1993; Anderson et al., 1994; Oliver, 1997). Tsaur et al. (2006) in Akyildiz and Argan (2010) believe that satisfaction is much more important for services because of their characteristics which increase the risk perceived by the customer. Measuring and managing customer satisfaction is a guarantee of survival, development and success in service industries. Today, services are dominant in all economic systems (Tam, 2006; Jensen, 2011; Petri et al., 2012), which makes research to focus more attention on this sector (Olorunniwo et al., 2006). The service sector is likely to become a dominant force in developed countries, accounting for between 70 and 85% of gross national product (GNP) and about ¾ of jobs (Johnston and Mitchel, 2008).
This sector is also growing rapidly in developing countries such as Kenya, South Africa, etc., where it accounts for about 52% of GNP (Hill, 2007) and is supported by the tourism industry. In Cameroon, the tertiary sector groups together, according to the nomenclature of activities in this country, trade, catering, hotels, telecommunications, etc. In 2006, the service sector accounted for 47% of GDP and the growth prospects for this sector for 2007 and 2008 were 3.9 and 4.8% respectively. According to the General census on enterprises carried out by the National Institute of Statistics in 2009, 85.3% of Cameroon companies operate in this sector, compared with 0.4% in the primary sector and 1.4% in the secondary sector. The total number of enterprises in the tertiary sector is 85.109 in number, of which 49.192 are in the wholesale and retail trade, 1.074 in the social and personal services sector, and 1.074 in the hotel and catering industry (the third largest tertiary sub-sector). In terms of labor utilization and turnover, the tertiary sector accounts for 67.8% of total employment and 62% of total business turnover. For the period 2007 to 2011, for example, the tertiary sector has once again positioned itself as the main driver of growth in Cameroon.
The importance of tourism in the economic development of nations has been clearly established in recent years through improvement in statistical tools and the development of satellite accounts. This may explain the increasing interest in the management, and especially the marketing of hotels which constitute the lung of tourism (Reisinger, 2001). Generally, customer satisfaction is very much important because when a customer has problems with a supplier, he talks to nine or ten people around him. Moreover, as shown by Kotler and Keller (2006), studies on consumer dissatisfaction confirm that clients are not satisfied with their purchases in 25% of cases (the company has good reasons to be concerned if these 25% of customers account for a significant share of sales), but only 5% of dissatisfied customers’ complain. The other 95% feel that it is not worth complaining, or they do not know how or where to complain, and may simply switch. If we have the impression that when customers’ are facing the problem of dissatisfaction, the provider will want to improve the service, then the question, “how to do this,” is in another issue. As the authors' views differ, several models have attempted to identify how service dimensions contribute to satisfaction and dissatisfaction including two-factor theory, Oliver (1993) model, Kano’s model, "importance-performance" model, tetraclass model, asymmetric contribution model, etc.
The literature in the field of satisfaction shows two main approaches to satisfaction (Lichtle et al., 2002). The first analyses is the processes that generate satisfaction with regard to the disconfirmation paradigm for example Ngobo, (2000). The second is concerned with the modes of contribution of attributes to overall satisfaction (Evrard, 1993), according to this approach satisfaction is the outcome of attribute-level evaluation (Eusébio and Vieira, 2013); this is the approach we focus on in this research. It should be noted that there is a difference between overall satisfaction and satisfaction with the attributes. Overall, satisfaction is a holistic assessment of the consumer purchase or experience (Anderson et al., 1994; Fornell, 1992), whereas satisfaction with the attributes is a subjective assessment of consumer satisfaction which results from the performance of the attribute (Oliver, 1993). Studies on tourist satisfaction arrive at the conclusion according to which overall satisfaction of the visitor depends largely on his satisfaction with the attributes of the destination; to this effect, Tribe and Snaith (1998) define consumer satisfaction with destination as the point at which the performance of the attributes of the destination exceeds the expectations of the tourist. Whereas, Chen et al. (2016) define it as consumers’ judgment of whether the product or service provides a pleasurable level of consumption-related fulfillment.
This study, which has as main concern the measure of satisfaction focuses on the following main question:
Which service attributes contribute to overall satisfaction in the hotel sector? More precisely we aim at identifying the service dimensions which can be used as leverages in improving overall hotel customer’s satisfaction.
Attribute satisfaction
Attributes are one of the elements that have led to the buyer's identification of a possible response to a need (Filser, 1994). The product can thus respond through its perceived attributes. The general perception of attributes by the buyer is what is commonly called the "image of the attribute" which Lambin (1989) defines as "the set of mental representations both affective and cognitive that an individual or group of individuals associate to the product or the organization". Knowing this set of mental representations is decisive not only for the perception of attributes but also for the identification of actions to be undertaken by the company to better satisfy the expectations of the market. The product seen as a "basket of attributes" requires the purchaser who has a limited processing capacity to know the determining attributes. Venette (1989) considers attributes as a set of physical or subjective characteristics of a product and assumes an evaluation by the consumer who seeks the prioritised or determining characteristics. Brée (1994) highlights the evaluation character by asserting that: "only a very small part of the characteristics is retained in the decision-making". These definitions link the attributes to the intrinsic or extrinsic characteristics of the product. Satisfaction dimensions or service dimensions are characteristics of a service experience. They are usually represented by a group of attributes forming a consistent family. Some authors prefer to use the terms "determinants", "components", "factors" or attributes to designate them.
There are a multitude of dimensions that an organization may want to evaluate. This work focuses on these dimensions’ evaluation. For Westbrook (1983), a retail business should evaluate satisfaction with vendors, retail point environment, products and other factors in the perspective of determining customer satisfaction. Similarly, more sophisticated versions of satisfaction surveys use mono-item measures by sub-processes or by attributes such as Quality-price relationship, response speed, and so on (Mefouté, 2010). Fisk et al. (1990) asserts that, during a complex service experience, the client assesses quality against three elements: participants, process, and physical environment. From an evaluation perspective of the service encounter, other models incorporate these three elements in a somewhat different way: personnel, the physical environment of the service and the process of interaction between the service provider and the customer. Also, many of these models implicitly or explicitly acknowledge that services are usually performed in the presence of multiple customers. For example, the services of airlines, restaurants, hotels, hospitals, etc. are generally available to customers in the same service environment, the consequence being a mutual influence of customer service experiences (Groove and Fisk, 1997).
Overall satisfaction
There is currently no consensus on the definition of satisfaction (Vanhamme, 2002; Giese and Cote, 2000; Yi, 1990). According to Vanhamme (2002), the term satisfaction comes from the Latin term "satis" (enough) and "facere" (do), meaning "to provide what is sought until it is enough". This author also emphasizes the extension of the satisfaction concept beyond the literal definition given by the French-language dictionary (“Petit Larousse illustré”, 2007), which defines satisfaction as "contentment, or pleasure that results from the fulfillment of what someone expects, what someone desires".
Yi (1990) thinks that the definition of satisfaction differs according to the level of specificity, which Vanhamme (2002) names horizontal level type of satisfaction or consumption / purchase experience stage on which satisfaction is judged; one can therefore distinguish among: satisfaction with the product, satisfaction with a purchase decision, satisfaction with a seller, etc. All these types of satisfaction brought together constitute what is termed overall satisfaction which Fornell (1992) defines as a holistic post-purchase evaluation. For Crompton and Love (1995), satisfaction is an emotional state that emerges as a result of an experience with a touristic product.
The link between attributes satisfaction and overall satisfaction
Kivela (1996) states that consumers generally perceive services as a basket of attributes that could be different in their contribution to the evaluation or choice of product or service. Consumer satisfaction can be seen as the customer's point of view on the aspects of the service that are important to him. This definition agrees with the thought of Yoon and Uysal (2005) who state that satisfaction must be viewed from a multidimensional point of view in tourism, i.e. several variables observed must be taken into account in its evaluation. Berry et al. (2002) propose three categories of signals that appear during the service experience: functional signals (the technical quality of the service); mechanical signals (the non-human elements of the service environment); and human signals (the behavior of the provider's employees). The evaluation of the service addresses these three elements. Consumer satisfaction can be assessed by studying the service experience entirely (Iglesias and Guillen, 2004). The attribute package offered by the service provider includes the quality of infrastructure and equipment and staff performance (Sasser et al., 1978), the core service, peripheral services and the production system. All these aspects contribute to consumer satisfaction.
For Zeithaml and Bitner (2000), consumer satisfaction can be assessed by identifying the important attributes and measuring the perception of these attributes and the overall satisfaction. Lehtinen and Lehtinen (1991) believe that the presence of other clients and their behavior influence the interactive dimension of service quality, and this presence may have a greater impact on the quality of the service than contact with staff. In addition, Lovelock (1983) provides some clarification on the evaluation of satisfaction with the service. He asserts that when customers need to be present during the service as it is the case in hotels, their satisfaction with the service will be influenced by the interaction they have with the staff, staff according to Sim et al. (2006) is the essence of hospitality’s definition; the nature of the provider's facilities and equipment, furnishing and constructing facilities that comply with the requirements of a modern guest will attract more guests (Blesic et al., 2011); and may be the characteristics of other customers using the service. Also, problems of location and convenience (opening hours, waiting time, etc.) are of paramount importance, Lee et al. (2010) assert that location which customers value and expect include safety, ease of access (air, train, bus, public transportation and close connection to area attractions such as historic, business and pleasure).
According to Hughes (1991), the dichotomy between overall satisfaction and satisfaction with the attributes is normal in the tourism industry because several services offered by this industry include more than one aspect. In the accommodation sector, several studies have identified attributes that the tourist considers as important in assessing their satisfaction. Atkinson (1988) found that cleanliness, safety, value for money and courtesy of staff determine satisfaction. Knutson (1988) found that the cleanliness of the room, suitability of location, promptness of service, safety and security, and familiarity of staff are important. Choi and Chu (op. cit.) concluded that quality of staff, room quality and value are more influential on tourist satisfaction. Hellstrand (2010) says that price plays a significant role in the perception that guests have about the quality of the hospitality product they are buying. For these guests price may be considered as a guideline for the level of service performance they expect. For Pizam and Ellis (1999), satisfaction with a hosting experience is the overall sum of satisfaction with the elements or attributes of all the products and services which make up the experience. According to Griffin and Hauser (1993), an attribute-level analysis produces better results in tourism, because specific questions are asked in relation to each attribute with a view to determining whether certain attributes are more relevant than others in the prediction of overall satisfaction.
Hypothesis
H1a: Satisfaction with service availability contributes positively and significantly to overall satisfaction
H1b: Satisfaction with service price contributes positively and significantly to overall satisfaction
H1c: satisfaction with infrastructure contributes positively and significantly to overall satisfaction
H1d: satisfaction from the interaction with the service provider contributes positively and significantly to overall satisfaction
H1e: satisfaction with the services received contributes positively and significantly to overall satisfaction
H1f: satisfaction from the interaction with other customers is positively and significantly related to overall satisfaction
The target population of the study is all the potential customers of the classed hotels in the national territory of Cameroon. We were guided in the choice of hotels by quality orientation and number of customers. Five hundred questionnaires were distributed to customers’ and 208 were returned, giving a return rate of 41.6%. The method mostly used for satisfaction surveys in the tourism sector consists, of identifying the most important attributes which determine the attraction of the destination and then asking tourists to evaluate these attributes on a symmetrical one-dimensional scale. On such a scale, the lowest value indicates high dissatisfaction with the attribute, while the highest value indicates high satisfaction with the attribute. All important attributes are therefore measured with a five-point Likert scale: 1 = not satisfied at all; 2 = somewhat not satisfied; 3 = indifferent; 4 = somewhat satisfied; 5 = completely satisfied. Overall satisfaction is measured using the modified scale of Oliver (1997)
Data analysis
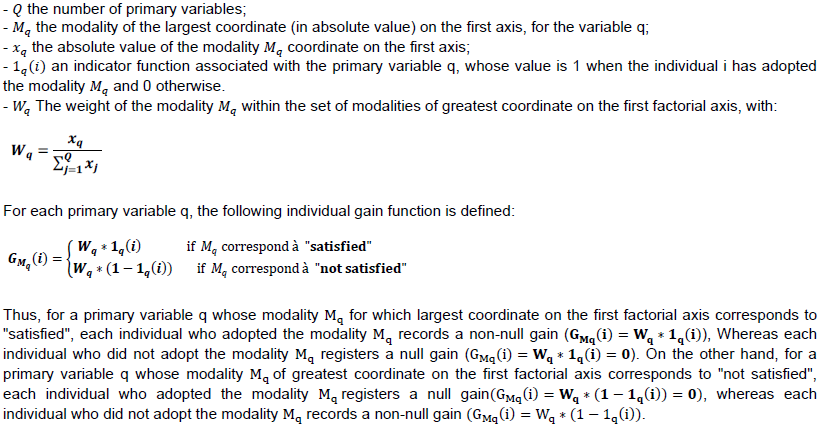
The data was entered in the CS Pro software version 4.2, and the analysis was carried out using SPAD 5.5, SPSS version 18/20 and EXCEL 2007 software. To construct the satisfaction indicator for each of the six dimensions presented above, we considered the set of satisfaction variables under this dimension. The problem to be solved then is how to aggregate these ordinal variables into a single synthetic indicator, which is a good summary of the variability in the different items? The Multiple Component Analysis is used to address this concern. This analysis is first performed with all satisfaction variables under a given dimension, to verify that all variables respect the Ordinal Consistency on the First factorial Axis (OCFA) obtained (which deals with checking for each Variable whether its modalities appear orderly along the first axis). If this is the case, the results of this Multiple Component Analysis are retained. In the contrary, modalities of the variables that do not comply with OCFA are grouped, or those modalities that do not contribute significantly to the determination of the first factor axis are excluded and a new MCA is performed on the new group of variables. From the results of the MCA retained, a summerised indicator of satisfaction is constructed. Let’s consider the following:

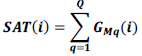
The value of the summarised indicator for the individual is then determined as the sum of his gains on the set of primary variables as follows:
The values ​​of this indicator range from 0 to 1, and an individual is said to be globally satisfied with the dimension considered when his level of satisfaction for this indicator is greater than 0.5.
These results will include the sample’s descriptive results, and the construction of indicators of satisfaction for the various service dimensions considering the methodology that was initially exposed.
Descriptive results of the sample
The sample remains dominated by men (68%) means they are the main customers’ of hotels in Cameroon. This observation is justified on the one hand by the fact that the activities carried out by men make them more mobile than women. Indeed, in his posture as the head of the household, a man is forced to continually seek the welfare of his family, which leads him to reside almost everywhere where he can create an income. On the other hand, the majority of sociological studies have established that in one case out of two, the hotel bill of a woman is paid by a man and satisfaction with the use of a product is more varied for men than for women. Also, the choice of a hotel by the customer is mainly influenced by the hotel's image (about 46% of the respondents chose the hotel in which they stayed because of the good image of the group to which the hotel belongs). Only two people out of ten choose their hotel based on price; In general hotels of the same category are supposed to offer services of the same level of quality, under such conditions, the rational customer would logically choose the hotel that charges the lowest prices. It should be noted that 27% of hotel guests choose their hotel based on its closeness to an important place. This place is either the place where they stay when visiting a country or their work site. As a result, newly-established hotels should develop partnerships with renowned groups or hotel chains in order to succeed, as they benefit from their image. Another important aspect which should not be neglected is location.
Construction of satisfaction Indicators for service dimensions
We are going to show details on the way indicators were constructed for two dimensions, and for the other dimensions only comments of the results will be presented.
Availability of services
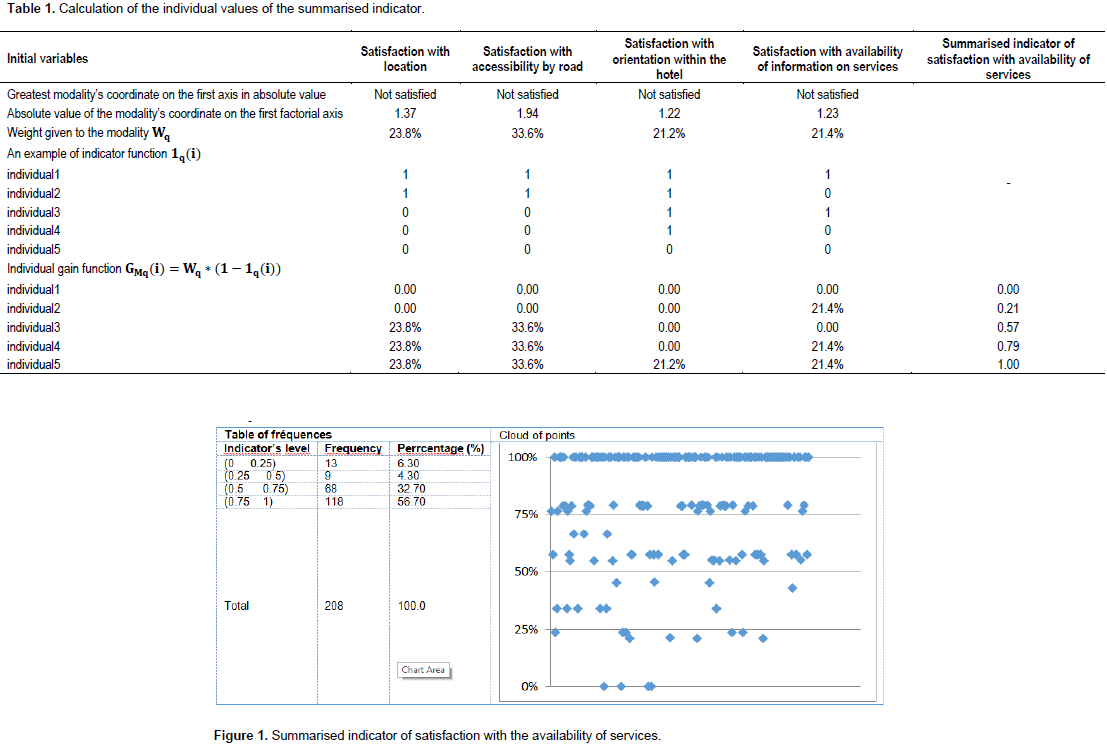
The initial variables measuring satisfaction with the availability of services are satisfaction with location, satisfaction with accessibility by road, satisfaction with orientation within the hotel and satisfaction with availability of information on services. For each primary variable, the multiple component analysis enabled us to determine the weights assigned to the modality “not satisfied” which carries the greatest coordinate (in absolute value) on the first axis as shown in Table 1. The summarized indicator of satisfaction with availability of services for individual1 for example determined as follows:
23.8% (1-1) + 33% (1-1) + 21% (1-1) + 21.4% (1-1) = 0.
Whereas, the summarized indicator of satisfaction with availability of services for the individual3 is calculated as follows:
23.8% (1-0) + 33% (1-0) + 21% (1-1) + 21.4% (1-1) = 57.4%. The summarized indicator for the other individuals is calculated in the same manner. This summarised indicator measures overall satisfaction for each individual in terms of availability of hotel services. It reveals that 89.4% of respondents are satisfied with availability of services (that is, 32.7% whose level of satisfaction is in between 0.5 and 7.5, added to 25% whose level of satisfaction is equal to 1) (Figure 1).
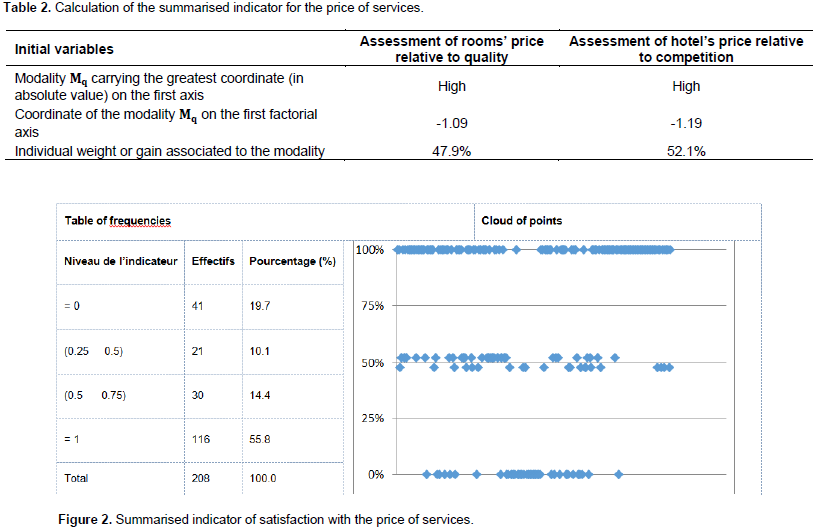
Services’ price
The summarized indicator of satisfaction with price is built on the following variables: assessment of rooms’ price relative to quality; and assessment of hotel’s price relative to competition. For each primary variable, the multiple component analysis enabled us to determine the weight assigned to the modality “high” which carries the greatest coordinate (in absolute value) on the first axis as shown in Table 2. For 70.2% of respondents (that is, 14.4% whose levelof satisfaction is in between 0.5 and 0.75, added to 55.8% whose level of satisfaction is equal to 1), this indicator’s level is greater than 0.5. It was also found that a large majority of respondents (55.8%) had maximum satisfaction with services’ price (Figure 2). Through the same methodological approach, a summarised indicator of satisfaction was constructed for each of the remaining dimensions.
Infrastructure
The summarized indicator of satisfaction with infrastructure was built on the following variables: external appearance of the hotel, space within the hotel, equipment available to guests, medical assistance and state of the swimming pool. For each primary variable, the multiple component analysis enabled us to determine the weight assigned to the modality “not satisfied” for the first three attributes, and “satisfied” for the last two which carry the greatest coordinate (in absolute value) on the first axis respectively as follows: 22.8, 23.6, 17.7, 22.0 and 14.0%. According to this indicator, only 51.9% of respondents are satisfied with the infrastructure of the hotels in which they stay (that is, 32.7% whose satisfaction is in between 0.5 and 0.75, added to 19.2% whose satisfaction is equal to 1).
Interaction with the service provider
The summarized indicator of satisfaction for this dimension was built on staff physical appearance, mastery of customer language, reception, promptness to help customers, staff technical competence and staff relational abilities. For each of these variables, the multiple component analysis enabled us to determine the weight assigned to the modality “not satisfied” which carries the greatest coordinate (in absolute value) on the first axis respectively as follows: 17.4, 16.1, 18.8, 15.6, 14.7 and 17.4%. The indicator’s level for interaction with service provider is greater than 0.5 for 85.1% of respondents (that is, 28.4% whose satisfaction is in between 0.5 and 0.9, added to 56.7% whose satisfaction is equal to 1). It is also found that 56.7% of respondents are highly satisfied with interaction with the service provider.
Services received
This indicator was built on the variables that follow: bathroom caring, general hygiene conditions in the hotel, rooms’ lock system, beds’ comfort, room service. The weights assigned to the modality “not satisfied” which has the greatest coordinate in absolute value on the first factorial axis of the multiple component analysis are respectively 19.6, 20.5, 16.5, 11.0, 16.4 and 16.1%. It is important to note that this indicator’s level is greater than 0.5 for 85.1% of respondents (that is, 31.3% whose satisfaction is in between 0.5 and 90%, added to 53.8% whose satisfaction is equal to 1). It is also found that 53.8% of respondents have maximum satisfaction with the services received.
Interaction with other customers
The indicator of satisfaction relative to interaction with other customers was built on ambiance created by the presence of other customers, respect of rules by the other customers and sympathy with the other customers. The weights assigned to the modality “not satisfied” which has the greatest coordinate in absolute value on the first factorial axis of the multiple component analysis are respectively 33.8, 32.6 and 33.5%, respectively. The result indicates that the indicator’s level is greater than 0.5 for 61% of the respondents (that is, 13.9% whose satisfaction is in between 0.6 and 0.7, added to 47.1% whose satisfaction is equal to 1). It is also noted that 47.1% of respondents show maximum satisfaction with interaction with other clients.
Hypothesis testing
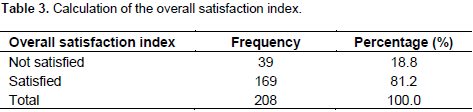
To test the study hypothesis, we needed first of all to calculate the overall satisfaction index as shown in Table 3. Overall, 81.2% of customers are satisfied with hotel services.

Relationship between satisfaction with availability of service and overall satisfaction declared
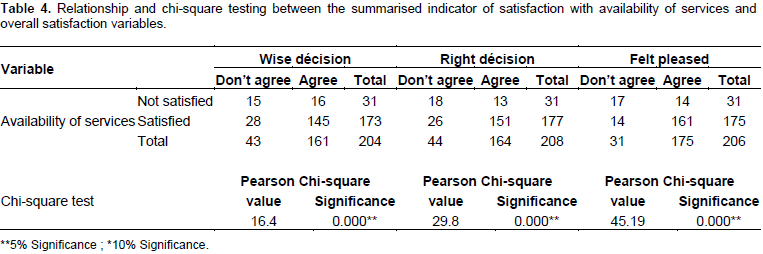
The results in Table 4 show that there is a dependency relationship between the summary indicator of satisfaction with the availability of services and each component of overall satisfaction. Indeed, the P-value of each of the Chi-square tests performed is below the threshold of significance retained (5%), which means that customers who are satisfied with the availability of services have a strong tendency to be globally satisfied. Thus, the "availability of services" dimension effectively determines overall satisfaction for the customer. This result falls in line with the conclusion of Knutson (1988) who mentions suitability of the location as an important contributor to satisfaction among other factors. It is also supported by Lee et al (2010) who assert that location which customers value and expect include safety and ease of access (air, train, bus, public transportation and close connection to area attractions such as historic, business and pleasure).
Relationship between satisfaction with the services’ price and overall satisfaction reported
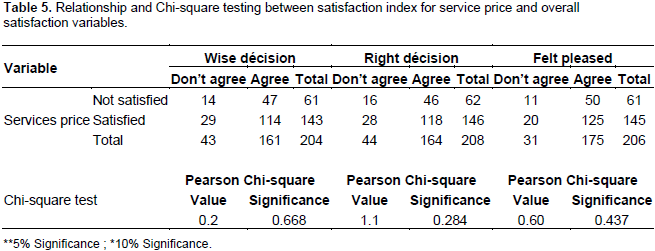
The results in the Table 5 show that there is no dependency relationship between the summary indicator of satisfaction with services’ price and the components of overall satisfaction. Indeed, the P-value of each of the Chi-square tests performed is greater than 5%. Thus, the "price of services" dimension is not decisive in the overall satisfaction of the customer. This result contradicts the findings of Atkinson (1988) and Choi and Chu (2001) according to which value for money is an important contributor to guests’ satisfaction. It may be justified by the fact that customers choose hotels according to their purchasing power.
Relationship between satisfaction with services received and overall satisfaction reported
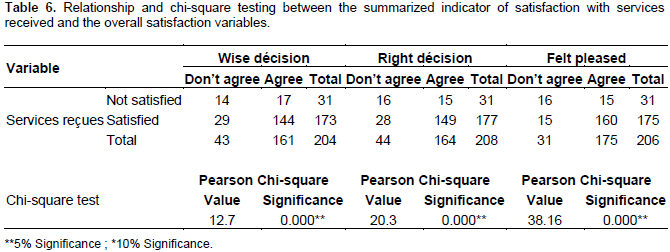
The results Table 6 indicate that there is a dependency relationship between the summarised indicator of satisfaction for services received and each component of overall satisfaction. Indeed, the P-value of each of the Chi-square tests performed is below the threshold of significance retained (5%), which means that clients who are satisfied with the quality of the services offered tend to be overall satisfied. Thus, the “services received” dimension effectively determines the customer’s overall satisfaction. This result is supported by Pizam and Ellis (1999) who state that satisfaction with a hosting experience is the overall sum of satisfaction with the elements or attributes of all the products and services which make up the experience.
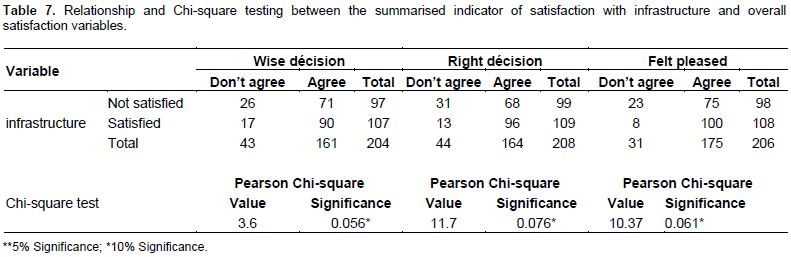
Relationship between satisfaction with infrastructure and overall satisfaction declared
The results in the Table 7 show that there is no dependency relationship between the composite satisfaction indicator for infrastructure and the components of overall satisfaction. Indeed, the P-value of each of the Chi-square tests performed is greater than 5%. Thus, the size of the infrastructure is not decisive in the overall satisfaction of the customer. This result is supported by the conclusions of Bitner (1990) who mentions physical environment as a contributor to quality, Blesic et al. (2011) who assert that the nature of the provider's facilities and equipment that is, furnishing and constructing facilities that comply with the requirements of a modern guest will attract more guests (Sasser et al., 1978; Berry et al., 2002).
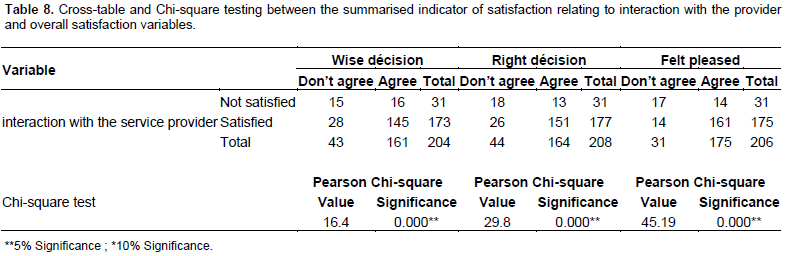
Relationship between satisfaction from interaction with service provider and overall satisfaction
The results in the Table 8 indicate that there is a dependency relationship between the summarised satisfaction indicator for the interaction with the service provider and each component of overall satisfaction. The P-value of each of the Chi-square tests performed is below the threshold of significance retained (5%), which means that customers who are satisfied with the interaction with the provider tend to be overall satisfied. Thus, this dimension effectively determines the customer’s overall satisfaction. This result is supported by Sasser et al. (1978), Atkinson (1988), Knutson (1988), Choi and Chu (2001), Berry et al. (2002) and Sim et al. (2006) who all mentioned quality of staff (or human signals) among other variables as an important contributor to overall satisfaction.

Relationship between satisfaction from the interaction with other customers and overall satisfaction reported
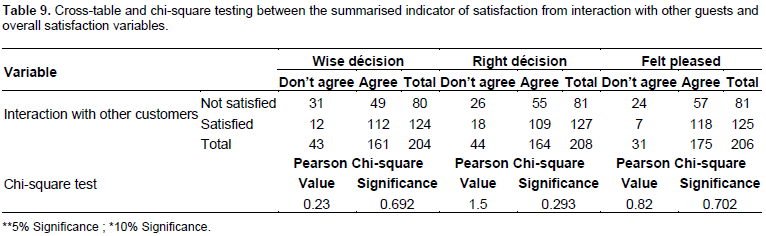
The results in the Table 9 indicate that there is no dependency relationship between the summary satisfaction indicator for interaction with other clients and the components of overall satisfaction. Indeed, the P-value of each of the Chi-square tests performed is greater than 5%. This result opposes the thoughts of Lovelock (1983), Lehtinen and Lehtinen (1991) and Groove and Fisk (1997).
CONCLUSION AND RECOMMENDATIONS
The objective of this study is to assess the contribution of attribute satisfaction to overall performance. Thus, we came out with a questionnaire and collected data that was treated, making use of multiple component analysis and then cross-tables and correlations. The interpretation of the results allows us to reach the following conclusion:
Three dimensions (or groups of attributes) only among the six initially considered contribute to overall satisfaction of hotel customers in Cameroon namely availability of the service, interaction with the service provider and the quality of services received. 89.4% of respondents are satisfied with the availability of the service, 85.1% of respondents are satisfied with the interaction with the provider and 85.1% of respondents are satisfied with the services received (levels of satisfaction with these dimensions are above 0.5 On a scale of 0 to 1). Making hypothesis 1a, 1d and 1e to be verified.
The results of this research provide hotel managers with precise information: the first information is that word-of-mouth is one of the most important sources of information for hotel clients in Cameroon, so managers of these institutions should endeavor to stimulate it. Moreover, to increase the overall level of client satisfaction, it is necessary that hotels in Cameroon improve the level of customers’ satisfaction with the dimensions of availability, services received and interaction with the service provider.
REFERENCES
|
Akyildiz M, Argan M (2010). Leisure experience dimensions: a study on participants of Ankara festival. Pamukalle J. Sport Sci. 1(2):25-36.
|
|
|
|
Anderson EW, Fornell C, Lehman DR (1994). Customer satisfaction, market share, and profitability: findings from Sweden. J. Market. 58:53-66.
Crossref
|
|
|
|
Atkinson A (1988). Answering the eternal question: What does the customer want? Cornell Hotel Restaurant Admin. Quart. 29(2):12-14.
Crossref
|
|
|
|
Berry L, Carbone L, Haeckel S (2002). Managing the total customer experience. MIT Sloan Manage. Rev. 43(3):85-89.
|
|
|
|
Bitner MJ (1990). Evaluating service encounters: the effects of physical surroundings and employee responses. J. Market. 54:69-82.
Crossref
|
|
|
|
Brée J (1994). Le comportement du consommateur. Paris Universitaire de France.
|
|
|
|
Blesic I, Ivkov-Dzigurski A, Stankov V, Stamekovic I, Bradic M (2011). Research of expected and perceived service quality in hotel management. J. Tour. 11:5-13.
|
|
|
|
Chen CC, Huang WJ, Patrick JF (2016). Holiday recovery experiences, tourism satisfaction and life satisfaction-is there a relationship?. Tour. Manage. 53:140-147.
Crossref
|
|
|
|
Choi TY, Chu R (2001). Determinants of hotel guests' satisfaction and repeat patronage in the Hong Kong hotel industry. Hosp. Manage. 20:277-297.
Crossref
|
|
|
|
Churchill GA. Surprenant C (1982). An investigation into the determinants of customer satisfaction. J. Market. Res. Special Issue on causal modeling. 19(4):491-504.
|
|
|
|
Crompton JL, Love LL (1995). The Predictive Validity of Alternative Approaches to Evaluating Quality of a Festival. J. Trav. Res. 34(1):11±24.
|
|
|
|
Eusébio C, Vieira AL (2013). Destination attributes' evaluation, satisfaction and behavioural intentions: a structural modelling approach. Int. J. Tour. Res. 15(1):66-80.
Crossref
|
|
|
|
Evrard Y (1993). La satisfaction des consommateurs : état des recherches. Revue Française du marketing. 144/145 : 53-65.
|
|
|
|
Filser M (1994). Le comportement du consommateur. Collection Précis de Gestion. Dalloz. Paris.
|
|
|
|
Fisk RP, Brown SW, Bitner MJ (1993). Tracking the evolution of service marketing literature. J. Retail. 69(1):61-103.
Crossref
|
|
|
|
Fornell C (1992). A national customer satisfaction barometer: The Swedish experience. J. Market. 56:6-21.
Crossref
|
|
|
|
Giese JL, Cote, JA (2000). Defining consumer satisfaction. Acad. Market. Sci. Rev. 1:1-24.
|
|
|
|
Griffin A, Hauser JR (1993). The voice of the customer. Market. Sci. 12(1):1-27.
Crossref
|
|
|
|
Groove SJ, Fisk RP (1997). The impact of other customers on service experiences: a critical incident examination of 'getting along'. J. Retail. 73(1):63-85.
Crossref
|
|
|
|
Hellstrand P (2010). Price impact on guest satisfaction, Hotel online.
View
|
|
|
|
Hill CWL (2007). International business: competing in the global market place. 6th ed. Boston: McGrawhill.
|
|
|
|
Hughes K (1991). Tourist satisfaction: a guided cultural tour in north Queensland Australian Psychologist. 26(3):166-171.
Crossref
|
|
|
|
Iglesias MP, Guillen MJY (2004). Perceived quality and price: Their impact on the satisfaction of restaurant customers. Int. J. Contemp. Hosp. Manage. 16(6):373-379.
Crossref
|
|
|
|
Jensen JB (2011). Global Trade in Services: Fear, Facts, and Offshoring, Washington, DC: Peterson Institute for International Economics.
|
|
|
|
Johnston R, Michel S (2008). Three outcomes of service recovery: customer recovery, process recovery and employee recovery". Int. J. Oper. Prod. Manage. 28(1):79-99.
Crossref
|
|
|
|
Knutson B (1988). "Frequent travelers: making them happy and bringing them back. Cornell Hotel Restaurant Admin. Quart. 29(1):83-87.
Crossref
|
|
|
|
Kotler P, Keller KL (2006). Marketing Management. Pearson Prentice Hall. 12th edition. New Jersey.
|
|
|
|
Lambin JJ (1989). La marque et le comportement de choix de l'acheteur. Ediscience International.
|
|
|
|
Lee KW, Kim HB, Kim HS, Lee DS (2010). The determinants of factors in FIT Guests' perception of hotel location. J. Hosp. Tour. Manage. 17(1):167-174
Crossref
|
|
|
|
Lehtinen U, Lehtinen JR (1991). Two approaches to service quality. Serv. Ind. J. 11:287-303.
Crossref
|
|
|
|
Lichtle MC, Llosa S, Plichon V (2002). La contribution des différents éléments d'une grande surface à la satisfaction du client. Recherche et Applications en Marketing. 17(4):23-34.
Crossref
|
|
|
|
Lovelock C (1983). Classifying services to gain strategic marketing insights, J. Market. 47:9-20.
Crossref
|
|
|
|
Mefouté BA (2010). Etude des déterminants de l'engagement du consommateur envers la destination touristique. Université Cheick Anta Diop de Dakar.
|
|
|
|
Ngobo PV (2000). satisfaction des clients et part de marché de l'entreprise: un réexamen au regard de récentes avancées théoriques. Recherche et Application en Marketing. 15(2).
Crossref
|
|
|
|
Oliver RL (1980). A cognitive model of the antecedents and consequences of satisfaction decisions. J. Market. Res. 17:460-469.
Crossref
|
|
|
|
Oliver RL (1993). Cognitive, affective and attribute bases of the satisfaction response. J. Consum. Res. Inc. 20 (December).
Crossref
|
|
|
|
Oliver R (1997). Satisfaction: a behavioral perspective on the consumer. McGraw-Hill, NY.
|
|
|
|
Olorunniwo F, Maxwell KH, Godwin U (2006). Service quality, customer satisfaction, and behavioral intentions in the service factory. J. Serv. Market. 20(1):59-72.
Crossref
|
|
|
|
Petri PA. Plumer MG, Zhai F (2012). ASEAN Economic Community: a general equilibrium analysis, Asian Econ. J. 26: 93-118.
Crossref
|
|
|
|
Pizam A, Ellis T (1999). Customer satisfaction and its measurement in hospitality enterprises. Int. J. Contemp. Hosp. Manage. 11(7):326-339.
Crossref
|
|
|
|
Reisinger Y (2001). Concepts of tourism, hospitality, and leisure services. In Kandampully J., Mok C., & Sparks B. (Eds.). Service quality management in hospitality, tourism, and leisure. NY: Haworth Hospitality Press. New York: 1-14.
|
|
|
|
Sasser WE, Olsen PR, Wyckoff DD (1978). Management of Service Operations: Text and Cases. Boston, M.A.: Allyn and Unwyn.
|
|
|
|
Sim J, Mak B, Jones D (2006). A model of customer satisfaction and retention for hotels. J. Qual. Assur. Hosp. Tour. 7(3):1-23.
Crossref
|
|
|
|
Tam JLM (2006). Services marketing in ASIA: a case book. J. Serv. Market. 20(2):148-149.
Crossref
|
|
|
|
Tribe J, Snaith T (1998). From SERVQUAL to HOLSAT: Holiday satisfaction in Varadero, Cuba. Tour. Manage. 19(1): 25-34.
Crossref
|
|
|
|
Vanhamme J (2002). La satisfaction des consommateurs spécifique à une transaction : définitions, antécédents, mesures et modes. Recherche et Applications en Marketing, 17(2):55-85.
Crossref
|
|
|
|
Venette E (1989). Segmentation par avantages recherchés, outil de stratégie marketing. Revue Française de Gestion. mars, avril, mai : 15-22.
|
|
|
|
Westbrook G (1983). Sources of consumer satisfaction with retail outlets. J. Retail. pp. 68-85.
|
|
|
|
Yi Y (1990). A critical review of consumer satisfaction. In V.A. Zeithaml (ed.) Review of Marketing, Chicago: American Marketing Association. pp. 68-123.
|
|
|
|
Yoon Y, Uysal M (2005). An examination of the effects of motivation and satisfaction on destination loyalty: a structural model. Tourism Manage. 26(1):45-56.
Crossref
|
|
|
|
Zeithaml VA, Bitner MJ (2000). Services marketing. Integrating Customer Focus across the Firm. United States of America: Irwin McGraw-Hill.
|