ABSTRACT
This study investigates the impact of corporate diversification on the value of firms listed at the Nairobi Securities Exchange (NSE). Panel regression techniques were used as the estimation methods. The overall findings of the study where somewhat mixed. The study finds that industrial diversification reduces firm value, but geographical diversification does not have a significant impact on firm value. When examining each industry individually, the study established that industrial diversification enhanced firm value in the agricultural industry but did not significantly influence firm value in the other industries.
Key words: Industrial diversification, geographical diversification, firm value, ownership structure, frontier markets.
Corporate diversification has been one of the central themes for research studies in disciplines such as finance, strategic management and industrial organization. Most researchers have sought to understand the effect of corporate diversification on firm value since the revelation by Berger and Ofek (1995) and, Lang and Stulz (1994), that diversified firms trade at a discount of about 13 to 15% as compared to focused firms.
Despite the findings negatively linking diversification to firm value, a large number of companies across the globe continue to engage in diversification activities mainly through mergers, acquisitions, development of new product lines or opening of new businesses across international borders (Martin and Sayrak, 2003). This global diversification has been spurred by various factors such as saturated domestic markets and a quest to secure bigger market shares globally. International diversification has become an important business growth strategy (Denis et al., 2002; Lee, 2013).
More recently, some newer studies have challenged the negative relationship between diversification and firm value. These studies question the interpretation of previous studies and their validity as a whole. For instance, Kuppuswamy and Villalonga (2010) and Elif (2015) found that diversified firms are valued at a premium compared to focused firms.
There are other researchers (Campa and Kedia, 2002), who show that diversification, whether industrial or international has costs and benefits, and the whether the value of the firm is increased or reduced depends on these costs and benefits.
These recent findings clearly highlight the divergent views that exist regarding corporate diversification and its relationship with firm value. To date, no consensus has been reached as to whether diversification creates or destroys firm value. This has made diversification one of the most controversial strategic decisions that firms have had to make as they work towards maximizing their shareholders value.
It should be noted that majority of the available literature is focused on the U.S. and European markets. A few studies have also been done on Asian markets for example the study of Denis et al. (2002) and Markus and Ingo (2008). In emerging markets such as India, Hong Kong, Indonesia, Malaysia and South Korea the few studies that have been undertaken have yielded the same puzzling results as those in developed countries (Lins and Servaes, 2002). However, there is not much research on diversification in frontier markets such as Kenya.
In recent times, Kenya has witnessed an influx of foreign investors and as a result, this has raised competition among local firms. This surge of investors has mainly been attributed to the performance and growth of the Nairobi Security Exchange (NSE) as well as changes in economic policies (Satchu, 2007). As a result, Kenyan firms have embraced geographical and industrial diversification as vital business growth strategies. Recent statistics support this view as evidenced by Kenya’s foreign direct investments outflows increasing by 26.8% from 27,992 million shillings in 2007 to 38,799 million shillings, in 2008 (Kenya National Bureau of Statistics, 2013). This increase in foreign investments is indicative of Kenya’s growing contribution to global trade as well as her desire to secure new markets beyond her borders.
With most of the literature on corporate diversification focused on developed markets, any conclusions made in previous studies cannot be easily applied to frontier markets like Kenya. As Lee and Hooy (2012) discuss, this is mainly because economic conditions, capital markets and ownership structures of firms in frontier markets are remarkably different, making the costs and benefits the firms encounter different. Given the dearth in corporate diversification literature focusing on frontier markets, this paper sought to establish the impact of corporate diversification on the value of firms listed at the NSE to help plug the gap.
The objectives of this study were: firstly, to determine if geographical and industrial diversification affect the value of firms listed at the NSE. Secondly, to investigate whether geographical and industrial diversification affected different industries in Kenya based on the domestic classification of industries by the NSE. The motivation behind this was inspired by Lee and Hooy (2012) who argue that different industries within the same country face varied levels of competition and legal environments. As such, the industries are bound to respond differently to diversification. The third objective, was to establish the nature of the relationship between diversification and the value of firms listed at the NSE.
Given the various costs and benefits associated with diversification in the available literature, some studies (Capar and Kotabe, 2003; Gomes and Ramaswamy, 1999; Palich et al., 2000), found out that there is a curvilinear relationship between diversification and firm value.
Jensen (1986) posits that diversification into different industries is more likely to result in losses unlike other strategies such as takeovers or expansion into the same line of business. Coincidentally, many studies carried out have shown that corporate diversification indeed destroys value. Some of the renowned studies that indicate a negative relationship between diversification and firm value include Berger and Ofek (1995), Lang and Stulz (1994), and Servaes (1996).
These studies show that diversified firms trade at a discount of about 13 to 15% compared to focused firms. Even so, recent business growth strategies, specifically diversifying mergers and acquisitions reached record breaking levels with the total dollar value of global mergers hitting the US$ 2.3 trillion mark in 1999 (Martin and Sayrak, 2003).
If indeed past studies show that diversification destroys value, why have firms continued to engage in it? Presumably, there are many benefits a firm can achieve if it decides to diversify. For instance, Lee (2013) notes that many organizations from around the world are venturing into international markets in the current globalization era so as to access large and growing non-local markets due to the maturity, saturation and intense competition in local markets.
Villalonga (2000) also asserts that firms usually diversify in order to acquire market power and undertake reciprocal buying with other big companies so as to drive smaller firms out of business. Diversified firms also have the option of using extra funds generated by a profitable business unit to support aggressive pricing strategies in the other divisions. In addition, firms can also create internal capital markets through diversification which offer a cheaper source of funds than external sources because the company does not have to bear transaction costs such as those that are linked to the sale of securities to the general public (Martin and Sayrak, 2003).
Conversely, diversification is also linked to negative consequences such as agency costs. Agency problems can come about when managers entrench themselves in the organization by adopting diversification strategies that overlap with their skill (Garcia et al., 2013).
Inefficient operation of internal capital markets are another drawback of diversification. As Berger and Ofek (1995) point out, inefficient cross-subsidization and over-investment among the divisions are issues that diversified firms encounter. This happens when poorly performing divisions are funded using profits from well performing divisions or when excess funds are allocated to a particular segment while the rest are ignored. Information asymmetries are yet another cost of diversification. As Hoskisson and Hitt (1988) note, executives might not be able to evaluate all information provided by strategically different divisions and as such, this may lead to a reduced understanding of the divisions.
Theoretical framework on diversification
The three most discussed theories on why firms choose to diversify and why diversification destroys value are, agency theory, internal capital markets theory and resource-based theory. According to Namazi (2013), agency problems occur within the modern corporation in which share ownership is spread out and managerial action often departs from the wishes of the stockholders. Consequently, managers undertake diversification strategies even though they might significantly decrease shareholder wealth.
In the same way, Oijen and Hendrikse (2002) note that managers tend to withhold free cash flows from the shareholders opting to instead spend the funds on various diversification projects so as to build empires, get pay raises and reduce personal unemployment risk.
Though internal capital markets are a source of cheap funds, inefficient internal capital markets have been credited to be the cause of the diversification discount. For instance, Scharfstein and Stein (2000) point out that inefficient cross subsidization could occur when an excess amount of resources are allocated to one division while less than required is provided to another. In a similar fashion, Lamont and Polk (2002) indicate that diversified firms could invest inefficiently by spending excess funds on poorly performing divisions and little on good divisions.
The resource-based theory provides a basis for understanding how organizations develop scarce, valuable, difficult-to-imitate, and non-substitutable resources that may allow them to earn economic rents and provide resource barriers to competition (Mills et al., 2003).
According to Garcia et al. (2013), firms will engage in diversification if they have an abundance of resources that can easily be assigned to the various business lines and for which market imperfections exist. The resources must however be scarce, valuable and inimitable. Nonetheless, diversification can become inefficient if the resources utilized by one division of the firm are of little or no use in the other business lines that the firm operates.
Diversification and the curvilinear model
Studies undertaken to investigate the relationship between industrial diversification and firm value have argued that a curvilinear relationship exists between the two. As such, these findings postulate that firms that undertake a small amount of diversification will perform better than those that remain focused (Palich et al., 2000).
In a similar way, it has been shown that geographical diversification exhibits a curvilinear relationship with the firm value. Some of the studies that proffer this connection (Lu and Beamish, 2001) argue that the connection between geographical diversification and firm value is captured by an inverted U-shape. The U-shape implies that an increase in geographical diversification enhances performance up to a certain breakpoint after which the negative effects of geographical diversification such as different cultures, trade laws, currency fluctuations or agency costs outweigh the benefits and the firm’s performance and value drops.
Supporting the U-shape relationship, Capar and Kotabe (2003) and Ruigrok and Wagner (20030 state that initially, geographical diversification is linked to declining value because firms lack the experience and skills to successfully operate when they first venture into new foreign markets. With time though, the firms can learn how to successfully navigate in the new markets and therefore profitably increase performance.
Developing the U-shaped model further, Lu and Beamish (2004) posit that firm performance declines once again at high levels of geographical diversification due to an increase in governance and coordination costs resulting in a horizontal S-curve.
Tobin’s Q
Since the study carried out by Lang and Stulz (1994), Tobin’s Q has been the most popular measure of firm performance and value. It is expressed as the ratio between the present value of future cash flows and the replacement costs of the physical assets. Later studies, however, employed surrogate measures of Tobin’s Q in order to adapt to the available data in emerging economies such as the studies by Priya and Shanmughan (2011) that analysed firms in India, and Ongore (2011) that studied firms in Kenya.
In this study, the techniques developed by Khanna and Palepu (2000) and Zhang (2011) to calculate Tobin’s Q (TQ) was used. The simplified version of TQ was calculated as the sum of the market value of equity plus the book value of total debt plus preference shares and this was divided by the value of total assets.
The sample chosen for this study was companies that were listed at the NSE for the period 2006 to 2011, excluding all companies that operate in the finance, real estate and insurance industries. This elimination process was consistent with previous studies and is recommended because the calculation of some control variables entails using sales figures which are ambiguous for firms in these industries.
In addition, firms with more than two years of missing data were eliminated (Priya and Shanmughan, 2011). This resulted in a final list of 38 firms, divided into various industry segments. The study used data from the financial statements that listed companies submit to the NSE annually.
Baseline model
To test for the effects of diversification on the value of firms, determinants that could potentially affect a company’s TQ, were all considered. These control variables which included leverage, firm size, profitability, and growth opportunities have been utilized extensively in previous research on corporate diversification, such as Zhang (2011), Nazarova (2015), and Volkov and Smith (2015). The model aforementioned was empirically estimated by running the following regression:
Where:
i and t are the firm and time dimensions of the data,
α and β are coefficients and ε is the error term,
LnTA is the log of total assets used to represent firm size,
EbitSales is the Earnings before interest and taxes-sales ratio, used as a proxy for firm profitability,
CapexSales is the capital expenditure-sales ratio used to measure growth opportunities,
Lev is the ratio of total debt to total assets used to represent firm leverage,
DGeographical is the geographical diversification dummy, set to 1 if the firm is geographically diversified, and 0 otherwise.
DIndustrial is the industrial diversification dummy, set to 1 if the firm is industrially diversified, and 0 otherwise.
Robustness check
Building on this baseline model, ownership structure variables were included as independent variables to perform robustness checks. This is in line with studies such as Fauver, et al. (2004), and Nazarova (2015). Three dummy variables were also included to indicate the extent of ownership concentration by local banks, individuals and foreign entities (both individuals and companies). The dummy variables were added to the baseline model to yield equation (2) as follows:
The dummy variable ‘banks’ is set to 1 if a bank held at least 5% of a firm’s shares, and set to 0 otherwise. The dummy variable ‘individuals’ is set to 1 if an individual held at least 5% of a firm’s shares and is set to 0 otherwise and in a similar way, the dummy variable ‘foreign’ is set to 1 if a foreign entity owned at least 5% of the shares and is set to zero otherwise.
To investigate whether geographical and industrial diversification affected different industries in Kenya based on the domestic classification, the following regression model was tested:
Where:
All variables are as explained earlier and
Industries is the number count of business units that the firm operated in, Geographies is number count of countries that the firm operated in. To investigate the study third objective, we ran the following regression:
Where:
All variables are as explained above and
Industries2is the square of industries,
Geographies2 is the square of geographies.
Summary of descriptive statistics
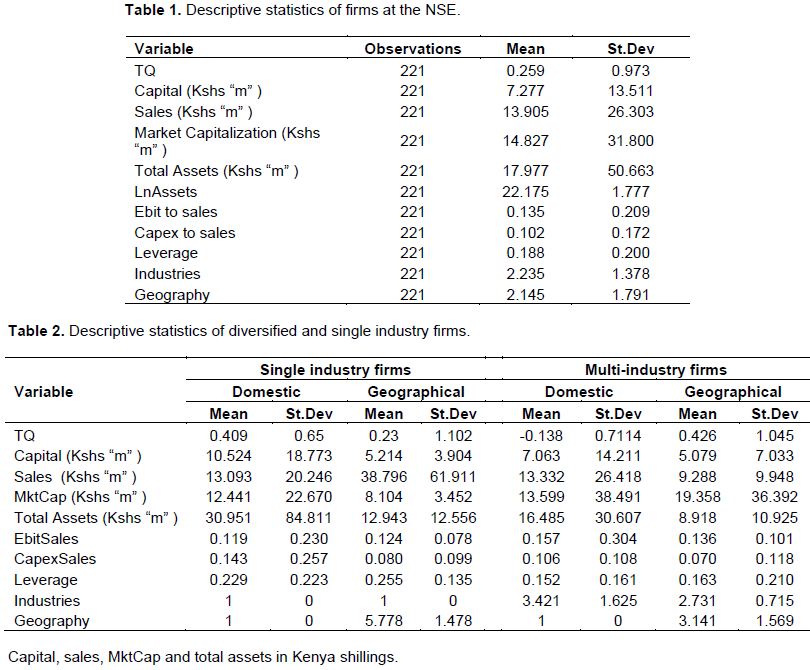
It is worth noting that the sample size of 38 firms that we used was remarkably smaller compared to other studies carried out in developed as well as in emerging markets. For instance, Lee (2013) focused on Malaysia, and had 267 firms while Khanna and Palepu (2000) used 1309 firms in India. Using firm data from 2006 to 2011, the study sample yielded an unbalanced panel with 221 firm-years. The mean and standard deviation of various variables from the total sample are shown in Table 1.
Regression results
The standard panel regression techniques were used as the estimation method. In all the regression model, unobservable fixed firm-specific and firm-invariant time-specific effects were accounted for. Table 3 presents the regression results of a few restricted variations of model (1). The results are reported based on robust standard errors that control for heteroscedasticity and serial correlation.
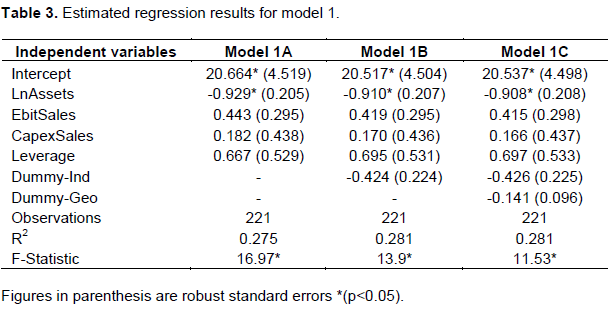
Starting with model 1A, only four control variables were included in the regression. The results showed that the only variable that was statistically significant was ‘LnAssets’ which was used as a proxy for firm size. The R2 of the model was 0.7619. Next, the industrial dummy variable was added and this yielded the results shown in model 1B. Finally, both the industrial and geographical dummy variables were included in the regression and this yielded the results shown in model 1C. Just as before, the only statistically significant variable was ‘LnAssets’. Even so, it was noteworthy that the industrial and geographical diversification dummy variables in model 1C were both negative which implies that diversification and firm value are inversely related. This is in line with previous studies such as Bernado et al. (2000) and Graham et al. (2002), which found a negative relationship between diversification and firm value.
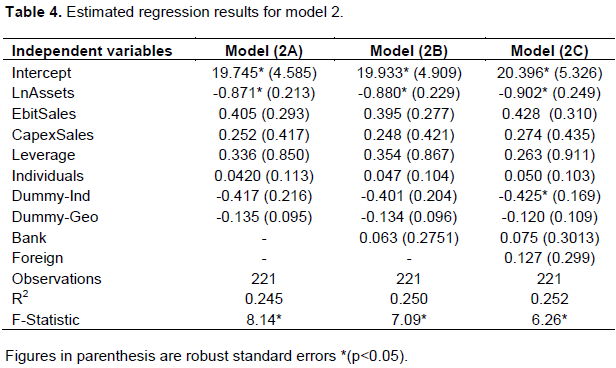
Table 4 reports the results for model (2) in which we control for ownership structure of the firms. Starting with model (2A), only the ‘individuals’ dummy variable was included. Once again, only ‘LnAssets’ was statistically significant. Moving to model (2B), ‘banks’ dummy variable was included in the regression and finally the ‘foreign’ dummy variable in model (2C). Interestingly, the industrial diversification dummy (coefficient -0.4254) is now significant at the .05 level, showing that firm value would decrease by -0.4254 units for every additional industry that a firm diversified into. This finding was similar to numerous others studies such as Lee (2013) who found that industrial diversification lowered the value of firms.
In Table 5, the results for the six industries classified by the NSE, are presented. In this study, any industry that had less than three companies was re-assigned to the closest related industry group following the technique employed by Kreye (2007) who analyzed German firms. As such, the Telecommunications and Technology industry only had two companies and these were re-assigned to the Commercial and Services industry. Given the study small sample, the number of observations in each industry ranged from 24 to 51 firm years.
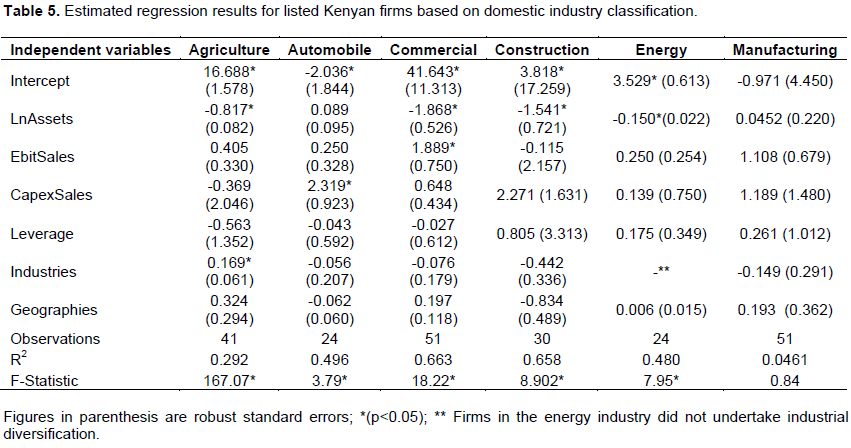
The results show that the industrial diversification variable is statistically significant at the 0.05 level in the agricultural industry. This means the value of companies in the agricultural industry increases by 0.1685 units for every additional industry that they diversified into. Neither the geographical nor industrial diversification variables is significant in the other industries. The results also indicate that company size is significantly negative with firm value in the agricultural, commercial, construction and energy industries; implying that firms in these industries might trade a discount as the firms become bigger. This result is contrary to our expectations that firms with greater growth opportunities would lead to higher value.
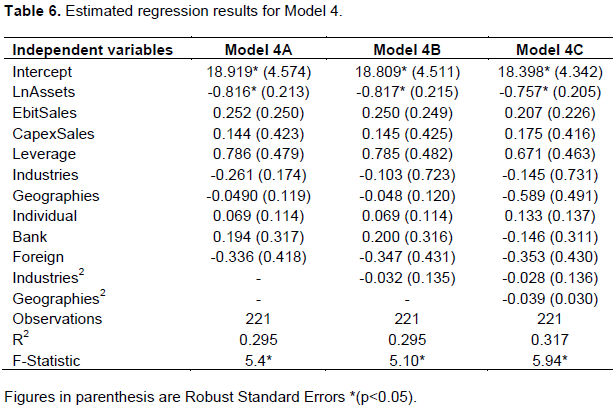
Next, Table 6 presents the results for model (4) that establishes the nature of the relationship between diversification and firm value. The results indicate that firm size is significantly negative with firm value in all three variations of model (3). This finding is similar to what was reported in model (2). The geographical and industrial diversification variables were, however, not statistically significant at the 0.05 level, meaning that the nature of the relationship between firm value and both geographical and industrial diversification is best captured in a linear format.
Summary of key findings
(1) Firm ownership structure has an effect on the value of firms. By including different ownership structures into the various regression models, F-statistic values were statistically significant which meant that all the variables combined significantly predicted the value of the firms.
(2) Tobin’s Q is negatively correlated with the total number of assets that firms have. The correlation coefficient between Tobin’s Q and ‘LnAssets’ was found to be -0.1312. Furthermore, the coefficient of the ‘LnAssets’ in Model 1A, B and C was negative and statistically significant at the .05 level.
(3) Geographical diversification has an effect on the value of firms. Though not statistically significant in any of the
models, the regressions yielded significant F-statistics which implied that all variables combined significantly predicted the value of firms.
(4) The value of firms in the agricultural industry is significantly affected by industrial diversification. The coefficient of industrial diversification was 0.1685 with a p-value of 0.005 which means that the value of the firms increase by 0.1685 percentage points for every additional industry that the firms diversify into.
(5) Among the automobile; commercial, services and telecommunication; construction; energy; and manufacturing industries, the geographical and industrial diversification variables were not statistically significant.
(6) The nature of the relationship between the value of firms at the NSE and industrial diversification does not show a curvilinear relationship. The ‘industries2’ variable included in the model to capture the nature of the relationship was not statistically significant.
(7) The nature of the relationship between geographical diversification and firm value does not exhibit a curvilinear relationship. This is due to the fact that the ‘geographies2’ variable included in the model to test the non-linear relationship is not statistically significant.
This study investigated whether geographical and industrial diversification affected the value of firms in Kenya. The results suggest that industrial diversification lowers firm value; that is, a firm’s value will diminish as it pursues industrial diversification. This finding agrees with Denis et al. (2002).
This finding implies that industrial diversification is not a successful path to better performance for firms at the NSE. When considering the effects diversification has on the different industries according to the domestic classification, the results show that the value of firms in the agricultural sector is enhanced by industrial diversification. The study finding surmises that the relationship rests on the fact that agriculture is a core industry in Kenya. The finding that diversification affects firm’s value differently in different markets agrees with stipulations by Santalo and Becerra (2008).
Overall, this study recommends that business managers cautiously pursue industrial diversification as a growth strategy given that it has been shown to reduce firm value. In addition, investors at the NSE need to carefully analyse firms that intend to venture into industrial diversification because the costs of diversification might outweigh the benefits and thus reduce firm value.
The authors have not declared any conflict of interests.
REFERENCES
|
Berger P, Ofek E (1995). Diversification effects on firm value. J. Financ. Econ. 37:39-65.
Crossref
|
|
|
|
Bernado A, Chowdhry B, Palia D, Sernova E (2000). Real options and the diversification discount. Unpublished work, The Anderson School at UCLA.
|
|
|
|
|
Campa JM, Kedia S (2002). Explaining the diversification discount. J. Financ. 57(4):1731-1762.
Crossref
|
|
|
|
|
Capar N, Kotabe M (2003). The relationship between international diversification and performance in service firms. J. Int. Bus. Stud. 34(4):345-355.
Crossref
|
|
|
|
|
Denis D, Denis D, Yost K (2002). Global diversification, industrial diversification, and firm value. J. Financ. 57(5):1951-1979.
Crossref
|
|
|
|
|
Elif A (2015). Corporate diversification and firm value: evidence from emerging markets. Int. J. Emerg. Mark. 10(3):294-310.
Crossref
|
|
|
|
|
Fauver L, Houston J, Naranjo A (2004). Cross-Country evidence on the value of corporate industrial and international diversification. J. Corp. Financ. 10: 729-752.
Crossref
|
|
|
|
|
Garcia M, Hidalgo A, Rodriguez D (2013). Responsible diversification: Knowing enough about diversification to do it responibly:Motives, measures and consequences. Annales Universitatis Apulensis Series Oeconomica, 15(1):217-237.
|
|
|
|
|
Gomes L, Ramaswamy K (1999). An empirical examination of the form of the relationship between multinationality and performance. J. Int. Bus. Stud. 30(1):173-188.
Crossref
|
|
|
|
|
Graham J, Lemmon L, Wolf J (2002). Does corporate diversification destroy value?. J. Financ. 57(2):695-720.
Crossref
|
|
|
|
|
Hoskisson R, Hitt M (1988). Strategic control systems and relative R&D investment in large multiproduct firms. Strat. Manage. J. 9(6):605-622.
Crossref
|
|
|
|
|
Jang S, Weng M, Wang Y (2005). Asian Econ. J. 19(4):423-443.
Crossref
|
|
|
|
|
Jensen M (1986). Agency costs of free cash flow, corporate finance and takeovers. Am. Econ. Rev. 9(4):323-329.
|
|
|
|
|
Kenya National Bureau of Statistics (2013). Kenya - Foreign investment survey 2010.
|
|
|
|
|
Khanna T, Palepu K (2000). Is group affiliation profitable in emerging markets? An analysis of diversified Indian business groups. J. Financ. 55(2):867-891.
Crossref
|
|
|
|
|
Kreye T (2007). The impact of corporate industrial and international diversification on firm value: Evidence from Germany. Unpublished Phd Thesis, The University of St. Gallen, Graduate School of Business Administration, Economics, Law and Social Sciences.
|
|
|
|
|
Kuppuswamy V, Villalonga B (2010). Does diversification create value in the presence of external financing constraints? Evidence from the 2007 - 2009 financial crisis, Boston: Harvard Business School. Working Paper.
|
|
|
|
|
Lamont OA, Polk C (2002). Does diversification destroy value? Evidence from industry shocks. J. Financ. Econ. 63(2):51-77.
Crossref
|
|
|
|
|
Lang L, Stulz R (1994). Tobin's Q, corporate diversification and firm performance. J. Polit. Econ. 102:1248-1280.
Crossref
|
|
|
|
|
Lee J, Hooy C (2012). Determinants of systematic financial risk exposures of airlines in North America, Europe and Asia. J. Air. Transport Manage. 24:31-35.
Crossref
|
|
|
|
|
Lee K (2013). The value impact of international and industrial diversification on Malaysian firms. Int. J. Financ. 7:128-147.
|
|
|
|
|
Lins K, Servaes H (2002). Is corporate diversification beneficial in emerging markets?. Financ. Manage. 31(2):5-31.
Crossref
|
|
|
|
|
Lu J, Beamish P (2001). The internationalization and performance of SMEs. Strat. Manage. J. 22:565-586.
Crossref
|
|
|
|
|
Lu J, Beamish P (2004). International diversification and firm performance: The s-curve hypothesis. Acad. Manage. J. 47(4):598-609.
Crossref
|
|
|
|
|
Markus S, Ingo W (2008). Geographical diversification and firm value in the financial services industry. SSRN Working Paper.
|
|
|
|
|
Martin J, Sayrak A (2003). Corporate diversification and shareholder value: A survey of recent literature. J. Corp. Financ. 9:37-57.
Crossref
|
|
|
|
|
Mills J, Platts K, Bourne M (2003). Applying resource-based theory: Methods, outcomes and utiliy for managers. Int. J. Oper. Prod. Manage. 23(2):148-166. Namazi M (2013). Role of the agency theory
Crossref
|
|
|
|
|
Nazarova V (2015). Corporate Diversification Effect on Firm Value (Unilever Group Case Study). Ann. Econ. Financ. 16(1):173-198.
|
|
|
|
|
Oijen AA, Hendrikse G (2002.) Governance structure, product diversification, and performance, Rotterdam: Erasmus Research Institute of Management.
|
|
|
|
|
Ongore V (2011). The relationship between ownership structure and firm performance: An empirical analysis of listed companies in Kenya. Afr. J. Bus. Manage. 5(6):2120-2128.
|
|
|
|
|
Palich L, Cardinal L, Miller C (2000). Curvilinearity in the diversification performance linkage: An examination over three decades of research. Strat. Manage. J. 21(2):155-174.
Crossref
|
|
|
|
|
Priya P, Shanmughan R (2011). Foreign ownership structure and corporate performance: empirical evidence from India. Global J. Financ. Manage. 3(1):15-24.
|
|
|
|
|
Ruigrok W, Wagner H (2003). Internationalization and performance: an organizational learning perspective. Manage. Int. Rev. 43(1):63-83.
|
|
|
|
|
Santalo J, Becerra M (2008). Competition from specialized firms and the diversification - performance linkage. J. Financ. 63(2):851-883.
Crossref
|
|
|
|
|
Satchu AK (2007). Anyone can be rich. Nairobi, Kenya: English Press Limited.
|
|
|
|
|
Scharfstein D, Stein J (2000). The dark side of international capital markets: divisional rent seekingand inefficient investment. J. Financ. 55: 2537-3564.
Crossref
|
|
|
|
|
Servaes H (1996). The diversification during the conglomerate merger wave. J. Financ. 51(4):1201-1225.
Crossref
|
|
|
|
|
Villalonga B (2000). An empirical analysis of diversification motives. Unpublished manuscript, Los Angeles, Anderson Graduate School of Management, University of California.
|
|
|
|
|
Volkov N, Smith G (2015). Corporate diversification and firm value during economic downturns. Q. Rev. Econ. Financ. 55:160-175.
Crossref
|
|
|
|
|
Zhang Q (2011). Diversification and performance of group-affiliated firms during institutional transitions: The case of the Chinese textile industry. Am. J. Econ. Bus. Admin. 3(2):229-241.
Crossref
|
|