ABSTRACT
The time used for fermentation should be limited by bakers, because if fermentation takes long time, the major nutrients in food, especially cereals can be reduced. The aim of this study is to assess the amount of carbohydrate nutrients transformed by yeast cells (Sacharomyces cerevisiae) through the fermentation of maize flour dough. Lane-Eynon and iodine-thiosulfate titration methods were used to quantify the concentration of both simple sugar and starch in the samples. Twelve samples were used for the analysis; 3 were used before the fermentation and another 3 were used after the fermentation at 17, 20 and 23 h. The amounts of starch consumed by yeast cells from the samples after fermentation time (17, 20 and 23 h) were 23.97, 49.13 and 68.45%, respectively. No simple sugar was detected after 17 h of fermentation of the samples. The results revealed that a significant amount of starch was transformed. Therefore, fermentation time should not be extended to prevent loss.
Key words: Maize flour, fermentation, reducing sugar, Saccharomyces cerevisiae, starch, titration.
Fermentation has been in practice for many centuries. Since it is a traditional practice, scholars do not focus on it and tend to conduct research on the aspect of fermentation with respect to loss of carbohydrate. As reported by Margaret (2008), carbohydrate is the most importantly used macronutrient by our body. Therefore, it has to be considered to know whether fermentation process transforms carbohydrate nutrients or not. Yeast cells are living organisms that do not prepare their own food because they lack the organelle that enables them to prepare their carbon sources through photosynthesis. Therefore, nutritionally, yeasts are categorized as heterotrophic organisms that depend on other organisms to get their energy sources (Dickinson, 1999; Madigan et al., 2003).
In Ethiopia, people use traditional way to ferment food by yeast cells, and transform some amount of glucose that is found in carbohydrate food which can in turn affect the amount of glucose that should be supplied in the blood (Michael et al., 2008; Cavalieri et al., 2003). Some people after eating get hungry immediately; it seems there are parasitic worms in their intestine which compete for the vital food substances that are ready to be absorbed into their bloodstream to supply energy to their cell (Wang et al., 1980). Both aerobic and anaerobic respirations of yeast cells transform the nutrient content of carbohydrate food. During aerobic respiration, yeast can produce significant amount of energy by decomposing all the molecules of glucose into CO2 and water (James et al., 2005; Dickinson, 1999).
But, during anaerobic respiration of yeasts, less energy can be obtained. By anaerobic respiration of yeast, the glucose used as respiratory substrate cannot completely be decomposed into CO2 and H2O but is partially decomposed and forms another organic molecule alcohol (C2H5OH) and CO2 (Vouillamoz et al., 2006; McGoven et al., 2004). During preparation of injera and bread, the dough of any cereals is sealed to facilitate anaerobic respiration that results in CO2 and alcohol (Akbar et al., 2012).As Takano et al. (2002) reported, yeasts can consume glucose through aerobic and anaerobic respiration which is consumed by human. This mean that, yeast cells indirectly can harm us by transforming the carbohydrate nutrients of vital substances as described above.
The dough that has been fermented and stayed in the container changes its quality and becomes bitter or sour. This indicates that the vital substances are already transformed by the yeast cells (Akbar et al., 2012). It was stated by different scholars that as duration of fermentation increased the vital substances especially carbohydrate used as carbon source for yeast cells and its concentration decreased from the container in which it was inoculated (James et al., 2005; Dickinson, 1999; Madigan et al., 2003). Like any other intestinal parasitic organisms consuming vital substances and affecting the amount of glucose that should be consumed by our body, the yeast also would be considered as one of the organisms that could have perished our vital substances (Margaret, 2008). In this study, the effect of yeast cells on carbohydrate food was assessed and analyzed to check whether the carbohydrate lost via fermentation process is significant or not .
Experimental apparatus used
They are: digital balance, Erlenmeyer flask, conical flask, beakers, test tubes, centrifuge, rotary evaporator, oven, burette, pipette, graduated cylinder, volumetric flask, stopper, magnetic stirrer, heater, pH detector, maize, miller and the experimental organism is Saccharomyce cerevisiae (Baker’s yeast).
Sample collection
One kilogram of maize grain sample used for analysis was bought from market of Sebeta town. Sebeta town is located in Oromia Regional State, West south of Addis Ababa at 22 km in Ethiopia. It was dried and packed into plastic bag and transported to the laboratory for analysis. The sample was ground to a fine powder to enhance solvent extraction by sample miller (DIETZ Tech West Germany, 1998).
Sample preparation of simple sugar and starch before fermentation
Two hundred gram of the ground sample was soaked and defatted by 250 ml of organic chemical acetone. Then, the acetone was removed by filtration along with oil that was found in the sample and dried in dry oven to make fragile powder again. To prepare sample for simple sugar and starch analysis of unfermented samples; first, 30 g of the defatted sample of maize powder was weighed by the digital balance and kept in 3 different flask each containing 10 g of sample. It was boiled for 15 min in 50 ml of 80% ethanol to dissolve low molecular weight of carbohydrate (reducing sugar). It was separated as supernatant and residue by centrifuge that was adjusted at 3000 rpm for 10 min, and then the supernatant solution was kept in rotary evaporator to remove the alcohol.
But, the residue was kept for sample preparation of starch. After all the alcohol had been evaporated by rotary evaporator from the solution, sugar solution remained in it. But in addition to sugar, it had other various small molecules that interfere with the analysis. The solution was treated by clarifying agent of 25 ml of 10% neutral lead acetate and immediately the solution changed into yellowish color which was shaken thoroughly and filtered by centrifuge into supernatant and residue. The separated supernatant from centrifuge was again treated by 10 ml of 10% potassium oxalate that resulted in white precipitate and it was separated as residue and supernatant by centrifuge at 3000 rpm for 10 min. The supernatant solution was prepared with sample of reducing sugar used for analysis by Lane-Eynon titration method.
Sample preparation of simple sugar and starch after fermentation
To prepare sample for analysis of simple sugar and starch after fermentation,50 ml of distilled water was boiled with 1 M of CaCl2. H20 solution; then the sample reserved for starch analysis was dissolved into the solution for 15 min to ensure the dissolution of amylopectin as adopted by Knutson (1999). The dissolved starch solution was separated from the rest residue by low speed centrifuge adjusted at 2000 rpm for 5 min as supernatant to prevent the settlement of amylose molecules down as residue. The supernatant solution obtained was prepared sample of starch used for analysis by iodine-thiosulphate titration method.To prepare sample for starch analysis after fermentation, 90 g of defatted sample was used for analysis. Nine different flasks contain 10 g of sample each and made into solution by 50 ml of distilled water analyzed at different time of fermentation. Next, 0.01 mg colony of yeast was weighed by digital balance (S. cerevisiae) (Akbar et al., 2012) and was inoculated in each of the flask to ferment the sample at the same time of the day (10:00 pm).
The first 3 fermented samples were analyzed at 3:00 am after 17 h of fermentation; the second 3 samples were analyzed at 6:00 am after 20 h of fermentation and the third 3 fermented samples were analyzed at 9:00 pm after 23 h of fermentation, an interval of 3 h. As described by Akbar et al. (2012), fermentation should be monitored by moisture, pH, viable yeast count, and temperature as well as dough amount or substrate used. Hence, the moisture was controlled by adding the same volume of distilled water for the 9 inoculates. The 9 inoculated samples were kept nearby and maintained in the same temperature (min=25°C and max=29°C) at room temperature for that specific date when this experiment was done. The viable yeast count was controlled by addition of the same amount of mass of the yeast cells (S. cerevisiae) (0.01 mg) into each container and the substrate or dough sample was controlled by using the same weight of sample (10 g) in each container. After the inoculates were fermented within limited time of fermentation, all the procedures that were used for sample preparation of unfermented sample were analyzed by Lane-Eynon and Iodine-thiosulphate titration method to determine the concentration of both simple sugar and starch.
Determination of simple sugar concentration
Maize accommodates insignificant amount of non-reducing sugar (sucrose). Therefore, the preferred method used to analyze low molecular weight of carbohydrate such as glucose and maltose (reducing sugar) was Lane-Eynon’s titration method. It was used to analyze reducing sugar by the principle that a burette is added to the prepared sugar solution placed in the flask containing mixed Fehlings’ solution that reacts with copper sulfate to change Cu++ to Cu+ by reduction reaction. But, the volume of sugar solution used for unfermented samples consumed in titration was beyond 50 ml. Hence, its concentration could not be calculated by using the factor described in literature as it had been determined by International Starch Institute (1999). Thus, the concentrations of simple sugar for unfermented sample were determined by derived formula.
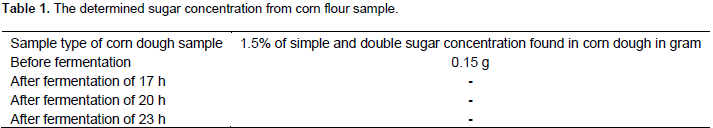
The determinations of simple and double sugar from the samples after fermentation were made determined based on the principle reported by Akbar et al. (2012). According to the report of Akbar et al. (2012), carbohydrate nutrients are transformed through fermentation process of yeast by pecking order. First, glucose, sucrose, maltose then finally starch were transformed. Hence, it was determined that the reducing sugars which were found in the fermented maize dough samples were transformed to generate energy for the metabolic activities of yeast cells. This indicates that there is no simple sugar in fermented samples (Table 1).

Determination of starch concentration
High concentration of carbohydrate found in maize is starch that comprises 61.7% of corn grain (International Starch Institute, 1999). The chemical method used to determine starch concentration from maize sample was iodine-thiosulfate titration method that was applied by known amount of iodine (0.06 M) required for the formation of amylose-iodide inclusion complex as it was reported by Walter (1997). The concentration of iodine was calculated by EBAS stoichiometric calculator (Marcin, 2005-2008) stoichiometrically and checked manually for all volume of Na2S2O3.5H2O used in all replication. After the mass of Iodine was determined stoichiometrically, the mass of starch was determined by the standard found in the literature. Knuston (1999) reported that concentration of starch can be calculated from the 30% of I2 that forms poly-iodide complex between starch molecules and iodine. After the mass of I2 was calculated from the moles of I2 from each ml of Na2S2O3.5H2O, the mass of starch was then calculated from the mass of I2 by using the standard in literature. According to Knutson (1999), starch accommodates 30% of I2 in polyiodide inclusion complex. Hence, the mass of starch was determined as 70% of the total inclusion
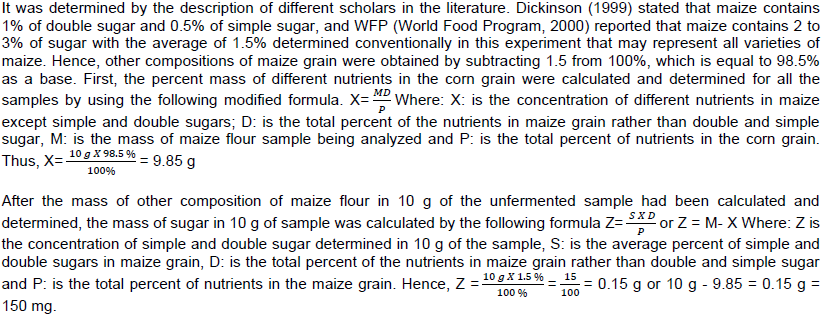
The percent concentration of simple and double sugar was 1.5%, which was used to calculate the mass of other nutrients in 10 g of the sample and then the mass of sugars in the unfermented sample was calculated and determined as 0.15 g as indicated in Table 1. The concentration of sugar solution could not be determined from the volume of sugar solution consumed at the end point in titration. Because, the end point was not reached by consuming 15 to 50 ml of sugar solution titrated against Fehling’s solution from burette as the factor that was determined by International Starch Institute (1999) and Dunsmore et al. (1980).
This was due to the presence of very less concentration of simple and double sugar that was found in the samples. But, for the analysis of simple and double sugar after fermentation, the results were not calculated and determined from the percent concentration of sugar calculated as in the case of unfermented sample. It was determined that there were no simple and double sugars found in the fermented sample of maize dough. Based on the report of Akbar et al. (2012), the simple and double sugars are completely transformed through the fermentation process by yeast cells. Hence, it was determined that the reducing sugars which were found in the fermented maize dough samples were transformed to generate energy through the metabolic activities of yeast cells (Gerald, 2003) (Table 1).
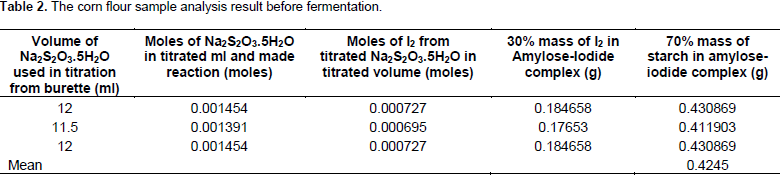
During the unfermented sample analysis, 12, 11.5 and 12 ml volume of Na2S2O3.5H2O were consumed in titration to change the blue black color solution of poly-Iodide complex into color less solution in the conical flask at three replications. The moles of Na2S2O3.5H2O in the volume of the three repeated titrations were 0.001454, 0.001391 and 0.001454 respectively. The moles of I2 in titrated volume of Na2S2O3.5H2O solution were 0.000727, 0.000695 and 0.000727. The calculated masses of I2 from moles of I2 were: 0.184658, 0.176539 and 0.184658 g, respectively. The mass of starch calculated in the 3 replications was 0.430869, 0.411903 and 0.430869 g with the mean value of 0.4245 g (Table 2).

The data in Table 3 showed that the result obtained from the sample was fermented for 17 h fermentation time. The data were calculated from each volume of Na2S2O3.5H2O consumed at the end point during titrations. The volumes of Na2S2O3.5H2O were 9.5, 9 and 8.5 ml for the three replications. From the volume of Na2S2O3.5H2O consumed during titration of iodine-thiosulfate titration method, the moles of thiosulfate were calculated as 0.001149, 0.001089 and 0.001028, respectively. From the calculated moles of thiosulfate, the moles of I2 were calculated as 0.000575, 0.000545 and 0.000514 for the three volume of Na2S2O3.5H2O consumed in the titration, respectively.
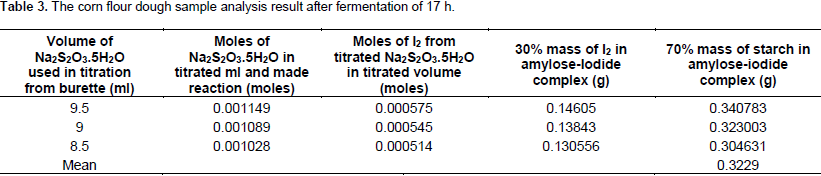
From the number of moles of I2, mass of I2 was calculated stoichiometrically as 0.14605, 0.138443 and 0.130556 g from which the mass of starch again was calculated as 0.340783, 0.323003 and 0.304631 g, respectively with the mean value of 0.3229 g. The results that were obtained from fermented samples after 20 h of fermentation time are presented in Table 4. The results calculated from the volume of Na2S2O3.5H2O consumed at the end point in titration were 5.5, 6 and 6.5 ml for the three replications performed. The moles of thiosulfate were 0.000665, 0.000725 and 0.000786; the moles of iodine were 0.000335, 0.000365 and 0.000395. From the moles of I2, the mass of I2 in the volume of Na2S2O3.5H2O consumed during titration was calculated stoichiometrically and therefore, the mass of I2 was 0.08509, 0.099822 and 0.099822 g, respectively.
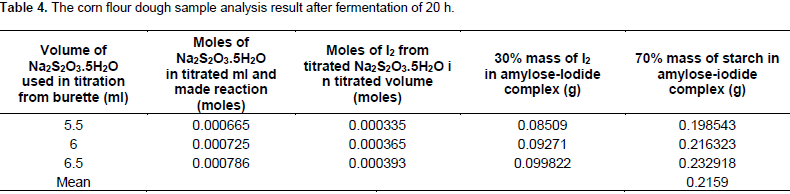
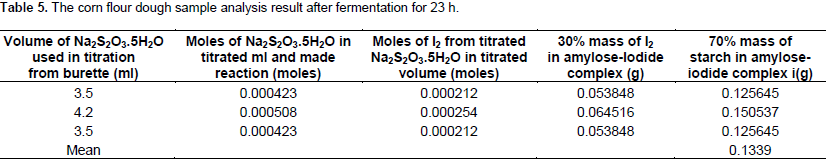
The mass of starch again was calculated from the mass of I as 0.198543, 0.216323 and 0.232918 g with the mean value of 0.2159 g. From the sample fermented for 23 h, the moles of thiosulfate were calculated stoichiometrically from the volume of Na2S2O3.5H2O consumed during titration at the end point where: 3.5, 4.2 and 3.5 ml for three replications; the moles of thiosulfate were calculated stoichiometrically as 0.000423, 0.000508, 0.000423 and then from the moles of thiosulfate, the moles of I2 were also calculated with the output of: 0.000212, 0.000254 and 0.000212. The mass of I2 was again computed from the moles of I2 stoichiometrically as 0.053848, 0.064516 and 0.053848 g, respectively. The 70% mass of starch was calculated as in the case mentioned above from literature and was determined from the mass of I2 as 0.125645, 0.150537 and 0.125645 g with the mean value of 0.1339 g (Table 5).

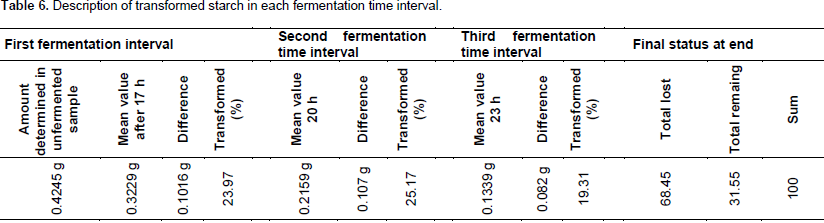
Table 6 showed that the mean value of starch concentration calculated from unfermented samples was 0.4245 g. The mean value of concentration of starch calculated in the sample fermented for 17 hrs was 0.3229 g with the difference of 0.1016 g (23.97%). In the second fermentation time interval, the mean value of starch concentration calculated from the sample fermented for 17 h was 0.3229 g. The mean value of starch concentration calculated from the samples fermented for 20 h was 0.2159 g and the difference between the two was 0.107 g (25.17%). During the third fermentation time interval, the mean value of starch concentration calculated for the sample fermented for 20 h was 0.2159 g; and the mean value calculated from the sample fermented for 23 h was 0.1339 g and the difference between is 0.082 g with the percent loss of 19.31%.

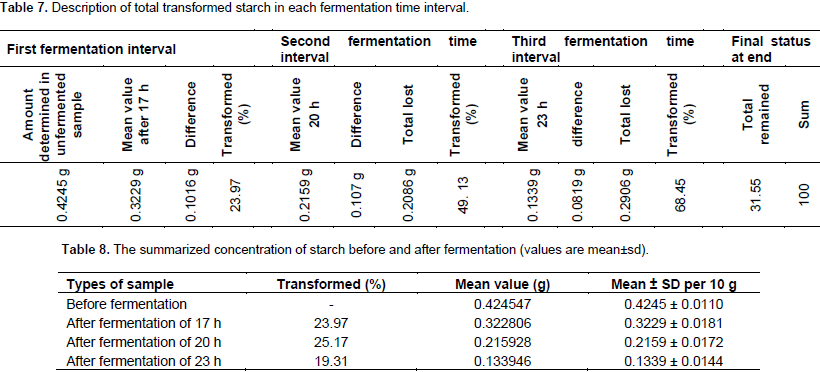
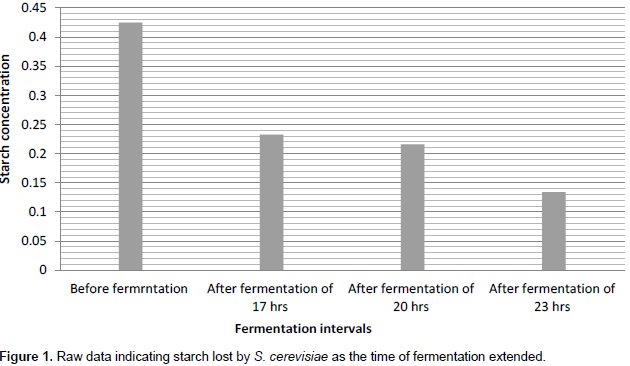
Table 7 indicated that the total percent of starch was transformed in each fermentation interval. In 17 h of fermentation, 0.1016 g (23.97%) of starch was transformed. In the sample fermented for 20 h of fermentation time, 0.2086 g (49.13%) of starch was transformed and from the sample fermented for 23 h of fermentation time, 0.2906 g (68.45%) of starch was transformed from the total starch concentration determined in unfermented sample (0.4245 g). Table 8 shows the percent of transformed starch during each fermentation time, the mean value obtained and mean ± sd. Figure 1 shows that the mean values of starch for each fermentation time were declined. Before fermentation, it was 0.4245 g; after fermentation of 17 h, it was 0.2329 g; after fermentation time of 20 h, it was 0.2159 g and after fermentation of 23 h, it was 0.1339 g. The figure clearly indicated that the concentration of starch depleted as the time of fermentation extended.
The finding of this research showed that the carbohydrate concentration of maize flour before fermentation and after different fermentation time to assess the amount transformed. From the data that were assessed from unfermented samples, 4.25% of starch was determined from amylose-iodide inclusion after analysis that was calculated by dividing 0.4245 g by 10 g and then multiplying by 100. According to International Starch Institute (1999), the percent concentration of starch in maize is 61.7% and in another research, it was recently reported that the total carbohydrate concentration in maize grain determined was between the ranges of 44.7 and 69.60% (Sule et al., 2014).
According to the result of this study, the percent concentration of starch extracted from unfermented maize dough sample was 4.25% that did not match with the percent concentration determined by International Starch Institute (1999) (Table 2). This was due to short period of sonication time which was only 15 min that resulted in incomplete dissolution of starch. If the sonication duration was extended from 15 to 30 min or above, the concentration of starch (amylose) that form poly-iodide complex increased and the percent concentration that was determined in this study could also be increased. The second reason could also be the presence of 19% of resistant starch in maize that did not dissolve by using CaCl2.2H2O as a solvent, even if, thesonication time increased (International Starch Institute, 1999).
The miller machine might not be able to grind the grain into very fine powder. As a result the molecules of starch could not be extracted from the matrix of maize dough sample. Tables 2 to 5 indicated the mean value of unfermented sample and the mean value of fermented samples for each fermentation time. Before fermentation, it was 0.4245 g, after fermentation of 17 h the mean value was 0.3229 g, after fermentation of 20 h it was 0.2159 g and after fermentation of 23 h it was 0.1339 g, indicating the depletion of starch molecules as the duration of fermentation extended. According to the results of this study, simple and double sugars in fermented sample were consumed by yeast cells during the first interval of fermentation time.
Yeast cells (S. cerevisiae) ability to secrete different types of enzyme depends on the complexity of carbohydrate (Akbar et al., 2012; Obri, 1994). Yeast cells use from the simplest form of carbohydrates to the most complex form of carbohydrates by pecking order. Glucose is used by yeast cells on the first line; sucrose, the second, maltose, the third and finally starch that is transformed. Therefore, in the fermented sample, there were no simple and double sugars detected. The amount of simple and double sugar molecules was totally absent in the fermented sample because, after all simple and double sugar was consumed by yeast cells, starch molecules began to be transformed. The transformation of starch indicated that all simple sugars were transformed into alcohol and carbondioxide (Akbar et al.,
2012).
The percent of transformed starch increased during 20 h of fermentation time from 23.97 to 25.17% because the yeast cells adapted well to their environment that has got plenty of resources. They multiplied to increase their number, resulting in higher rate of transformation of carbohydrate (Alton et al., 2002). But, during 23 h of fermentation time, it was again decreased from 25.17 to 19.31% because, the viable yeast count increased and the carrying capacity was reached. Not only was the carrying capacity reached because the resources depleted, but also due to the waste discharged from metabolic activity of yeast cells reduced the rate of the metabolic activity of the yeast cells (Table 6). This indicated the general trends of time and condition of population growth reported by Alton et al. (2002).
From the amount of starch that was found in the sample, 23.97% of starch was transformed after 17 h of fermentation time. 49.13% of starch was transformed from the sample fermented after 20 h of fermentation time and 68.45% of starch was transformed after 23 h of fermentation time. During the first time of fermentation (17 h of fermentation time), 0.1016 g (23.97%) of starch was transformed; during the second time of fermentation (20 h of fermentation time) 0.2086 g or 49.13% of starch was transformed and during the third time of fermentation (23 h of fermentation) 0.2906 g or 68.45% of starch molecules was transformed. This indicated that much amount of starch molecules was found in the sample transformed and used for the carbon sources of yeast cells as the time duration of fermentation extended. This agrees with the report indicated in literature that as the carrying capacity was reached the rate of metabolic activities also minimized (Alton et al., 2002) (Table 7).
CONCLUSION AND RECOMMENDATIONS
After the mass of starch that was found in all samples were calculated and determined, it was concluded that significant amount of vital substances was wasted by the consumption of yeast cells (S. cerrvisiae) if the duration of fermentation is elongated by the bakers of injera and bread from flour of maize grain. The depletion of starch molecules indicated that the simple sugar was already consumed by the yeast cell. The finding of the study revealed that significant concentrations of starch vital substances of carbohydrate were transformed and consumed by yeast cells as the time of fermentation extended. Therefore, the bakers should not use extended time of fermentation to save the amount of starch lost via fermentation.
The authors declare that there is no interest of conflicts.
The authors thank Addis Ababa University for permitting the science laboratory to perform the extraction and analysis processes. They also thank Adama Science and Technology University for the financial support.
REFERENCES
|
Akbar A, Aamir S, Moazzam RK, Muhammad A, Muhammad RA (2012). Yeast, its types and role in fermentation during bread making process. Pak. J. Food Sci. 22(3):171-179
|
|
|
|
Alton B, Kathleen G, Whitney CH, Chris K, Linda L, Peter R (2002). The Dynamics of Life. National Geographic Society. Columbus USA. pp. 96-99p.
|
|
|
|
|
Cavalieri D, McGovern PE, Hartl Dl, Mortimer R, Polsinelli M (2003). Evidence for S. cerevisiae fermentation in ancient wine. J. Mol. Evol. 57(1):S226-S232.
Crossref
|
|
|
|
|
Dickinson R (1999). Carbon Metabolism the Metabolism and Molecular Physiology of Saccharomyces cerevisiae. Philadelphia, P. A. Taylor and Francis.
|
|
|
|
|
Dunsmore A, Mellet P, Wolf M (1980). Some Factor Affecting the Lane and Eynon Titration method for determining Reducing Sugars in Sugar products. Sugar Milingling Research Institute. pp. 72-76.
|
|
|
|
|
Gerald K (2003). Cell and Molecular Biology Concepts and Experiment.3rd edition. Johnwiley and sons, inc.New York. 112p.
|
|
|
|
|
International Starch Institute (1999). Determination of reducing power and DE by Lane Eynon's Method. Science Park Aarhus, Denmark.
|
|
|
|
|
James M, Martin J, David A (2005). Food Microbiology. 7th edition.Singer science business media, Inc, 233 spring street, New York. P 31.
|
|
|
|
|
Knutson CA (1999). Evaluation of variation in Amylose. Iodine Absorbance Spectra. Bio. Pros.Res. 42:65-72.
|
|
|
|
|
Madigan MT, Martinko JM, Parker J (2003). Brock Bilogy of Microorganisms, 10th edition, pearson Education Inc.
|
|
|
|
|
Marcin B (2005-2008). Bpp Marcin Borkowiski ul. Archite ktow 14 05-270 Marki poland (http://f 30. X8top. Net retrined on July 15, 2017 Adama.
|
|
|
|
|
McGoven E, Zhang J, Zhang Z, Hall G, Moreau R, Nunez A, Butrym E, Richards P, Wang S, Cheng Z, Wang C (2004). Fermented beverages of pre-and proto-historic China. National Acad. Sci. 101 (51): 17593-17598.
Crossref
|
|
|
|
|
Michael J, Pelczar J, Chan R, Krieg L (2008). Microbiology. 37th edition Mcgraw hill publishing company limited. New York. pp. 624-626.
|
|
|
|
|
Obri KD (1994). Microbial studies on Corn Dough fermentation. American Association of cereal chemists. J. Cereal Chem. 71(2):186-188).
|
|
|
|
|
Sule EI, Umoh VJ, Whong MZ, Abudullahi IO, Alabi O (2014). Chemical and nutritional value of maize and maize products obtained from selected market in Kaduna state, Nigeria. Afr. J. Food Sci. technol. 5(4):100- 104.
|
|
|
|
|
Takano H, Naito S, Ishida N, Koizumi M, Kano H (2002). Fermentation process and grain structure of baked bread from frozen dough using freez-tolerant yeast. J. Food Sci. 67(7):2725-33.
Crossref
|
|
|
|
|
Vouillamoz JF, McGovern PE, Ergul A, Soylemezoglu G K, Tevzadze G, Meredith CP & Grando MS (2006). Genetic characterization and relationships of traditional grape cultivars from Transcaucasia and Anatolia. Plant Genetic Resources: characterization and utilization. 4 (2):144p.
Crossref
|
|
|
|
|
Walter S (1997). Kanasa Academy of Science. Transaction of the Kanasa academy of Sceince. Method Determination Starch 28:172-174.
|
|
|
|
|
Wang L, Swain E, Hesseltine C (1980). Phytase of molds used in oriental food fermentation. J. Food Sci. 45(5):1262.
Crossref
|
|
|
|
|
World Food Program (2000). Percentage concentration of carbohydrate nutrients in corn grain.
|
|