ABSTRACT
The coconut tree (Cocos nucifera) is widely referred as the “tree of life” for its important role in the livelihoods of 10 million persons from over 90 countries globally. In Kenya, the coconut sub-sector is valued at KES 25 billion, yet only 65% is utilised, which is partly contributed by insufficient knowledge of the coconut’s physico-chemical features and investment in the sector. Physico-chemical analysis of four coconut varieties’ kernel grown in two counties (Kilifi and Kwale) of Kenya was carried out. Based on the de-husked coconut fruit, coconut kernel was the highest component (46.58 - 48.70%) in comparison to shell (25.93±0.72% - 28.46±0.29%) and water (23.75±1.07% - 27.11±1.49%) across the varieties. The colour of the coconut kernel was marked by generally high L* values (85.34 - 93.35) and low a* (0.51 - 0.81) and b* (1.53 - 2.20) values among the varieties confirming the milky- white colouration of the kernel. All the varieties contained high crude fat (35.01±1.0 - 38.28±1.09%) content. Fatty acid analysis profile revealed that lauric acid (45.91- 50.72%) was the predominant fatty acid. Most of the oil extract was saturated (91%) but comprising of middle chain fatty acids. This indicates stability for storage and suitability for use in ketogenic diets.
Key words: coconut kernel, coconut variety, colour, proximate analysis, fatty acid profile.
Coconut (Cocos nucifera L.), as a member of the Palmacea family, grows in the tropics and is generally referred to as a coconut palm (Patil and Benjakul, 2018). The coconut palm is commonly termed as the “tree of life,” “heavenly tree,” “tree of abundance,” or “nature’s supermarket” due to its important role as a direct source of materials, nutrition, and income to over 10 million households in about 90 countries worldwide (Omar and Fatah, 2020). Asia tops in the world as the major coconut producer with 90% of the total production emanating from Indonesia, India, Philippines, Sri-Lanka, and Thailand (Patil and Benjakul, 2018). Generally, the entire coconut fruit takes a year to mature with various developmental stages: the husk and shell develop first, followed by enlargement of embryo sac cavity, which is then filled with liquid; the husk and shell becomes thicker after 4 months; the meat starts to form against the inner wall of the cavity after 6 months with the first layer being thin and gelatinous; after 8 months, the soft white endocarp turns dark brown and becomes hard; and lastly the fruit becomes mature within 1 year (12 months) (Patil and Benjakul, 2018).
The mature coconut fruit contains 25% water, 28% meat, 12% shell, and 35% husk and weighs between 3 and 4 kg (DebMandal and Mandal, 2011). On a global scale, approximately 70% of coconuts are consumed locally with more than half being eaten fresh (Patil and Benjakul, 2018). The edible coconut products are predominantly obtained from the meat (solid endosperm) and water (liquid endosperm) (DebMandal and Mandal, 2011). In obtaining the edible portion, the shell of the coconut is removed after eliminating the husk, followed by pairing and draining water. The meat/kernel is then manually collected and grated to yield other products. The coconut kernel is a good source of protein, fat, fibre and carbohydrate (Appaiah et al., 2014; Wynn, 2017; Patil et al., 2017). Lauric acid, a saturated, medium-chain fatty acid is its predominant fatty acid (Laureles et al., 2002; Azeez, 2007; Ghosh et al., 2014; Pham, 2016; Boateng et al., 2016). The composition of the mature coconut kernel, however, is dependent on variety, nut maturity, geographical location, and cultural practices (Senphan and Benjakul, 2015).
Globally, studies on the composition of coconut kernel are either old or incomplete in their scope (that is, lacking some constituents). For instance, proximate analysis is “saturated” with old studies (Dendy and Timmins, 1973; Grimwood and Ashman, 1975; Balachandran et al., 1985; Chakraborty, 1985; Kwon et al., 1996). Recent studies lack analysis of fibre, carbohydrate, and protein (Appaiah et al., 2014; Patil et al., 2017). Moreover, in relation to fatty acid profile, majority of studies omit analysis of either caproic acid (C6:0) or arachidic acid (C20:0) (Laureles et al., 2002; Azeez, 2007; Ghosh et al., 2014; Pham, 2016; Boateng et al., 2016) all of which are important in determining the nutritional and health benefits of the oil.
In Kenya, the coconut sub-sector is valued at KES 25 billion ($231 million), yet only 65% of the market is exploited, which is partly contributed by insufficient research (AFA-NOCD, 2015). The Kenyan coconut sub-sector “is depicted as the sleeping giant” (Muhammed et al., 2012). By applying strategic interventions, more than 100,000 farmers can be supported to contribute to over 1.5% of the agricultural GDP and 0.4% of the national GDP (KCDA, 2013). This study was carried out to analyse the physicochemical parameters of kernel from different coconut varieties grown at the Kenyan coast targeting enhancing the utilization window of coconut.
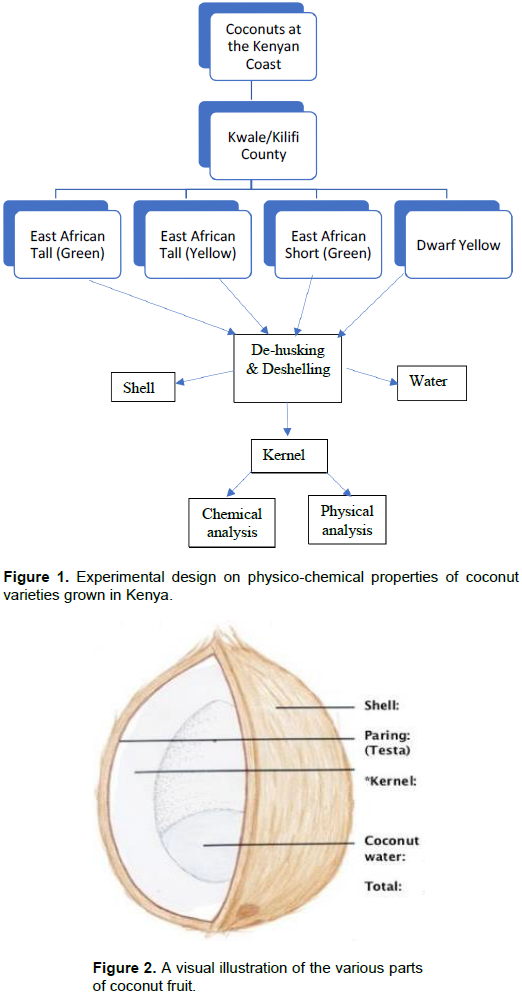
Study design
Coconut fruit of four varieties (East African Tall-Green, East African Tall-Yellow, East African Short-Green, and Dwarf-Yellow) were obtained from farmers at Msambweni (Kwale County). However, only two of the varieties were obtained in Kilifi County (that is, only East African Tall- Green and East African Short-Green) at the time of research. It was assumed that all the fruits were mature based on the solid brown colouration of the husk. The fruits, with their husks intact, were then stacked in bags and transported in a well-ventilated van to Jomo-Kenyatta University of Agriculture and Technology post-harvest laboratory for subsequent analysis as shown in Figure 1.
Determination of coconut fruit composition
The various coconut fruits were first de-husked. The de-husked fruits were weighed, deshelled, and the various coconut components (shell, kernel, and water) separated, and subjected to physical and chemical analysis (Figure 1). An illustration of the various components is shown in Figure 2. After weighing, the weight of individual component was divided by the total weight of the coconut fruit and expressed as a percentage.
Determination of physico-chemical properties of coconut Kernel
Colour of coconut kernel
Colour measurement for the kernels of different coconut varieties were determined using a handheld HunterLab colour difference meter (Minolta, Chroma Meter CR-200; Minolta Camera Co., Ltd., Osaka, Japan), which uses the principle of Opponent-Colour Theory assuming that the human eye receptors perceive colour as pairs of opposites: L*-scale (light vs. dark); a*-scale (red vs. green); and b*scale (yellow-blue) (Patil et al., 2017). Calibration of the instrument was done prior to colour measurement of samples with the aid of a white and black ceramic plate. The measurements were done in triplicate while putting into consideration three sections of the sample. The results were expressed using the Lab* colour system. Difference in colour change between the samples and the standard (?E*) and the chromaticity difference (?C*) were also determined using the following equations (Patil et al., 2017):
?E* = √[(?L*)2 + (?a*)2 + (?b*)2] C* = √[(?a*)2 + (?b*)2]
?C* = C*sample - C*standard
Where,
?L*, ?a*, and ?b*are the differences between the corresponding colour element of the sample and the standard colour of coconut kernel (L* = 93.55, a* = 0.84, and b* = 0.37).
Proximate analysis
First, the coconut kernel was grated followed by proximate analyses of the samples in triplicates (AOAC, 2000). The moisture and ash content were determined using volatilization gravimetry (that is, thermal decomposition of the sample with the aim of measuring the resulting change in mass), crude protein by semi micro-Kjedahl method, crude fat by Soxhlet method, crude fibre by acid and alkali digestion method, and carbohydrates by difference.
Moisture content
About 5 g of the sample was weighed and also the weight of the moisture dish taken. The sample while in the moisture dish was placed in the moisture oven and the temperature upscaled to 105°C. The sample was then dried at this temperature until constant weight was achieved, removed, cooled, and ultimately weighed. The amount of moisture in the sample(s) was calculated using the below formula:
Carbohydrate
Carbohydrate was determined by difference [that is, 100 – (crude fat +crude protein+ash + moisture + crude fibre)].
Fatty acid profile
The NaOCH3-MeOH methylation process as described by Wang et al. (2015) was used. In this process, 0.5 g of dry ground coconut kernel was measured and placed in the test tube and 2 ml of 0.5 M sodium methoxide solution added. The test tube was then placed in the oven to enhance reaction for 1 h 50 min at 55°C with mixing for 5 s after every 20 min. Then, 2 ml of saturated sodium bicarbonate and 3 ml of n-hexane were added followed by well-mixing of the tubes. Finally, the extracts (organic layer containing the fatty caid methyl esters) were removed and used for gas chromatography (GC) analysis. Agilent 7890B gas chromatograph (Agilent Technologies, Stevens Creek Blvd, Santa Clara, CA, United States) equipped with DB-FATWAX UI, 30 m x 0.25 mm, 0.25 μm column attached to mass spectrometry (MS) detector was used. Conditions set for analysis included: split mode of injection (split ratio 50:1) at 250°C; oven temperature 50°C (2 min), 50°C/min to 174°C (14 min), 2°C/min to 215°C (25 min); hydrogen as the carrier gas at constant flow, 40 cm/s at 50°C, and injection volume (1 µl). Fatty acid identification was done using a standard fatty acid methyl ester (FAME) mix. The composition of fatty acid was qualitative and quantitatively analysed using Agikent MassHunter Software (Agilent Technologies, Stevens Creek Blvd, Santa Clara, CA, United States) and reported by the normalisation method and expression done in terms of percentage relative composition of individual fatty acids.
Statistical analysis
The results were subjected to analysis of variance (ANOVA) using Stata software version 13 (Stata Corp, College Station, TX, USA), and expressed as means ± standard deviations and separation of means carried out by the Bonferroni adjustment at p<0.05.
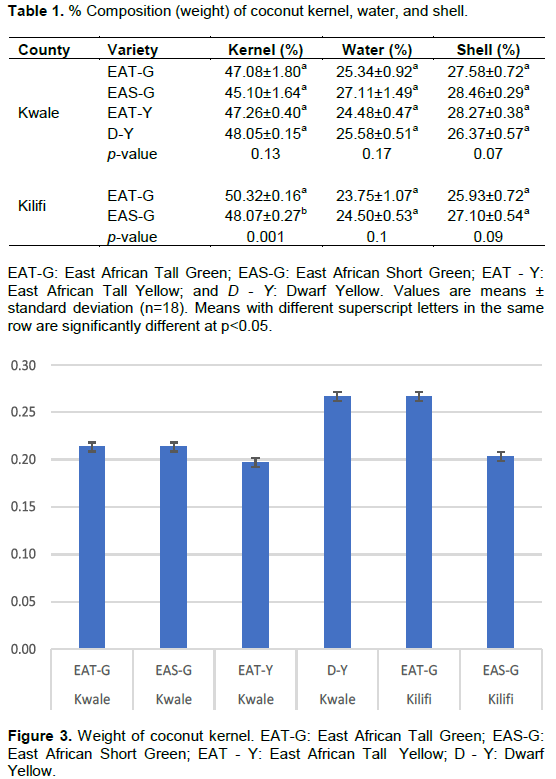
Coconut composition
Among the three de-husked coconut fruit constituents, coconut kernel had the highest composition (45.10±1.64%-50.32±0.16%), followed by coconut shell (25.93±0.72% - 28.46±0.29%), and lastly water (23.75±1.07% - 27.11±1.49%) with no significant difference among the varieties except the coconut kernel of varieties from Kilifi county (Table 1). A similar order in the composition of kernel, shell, and water is consistent with the literature (DebMandal and Mandal, 2011; Wynn, 2017). Among the three, coconut kernel is the most used as far as food- based products are concerned (Sangamithra et al., 2013). Accordingly, the East African Tall - Green (EAT-G) from Kilify county had the highest kernel (50.32±0.16%) as compared to its counterpart from Kwale county making it ideal for processing of coconut-food products. In terms of kernel weight, it ranged between 0.20±0.01 kg - 0.27±0.01 kg (Figure 3), which, however, is low as compared to kernel weight of coconut grown in major producing countries such as Indonesia, ranging between 0.32and 0.6 kg (Tuhumuri et al., 2016). Such a difference is associated with differences in coconut variety, stage of maturity, geographical location, and cultural practices (Senphan and Benjakul, 2015; Patil et al., 2017). The kernel weight, which is related to its overall composition, is a critical parameter in terms of production with higher weight leading to higher production efficiency due to generation of more kernel-based products as compared to lower weight (Mpagalile, 2005; Sangamithra et al., 2013).
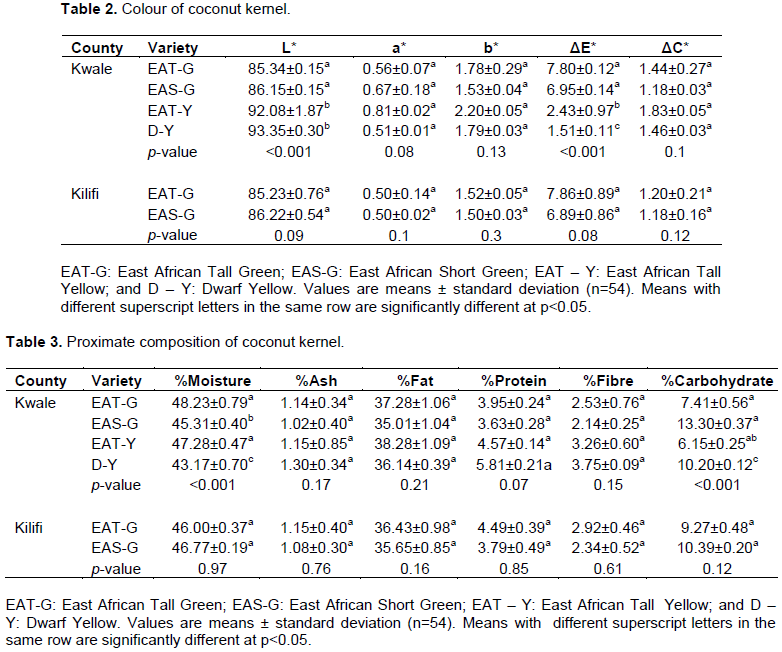
Colour of coconut kernel
Generally, L* values were high (85.23±0.76 - 93.35±0.30), followed by b* values (1.50±0.03 - 2.20±0.05), and lastly a* values (0.50±0.14 - 0.81±0.02) as evident in Table 2. These values are agreement with those generated by other studies (Ghosh et al., 2014; Patil et al., 2017). Coconut kernel has a milky white colouration, and indication of lightness as manifested by high L* values (Patil et al., 2017). The L* values were significantly different among the coconut varieties from Kwale county with the highest being observed in Dwarf Yellow (D-Y) – 93.35±0.30 and the lowest in East African Tall- Green (EAT-G) - 85.34±0.15. Also, ?E* (the change in colour - L*, a* and b* values – as compared to the standard - L* = 93.55, a* = 0.84, and b* = 0.37) varied among the coconut varieties from Kwale county: the highest ?E* was observable in EAT-G (7.80±0.12), whereas the lowest in D-Y (1.51±0.11). Such differences can be attributed to genotypic variation (Patil et al., 2017). Nonetheless, colour comparison between the two counties, generally, did not show much difference at p<0.05.
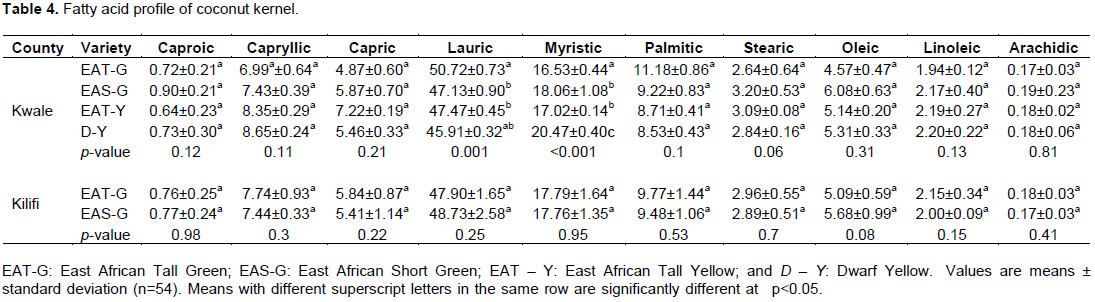
Proximate analysis
As evident in Table 3, the proximate analysis revealed high moisture content (43.17±0.70- 48.23±0.79%), followed by crude fat (35.01±1.0 - 38.28±1.09%), then carbohydrate (6.15±0.25- 13.30±0.37%), crude protein (3.63±0.28 - 5.81±0.21%), crude fibre (2.14±0.25 - 3.75±0.09%), and lastly ash content (1.02±0.40 - 1.30±0.34%). A similar order is corroborated by existing studies (Dendy and Timmins, 1973; Grimwood and Ashman, 1975; Balachandran et al., 1985; Chakraborty, 1985; Kwon et al., 1996; Patil et al., 2017; Wynn, 2017).
Crude fat content did not vary significantly among the varieties in both counties. East African Tall- Yellow (EAT-Y) had the highest crude fat content (38.28±1.09%), while East African Short-Green (EAS-G) had the lowest crude fat content (35.01±1.0), all of which came from Kwale county. These values compared well with the range reported by Appaiah et al. (2014) and Patil et al. (2017). Crude fat content of coconut is directly proportional to the extractable oil content (Sangamithra et al., 2013; Ghosh et al., 2014), and therefore EAT-Y from Kwale county would be preferable for the production of oil-based coconut products like virgin coconut oil. For carbohydrate, the results indicated a significant difference across the varieties from Kwale county and not from Kilifi. EAS-G had the highest content (13.30±0.37%) and EAT-Y the least content (6.15±0.25%), all from the same county (i.e., Kwale). This variation may be attributed to genotypic difference between the varieties. Nonetheless, comparison based on the two counties show variation in carbohydrate content, for example, EAS-G from Kwale recorded carbohydrate content of 13.30±0.37%, whereas EAS-G from Kilifi had carbohydrate content of 10.39±0.20%, and such variation may be due to difference in coconut variety, stage of maturity, and geographical location (Senphan and Benjakul, 2015). These values are comparable with the existing studies (Chakraborty, 1985; Kwon et al., 1996; Ghosh et al., 2014).
Crude protein did not vary significantly across the coconut varieties in both counties. D-Y had the highest crude protein content (5.81±0.21%), while EAS-G had the lowest content (3.63±0.28%) with the variation being attributed to genotypic difference since they were sourced from the same county (Kwale). These findings are corroborated by other studies (Chakraborty, 1985; Kwon et al., 1996; Pham, 2016).
Crude fibre, just like crude protein, did not differ significantly across the varieties in each County. The highest crude fibre content was recorded by D-Y (3.75±0.09%) whereas the least crude fibre content was observed in EAS-G (2.14±0.25%) with genotypical variation being the likely cause. A similar range is supported by other studies (Kwon et al., 1996; Pham, 2016). The fibre content is important in diet decreasing chances of constipation and maintaining bowel health (Barber et al., 2020).
Similarly, the total ash did not vary significantly among the varieties in both counties. D-Y had a relatively high ash content (1.30±0.34%) compared to EAS-G, which had the lowest ash content (1.02±0.40%) with the possible cause of this variation being varietal difference and soil composition. This range is an agreement with the findings of most studies (Chakraborty, 1985; Kwon et al., 1996; Patil et al., 2017; Wynn, 2017). Coconut kernel has relatively high minerals like iron, magnesium, phosphorous, zinc, and sodium (Wynn, 2017) signifying that varieties such as EAS-G may be preferable.
Finally, moisture content differed significantly across varieties grown in Kwale county as opposed to Kilifi county. The highest moisture content was observed in EAT-G (48.23±0.79%) while the lowest moisture content was realised by D-Y (43.17±0.70%). This range is corroborated by a plethora of studies (Chakraborty, 1985; Kwon et al., 1996; Patil et al.,2017; Wynn, 2017). Low moisture, unlike high moisture, is preferable since water content in indirectly proportional to the dry matter required for the crispiness of coconut flakes, durability of coconut flour, and increased production of virgin coconut oil and coconut protein powder (Sangamithra et al., 2013) and as such, D-Y would be preferable (Table 3).
Fatty acid profile
Table 4 shows the fatty acid profiles of coconut kernel, and revealed that the highest component was lauric- C12:0 (45.91±0.32% - 50.72±0.73%) and the least was arachidic - C20:0 (0.17±0.03%-0.19±0.23%). These values are supported by other studies (Laureles et al., 2002; Azeez, 2007; Ghosh et al., 2014; Pham, 2016; Boateng et al., 2016). A significant difference was only observed in the values of lauric and myristic across the varieties from Kwale county. From the results, over 90% of the coconut oil was saturated (caproic - C6:0, caprylic - C8:0, capric - C10:0, lauric - C12:0, myristic - C14:0, palmitic- C16:0, stearic- C18:0, and arachidic - C20:0). Additionally, the ratio of saturated fatty acid (SFA - C6:0,C8:0, C10:0, C12:0, C14:0, C16:0, C18:0, and C20:0): mono-unsaturated fatty acid (MUFA – C18:1): polyunsaturated fatty acid (PUFA – C18:2) was found to be 1: 0.06: 0.02 confirming the 91% saturation, which does not meet the recommendation by the American Heart Organisation of 1:1:1 (SFA: MUFA: PUFA) in edible fats and oils (Gulla and Waghray, 2011). Among the coconut varieties, EAT-G from Kwale county seemed to relatively have high level of saturation with a lauric content of 50.72±0.73% in comparison to D-Y, which had the lowest lauric content (45.91±0.32%), from the same county and, therefore, the variation is attributable to genotypic difference. This high level of saturation was attributed to high atherogenicity index (18.03±0.71- 19.57±0.68) and thrombogenicity index (8.48±0.56 - 9.32±0.87) of the oil extracted from the kernels of various coconut verities. High atherogenicity and thrombogenicity indices are indicators of susceptibility of the consumers to developing cardiovascular diseases. Accordingly, Boateng et al. (2016) argue that since coconut oil is saturated, it is not highly preferred by a section of health-conscious consumers. Nonetheless, the presence of high-level saturated acids is an indication of shelf stability of the coconut oil (Ghosh et al., 2014). Also, it should be noted that palmitic acid, which is the most abundant and highly lipotoxic dietary fatty acid (Martinez et al., 2015; Carta et al., 2017), is relatively low in coconut oil (Table 4).
Moreover, almost half coconut oil comprises of lauric acid (commercially, coconut oil is referred to as lauric acid), a medium chain fatty acid which upon absorption is transported directly to the liver (unlike the long chain fatty acids), where it is metabolized to produce energy and ketone bodies, rather than being stored as fat (Dayrit, 2015). A recent study found that supplementation of a high fat diet with 3% palmitic acid led to a significant increase in visceral fat, insulin resistance and both visceral adipose and hepatic inflammation; while supplementation with 3% lauric acid led to an even higher increase in visceral fat, but without insulin resistance, and with less inflammation (Saraswathi et al., 2020). The laurate-associated higher visceral fat increase in this case may be considered to be due to adipose tissue expansion through increased adipocyte numbers (hyperplasia) in order to safely store the excess fat, rather than the pro-inflammatory, hypertrophic expansion caused by palmitic acid, where pre-adipocyte differentiation is impaired, and the existing adipocytes end up storing excess fat (Caputo et al., 2020). Moreover, from the mentioned study of Saraswathi et al. (2020) it cannot be concluded that lauric acid is obesogenic, because it was supplemented to a high fat diet. In addition, the palmitate- but not the laurate- supplemented high fat diet caused increased liver enzymes aspartate amino-transferase and alanine aminotransferase (Saraswathi et al., 2020), which predict the development of (pre)diabetes (Oberlinner et al., 2010).The potential benefits of coconut oil against diabetes and other cardiometabolic disorders have indeed been reported, although the results have been mixed (Malaeb and Spoke, 2020). Apart from the medium chain fatty acids, coconut contains the beneficial monoglyceride, monolaurin, which is antimicrobial (antibacterial, antiviral, and antifungal), antitoxic, immune-modulating, and metabolic-enhancing, (Azeez, 2007; Ghosh et al., 2014; Pham, 2016). The main limitation of coconut oil usage as a dietary fat, however, is its low level of essential fatty acid, linoleic acid (Azeez, 2007). Nevertheless, linoleic acid is abundant in many readily available dietary oils such as corn, sunflower and soybean oils.
Generally, results of the physico-chemical analysis of coconut kernel grown at the Kenyan Coast did not differ significantly across the varieties in the two counties. Among the components of de- husked coconut fruit, coconut kernel was averagely the highest (47.67±0.90%), followed by shell (27.20±0.51%), and finally water (25.43±1.28%). In addition, high L* values and low a* and b* confirmed the milky white colouration of coconut kernel. All the varieties had a relatively high crude fat content which might indicate high calorific value of the kernel. Although the oil from coconut is largely saturated, it is low in the highly lipotoxic palmitic acid, and high in medium chain fatty acids, especially lauric acid, which may be more beneficial than harmful.
The authors have not declared any conflict of interests.
REFERENCES
|
Agriculture and Food Authority (AFA)-Nuts/Oil Crops Directorate (NOCD) (2015). Coconut value chain.
|
|
|
|
Association of Official Analytical Chemists (AOAC) (2000). Official methods of analysis of AOAC, International 17th edition. Gaithersburg, MD, USA Association of Analytical Communities.
|
|
|
|
|
Appaiah P, Sunsil L, Prasanth Kumar, PK, Gopala Krishna AG (2014). Composition of coconut testa, coconut kernel and its oil. Journal of the American Oil Chemists' Society 91(6):917-924.
Crossref
|
|
|
|
|
Azeez S (2007). Fatty acid pro?le of coconut oil in relation to nut maturity and season in selected cultivars/hybrids. British Food Journal 109(4):272-279.
Crossref
|
|
|
|
|
|
|
Balachandran C, Arumughan C, Mathew A (1985). Distribution of major chemical constituents and fatty acids in different regions of coconut endosperm. Journal of the American Oil Chemists' Society 62(11):1583-1586.
Crossref
|
|
|
|
|
Barber TM, Kabisch S, Pfeiffer A, Weickert MO (2020). The health benefits of dietary fibre. Nutrients 12(10):3209-3221.
Crossref
|
|
|
|
|
Boateng L, Ansong RS, Owusu WB, Steiner-Asiedu M (2016). Coconut oil and palm oil's role in nutrition, health and national development: a review. Ghana Medical Journal 50(3):189-196.
Crossref
|
|
|
|
|
Caputo T, Tran VDT, Bararpour N, Winkler C, Aguileta G, Trang KB, Giordano Attianese GMP, Wilson A, Thomas A, Pagni M, Guex N, Desvergne B, Gilardi F (2020). Anti-adipogenic signals at the onset of obesity-related inflammation in white adipose tissue. Cellular and Molecular Life Sciences 78:227-247.
Crossref
|
|
|
|
|
Carta G, Murru E, Banni S, Manca C (2017). Palmitic acid: physiological role, metabolism and nutritional implications. Frontiers in Physiology 8:902-921.
Crossref
|
|
|
|
|
Chakraborty P (1985). Functional properties of coconut protein isolate obtained by ultra?ltration. Journal of Food Science and Technology 22(4):248-254.
|
|
|
|
|
Dayrit FM (2015). The properties of lauric acid and their significance in coconut oil. Journal of the American Oil Chemists' Society 92(1):1-15.
Crossref
|
|
|
|
|
DebMandal M, Mandal S (2011). Coconut (Cocos nucifera L.: Ericaceae): In health promotion and disease prevention. Asian Pacific Journal of Tropical Medicine 4(3):241-247.
Crossref
|
|
|
|
|
Dendy D, Timmins W (1973). Development of a process to extract protein and oil from fresh coconut. Oleagineux 28:589-594.
|
|
|
|
|
Ghosh PK, Bhattacharjee P, Mitra S, Sarkar MP (2014). Physicochemical and phytochemical analyses of copra and oil of Cocos nucifera L. (west coast tall variety). International Journal of Food Science 2014:1-8.
Crossref
|
|
|
|
|
Grimwood BE, Ashman F (1975). Coconut palm products: Their processing in developing countries. Rome, Italy: Food and Agriculture Organisation.
|
|
|
|
|
Gulla S, Waghray K (2011). Effect of storage on physicochemical characteristic and fatty acid composition of selected oil blends. Journal of Lipid Science 3:35-46.
Crossref
|
|
|
|
|
Kenya Coconut Development Authority (KCDA) (2013). National coconut survey 2013. Nairobi, Kenya: Apex Consulting Africa Limited.
|
|
|
|
|
Kwon K, Park KH, Rhee KC (1996). Fractionation and characterization of proteins from coconut (Cocos nucifera L.). Journal of Agricultural and Food Chemistry 44(7):1741-1745.
Crossref
|
|
|
|
|
Laureles LR, Rodriguez FM, Reaño CE, Santos GA, Laurena AC, Mendoza EMT (2002). Variability in fatty acid and triacylglycerol composition of the oil of coconut (Cocos nucifera L.) hybrids and their parentals. Journal of Agricultural and Food Chemistry 50(6):1581-1586.
Crossref
|
|
|
|
|
Malaeb S, Spoke C (2020). The glucose-lowering effects of coconut oil: a case report and review of the literature. Case Reports in Endocrinology 2020(4):1-6.
Crossref
|
|
|
|
|
Martinez L, Torres S, Baulies A, Alarcón-Vila C, Elena M, Fabriàs G, Casas J, Caballeria J, Fernandez-Checa JC, García-Ruiz C (2015). Myristic acid potentiates palmitic acid-induced lipotoxicity and steatohepatitis associated with lipodystrophy by sustaining de novo ceramide synthesis. Oncotarget 6(39):41479-41496.
Crossref
|
|
|
|
|
Mpagalile JJ (2005). Effect of processing parameters on coconut oil expression efficiencies. International Journal of Food Sciences and Nutrition 56(2):125-132.
Crossref
|
|
|
|
|
Muhammed N, Kashindi G, Shauri H, Hashim S, Maling'a J (2012). Dissemination of market access and technology information among coconut farmers: A case study of Kilifi County in Kenya. International Journal of Agricultural Sciences 2(5):153-156.
|
|
|
|
|
Oberlinner C, Zober A, Nawroth PP, Humpert PM, Morcos M (2010). Alanine-aminotransferase levels predict impaired glucose tolerance in a worksite population. Acta Diabetologica 47(2):161-165.
Crossref
|
|
|
|
|
Omar Z, Fatah FA (2020). Unravelling the factors affecting agriculture profitability enterprise: Evidence from coconut smallholder production. Accounting 6:493-500.
Crossref
|
|
|
|
|
Patil U, Benjakul S (2018). Coconut milk and coconut oil: Their manufacture associated with protein functionality. Journal of Food Science 83(8):2019-2027.
Crossref
|
|
|
|
|
Patil U, Benjakul S, Prodpran T, Senphan T, Cheetangdee N (2017). A comparative study of the physicochemical properties and emulsion stability of coconut milk at different maturity stages. Italian Journal of Food Science 29(1):145-155.
|
|
|
|
|
Pham LJ (2016). Coconut (Cocos nucifera). In TA McKeon, DG Hayes, DF Hildebrand, RJ Weselake, Industrial oil crops. Academic Press and AOCS Press pp. 231-242.
Crossref
|
|
|
|
|
Sangamithra A, John SG, Prema S, Chandrasekar V, Sasikala S, Hasker E (2013). Coconut: An extensive review on value added products. Indian Food Industry Magezine 32(6):29-36.
|
|
|
|
|
Saraswathi V, Kumar N, Gopal T, Bhatt S, Ai W, Ma C, Desouza C. (2020). Lauric acid versus palmitic acid: effects on adipose tissue inflammation, insulin resistance, and non-alcoholic fatty liver disease in obesity. Biology 9(11):346-359.
Crossref
|
|
|
|
|
Senphan T, Benjakul S (2015). Chemical compositions and properties of virgin coconut oil extracted using protease from hepatopancreas of Paci?c white shrimp. European Journal of Lipid Science and Technology 118(5):761-769.
Crossref
|
|
|
|
|
Tuhumuri E, Sancayaningsih RP, Setiaji B, Usman S (2016). The quality of the harvesting coconut (Cocos nucifera L. 'Tall Type') in Sasi Kelapa culture in Namrole of South Buru, Indonesia. AIP Conference Proceedings 1744:020021.
Crossref
|
|
|
|
|
Wang J, Wu W, Wang,X, Wang M, Wu F (2015). An effective GC method for the determination of the fatty acid composition in silkworm pupae oil using a two-step methylation process. Journal of the Serbian Chemical Society 80(1):9-20.
Crossref
|
|
|
|
|
Wynn T (2017). Nutrition studies on mature and immature coconut meat and coconut water. Yadanabon University Research Journal 8(1):1-8.
|
|