Full Length Research Paper

ABSTRACT
Social media usage and applications are on the upsurge. Marketers must synchronize advertising content, consumer profile and social media applications for impactful advertising. Nevertheless, social media applications proportionally grew in numbers and types giving both marketers and consumers endless options and creating confusion in choice. This study used factor analysis to classify social media into three classifications marketers can use to target consumers during social media marketing campaigns. The study suggested novel practical marketing stratagems for social media marketing practitioners. This study pursued a positivist research philosophy. In particular, an empirical research methodological approach was adopted for this study. The reliability of the scales in the research instrument was tested using the Cronbach alpha coefficient. Systematic random sampling was employed to reach a sample of 355 consumers. A self-administered questionnaire was used to collect data. Structural Equation Modelling (SEM) was used to perform regression analysis in validating the research model. Findings revealed three types of social media exist, formal, informal and entertainment social media. Formal social media being the main social media is influenced by entertainment social media and informal social media. In addition, informal social media platforms are WhatsApp, Twitter Instagram, Facebook, and others. While entertainment social media platforms are YouTube and Snapchat. Future research can focus on social media products for marketing as well as focused social media on age marketing. Future studies can determine the relationships between age versus focused social media usage and product versus focused social media correlations.
Key words: Social media types, formal social media, informal social media and entertainment social media; impactful marketing.
INTRODUCTION
The International Telecommunications Union Report (2018) indicated that there is a global explosion in the use of handheld electronic communication devices such as mobile phones, digital music players, and handheld Internet access devices - culminating in the social media era. In particular, the number of such devices is multiplying and subscriptions to services offered through these devices are expanding. For example, the growth in the number of such subscriptions worldwide is at a compounded annual rate of 24% from 2000 to 2016 with the number of mobile subscribers reaching 4 billion in December 2017 (Al-alak and Alnawas, 2018).
Social media marketing has become one of the fastest growing marketing strategies globally (Berliner, 2016). Marketers are using social media marketing to appeal and position their products to consumers with great success. However with the number of social media sites and applications being on the increase, marketers have to ensure advertising content, consumer profile and social media application match for effective advertising.
Factor analysis was applied to classify social media into three main classifications marketers can use to target consumers more effectively during social media marketing campaigns. The study also wants to suggest fresh practical ideas for marketing practitioners, in the field of social media marketing.
LITERATURE REVIEW
Kaplan and Haenlein (2010, p. 22) suggest that Social Media Marketing is a subsection of Mobile Marketing and that Social Media as we understand it today probably started around 1994 when Bruce and Susan Abelson founded ‘‘Open Diary’’, an early social networking site that brought together online diary writers into one community.
Srivastava (2005) brings across a strong argument by alluding that the development in Social Media marketing resulted in Mobile phone technology evolving immensely over the past decade, from phones that could only perform basic operations to sending short message services and making calls to more advanced and sophisticated functions like sending emails and making video calls. He concluded by describing modern mobile phones as having evolved into a pervasive tool and key 'social’ objects. Although Kaplan and Haenlein (2010) and Srivastava (2005) agree on the evolution in mobile phone technology, whereby Srivastava (2005) summaries by highlighting the enormous abilities of mobile phones that came about due to advancement in technology, a need for growing communication and the development of new software applications ultimately resulted in the evolution of social media.
The mobile phone in today’s societies has become a central necessity to the lives of many consumers, particularly to the lives of young adults and teens (Roach 2009, p. 149). It is an addiction for many because they always carry it on them and constantly check it for various updates on popular social media applications such as Facebook, WhatsApp, Twitter Instagram, YouTube, LinkedIn, Pinterest and Snapchat just to mention a few (Johnson and Clark, 2013). Consumers have long moved away from using the mobile device for personal use only but a means to connect with friends, family and the rest of the world through social media (Johnson and Clark, 2013). It has become a definition of individualism, personality and a symbol of wealth. For marketers, “the widespread adoption of mobile phones represents a huge marketing opportunity to reach and serve consumers anytime, anywhere” (Roach 2009, p. 149).
Persaud and Azhar (2012) state that while consumers adopt mobile phones to enhance their private and social lives, marketers have identified marketing channels through mobile phones. These different perspectives imply that marketers must ensure that their mobile phone marketing strategies are not intrusive (Persaud and Azhar, 2012). This is also not sufficient to warrant that consumers want to receive mobile advertisements on their mobile devices but rather suggest that more studies are needed to bridge the gap between mobile marketing consumer needs and marketers’ intentions.
Smartphones have the capability to transform consumers’ shopping experiences and add marketing value; consumers can now effortlessly and speedily shop across numerous channels such as physical store, web-based, and mobile with considerably greater level of convenience, flexibility, efficiency, and personalization (Persaud and Azhar, 2012). Ordinary mobile phones have limited functions which are voice calls, SMS, camera, calendar, organizer, alarm and reminder functions. Where smartphones offer consumers with more variety of features, such as mobile web browsing, web applications, electronic-mail, instant messaging, picture messaging, video and audio playback, GPS, games, a video camera, picture and video editing, voice command and much more (Johnson and Clark, 2013).
Additionally, mobile phone companies have introduced much affordable data packages making it possible for consumers to stay online continuously and use popular social networking sites (Basheer and Ibrahim, 2010). Present marketers have an enormous opportunity to integrate and expand their social media marketing strategy with their mobile marketing strategy (Johnson and Clark, 2013).
Berman (2016) advocates that mobile device has the ability to send relevant personalized messages and offers, hence smartphones and tablets are generally not shared with others in the household; marketers can therefore tailor messages to each consumer based on his or her purchase history, social media usage, demographic data, and usage behaviour provided from the firm’s customer loyalty program. Personalization can further be enhanced by integrating such Google filters as contacts, interests, and search queries. Nielsen Consumer Panel has developed a predictive model that specifies the relevant promotions for specific customers based on data from the retailer’s loyalty program (Cameron et al., 2012). In an experiment by Nielsen Consumer Panel which was conducted in the United Kingdom (2015), a sample was broken into two groups: 10,000 app users who downloaded their loyalty card data in the mobile app versus a control group of 10,000 customers of the same retailer that did not register for the mobile app. In comparison to the control group, the test group experienced a 13% increase in coupon redemptions, a 37% increase in redemptions for product planning and implementing effective mobile marketing programs that were new to the household. This was a 23% increase in redemptions for brands that were new to the household (Cameron et al., 2012). A major pitfall to personalization is the creep factor. This occurs when consumers perceive that advertisers have spied on their online purchases site visits, and other non-public actions (Berman, 2016).
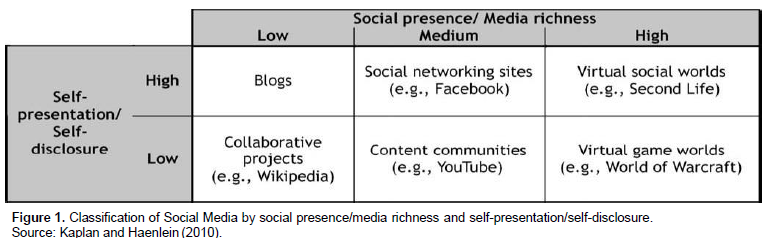
Figure 1 shows the classification of social media into six types according to presence/media richness and self-presentation/self-disclosure. Blogs, Social network sites, Virtual social worlds, collaborative projects, content communities and virtual worlds are suggested by Kaplan and Haenlein (2010) to be the main social media types. Aside from the above classifications of social media, no other classifications are made in the literature, but these have rather been adopted by most authors as the main social media classifications.
Social media has evolved over the years offering marketers and consumer’s variety and choice. Therefore new classifications of social media for both consumers and marketers will be made through this study for effective purpose driven social media marketing and to address the gap in the literature.
RESEARCH METHODOLOGY
Research philosophy is the way to go about doing a research (Hejase and Hejase, 2013, p. 77). This research follows a positivist philosophy, and adopts a deductive approach that depends on “quantifiable observations that lead themselves to statistical analysis” (Hejase et al, 2017, p. 17). The reliability of the scales in the research instrument was tested by using the Cronbach’s alpha coefficient to determine the degree of internal consistency between the multiple measurements. To further ensure reliability of the research instrument, a pilot study of the research instrument was tested on a small sample. Systematic random sampling was employed to reach a sample of 355 consumers. A self-administered questionnaire was used to collect data. Structural Equation Modelling (SEM) was used to perform multiple regression analysis during the hypothesis testing and in validating the research model.
Sampling
Research instrument
The research instrument was a self-administered structured questionnaire. Saunders et al. (2012)explain questionnaires as appropriate for case study and experiment strategies but strongly supports the use of questionnaires in the survey research strategy. The questionnaire included a cover letter that briefly introduced the researcher, the study, the purpose of the research and provided an assurance of respondent’s confidentiality.
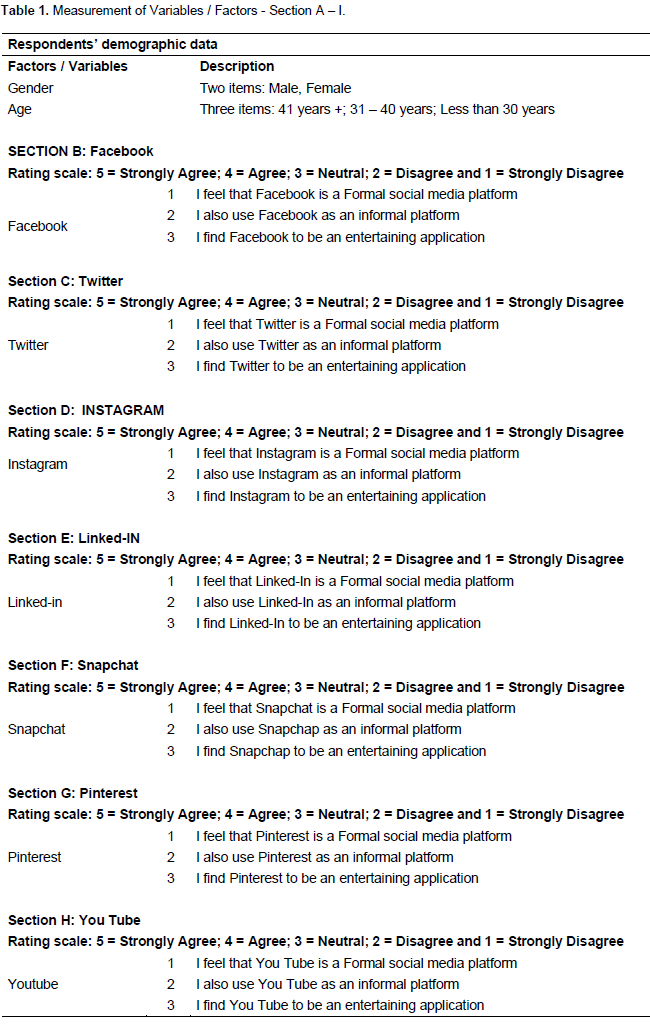
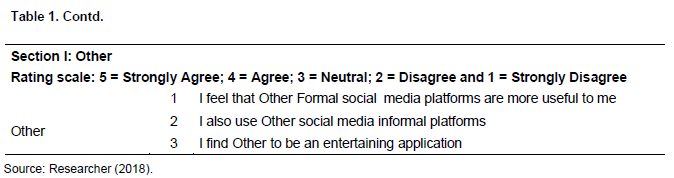
All items except for demographics were formulated through repertory grid technique (Malhotra and Birks, 2006, p. 185) and fine-tuned through a pre and post pilot study. The final validated social media types namely, formal, informal and entertainment social media were then adopted. Furthermore, level of agreement of respondents under social media was measured with a scale of questions ranging from Strongly Disagree to Strongly Agree (1 = Strongly Disagree; 2 = Disagree; 3 = Neutral; 4 = Agree; 5 = Strongly Agree. Likert scales questions are commonly utilized in business and social science research (Hejase and Hejase, 2013) and widely used in most research in marketing (Malhotra and Birks, 2006). Likert scale is widely used to measure the respondents’ attitudes on the extent to which they agree or disagree with focused/targeted statements (Hejase and Hejase, 2013, p. 177). The research instrument is attached under the appendix; however Table 1 indicates the factors, scales and items used.
RESULTS
Descriptive of demographic data
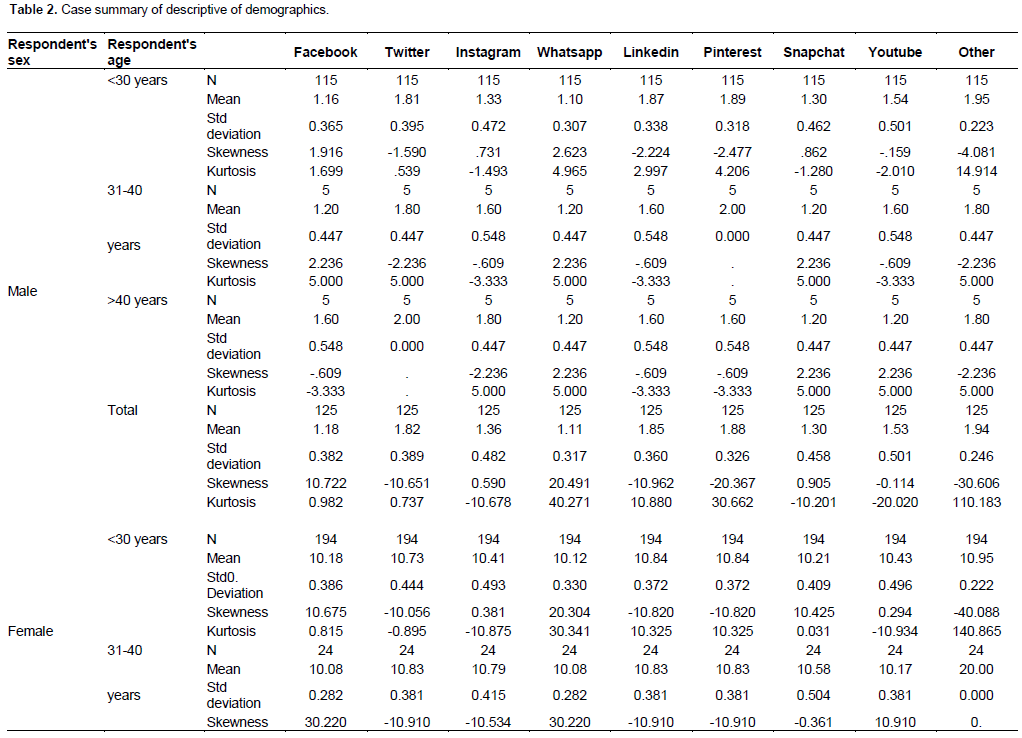
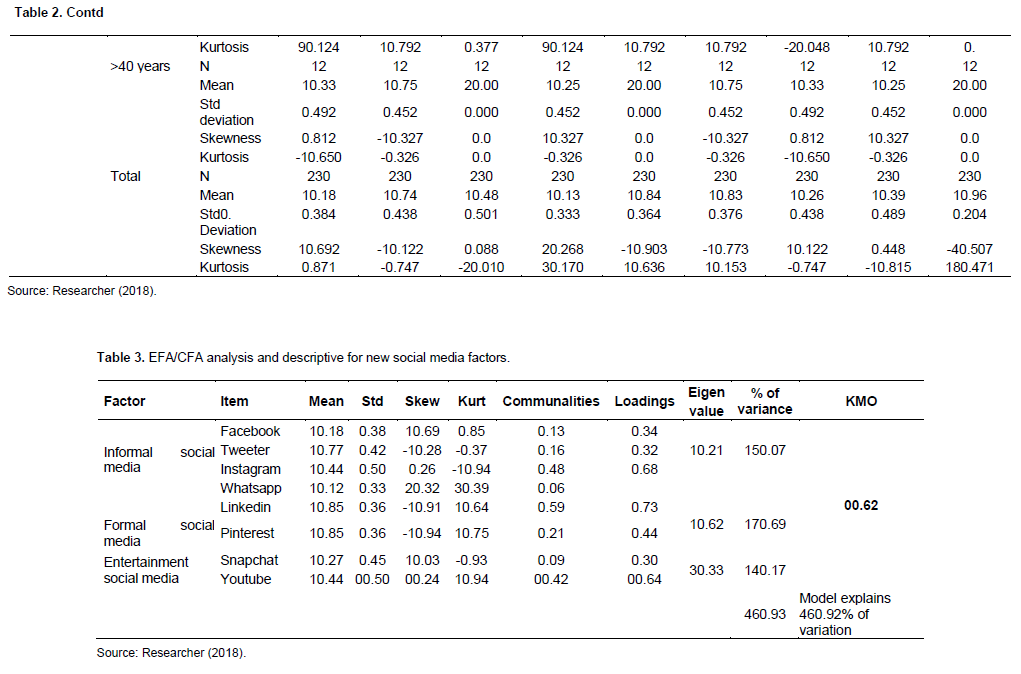
Table 2 depicts the sources of demographic information from participants which include age, gender and social media application subscription. The specific descriptives discussed were number of participants, Mean, Standard Deviation, Skewness and Kurtosis.
Table 3 shows that the information analyzed for each of the variables resulted in the following: There are 35.22% (125 out of 355) respondents who are males and ranging in age from <30 years; 31-40 years; and >40 years, the highest number 32.40% (115 out of 355) of participants falling below 30 years age range, with means for males ranging from 1.10 for Whatsapp to 1.95 for other social media.
Skewness and Kurtosis
Skewness and Kurtosis values for the majority of the age group <30 ranging are -1.590 and .539 for Twitter; .862 and -1.280 for Snapchat, respectively to 2.623 and 4.965 for Whatsapp; and -4.081 and 14.914 for Other Social media.
Negative Skewness values for five social media are dominant for the male majority age group <30 which indicate negative social media skew (scores clustered to the right at the low values) (Tabachnick and Fidell 2007, p. 80). Positive Kurtosis values for six social media applications are dominant for the male majority age group <30 indicating that the social media distribution is rather peaked (clustered in the centre), with long thin tails. Kurtosis values below 0 indicate a distribution that is relatively flat (too many cases in the extremes) (Tabachnick and Fidell 2007, p. 80).
The sample also consists of 230 female participants (64.79%) whose age ranges from <30 years; 31-40 years; and >40 years. The highest number of participants (54.65%) or 194 out of 355, fall below 30 years age range, with means ranging from 1.13 for Whatsapp to 1.96 for other social media. The Skewness and Kurtosis values for the majority age group <30 range as follows: -1.056 and -.895for Twitter; 1.425 and .031 for Snapshot, respectively to 2.304 and 3.341 for Whatsapp, and -4.088 and 14.865 for Other Social media.
Negative Skewness values for five social media are dominant for the female majority age group <30 indicating negative social media skew (scores clustered to the right at the low values) (Tabachnick and Fidell 2007, p. 80). Positive Kurtosis values for six social media applications are dominant for the female majority age group <30 indicating that the social media distribution is rather peaked (clustered in the centre), with long thin tails. Kurtosis values below 0 indicate a distribution that is relatively flat (too many cases in the extremes). With reasonably large samples, skewness will not ‘make a substantive difference in the analysis’ (Tabachnick and Fidell 2007, p. 80). Kurtosis can result in an underestimated variance, but this risk is also reduced with a large sample (200+ cases). In this case the sample is 355 and therefore will not be affected by both Skewness and Kurtosis values.
Factor analysis
There are three main steps in conducting factor analysis:
Step 1: Assessment of the suitability of the data for Factor Analysis. There are two main issues to consider in determining whether a particular data set is suitable for factor analysis: sample size (greater than 150), and the strength of the relationship among the variables (or items) (Tabachnick and Fidell, 2007).
Step 2: Factor extraction: Factor extraction involves determining the smallest number of factors that can be used to best represent the interrelationships among the set of variables. There are a variety of approaches that can be used to identify (extract) the number of underlying factors or dimensions. Some of the most commonly available extraction techniques are: principal components; principal factors; image factoring; maximum likelihood factoring; alpha factoring; unweighted least squares; and generalised least squares.
Step 3: Factor rotation and interpretation: Once the number of factors has been determined, the next step is to try to interpret them. To assist in this process, the factors are ‘rotated’. This does not change the underlying solution, rather it presents the pattern of loadings in a manner that is easier to interpret. There are two main approaches to rotation, resulting in either orthogonal (uncorrelated) or oblique (correlated) factor solutions.
Exploratory factor analysis was used to explore relationships between different social media variables. In addition confirmatory factor analysis was used to establish Standardized Regression Weights, Standardized Estimate Regression Weights and in validating the research model.
The 8 social media items were subjected to Principal Axis Factoring (PAF) using the Statistical Product and Service Solutions software, SPSS version 25, an IBM product since 2009 (Hejase and Hejase, 2013) (Table 3). Prior to performing (PAF), the suitability of data for factor analysis was evaluated. The Skewness and Kurtosis indicated normality of the data. Inspection of the correlation matrix revealed the presence of many coefficients of 0.3 and above. The Kaiser-Meyer-Olkin and Bartlett’s test for sampling adequacy value was 0.62, exceeding the recommended value of 0.6 (Kaiser, 1974). This means that the variables do have some correlation with each other, which is what is needed to try to find an underlying factor that represents a grouping of variables (Burns and Burns, 2008; Hejase et al., 2014) Therefore, the KMO and Bartlett’s test was significant and the communalities for each variable were sufficiently high (all above 0.300 and most above 0.600), thus indicating that the chosen variables were adequately correlated for a factor analysis. Principal Axis Factoring revealed the presence of three components with eigenvalues exceeding 1, explaining 15.07, 17.69 and 14.17% of the variance, respectively.
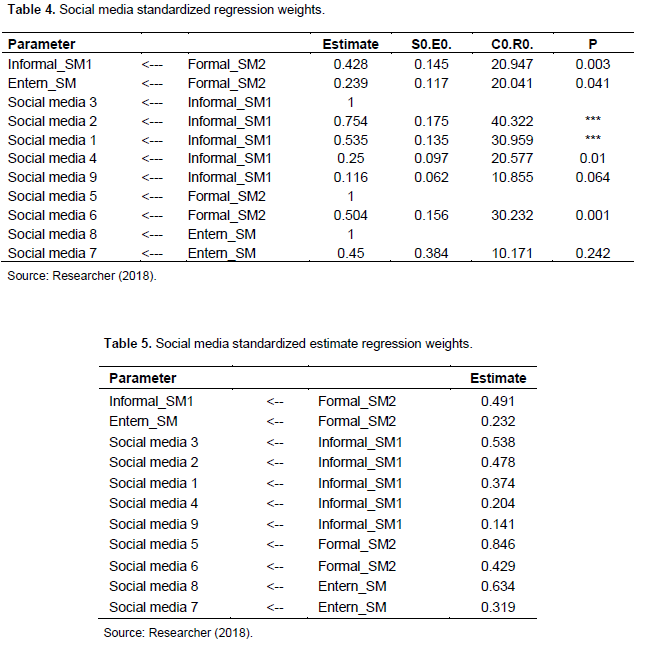
Although social media was not part of the hypothesis of this study, the EFA and CFA and subsequently structural equation modeling that was done on all questionnaire items found social media applications highly significant and correlated with other items in the data set. The SEM regression analysis therefore included all social media items and their effect on other mobile marketing adoption items in the model fit as illustrated in Tables 4 and 5.
Table 5 indicates that except for social media 9 and 7, all critical ratios are above the threshold of 1.96 for directional path relation and only the two p- values of social media 7 and 9 are not significant. The significant directional path with high correlations found by the software AMOS was between social media factors and new factors (formal, informal and entertainment social media).
Standardized regression weights
Table 5 indicates the contribution of social media factors to the new factors (formal, informal and entertainment social media).The contributions of significant factors range between 20.4% social media 4 and 63.4% social media 8.
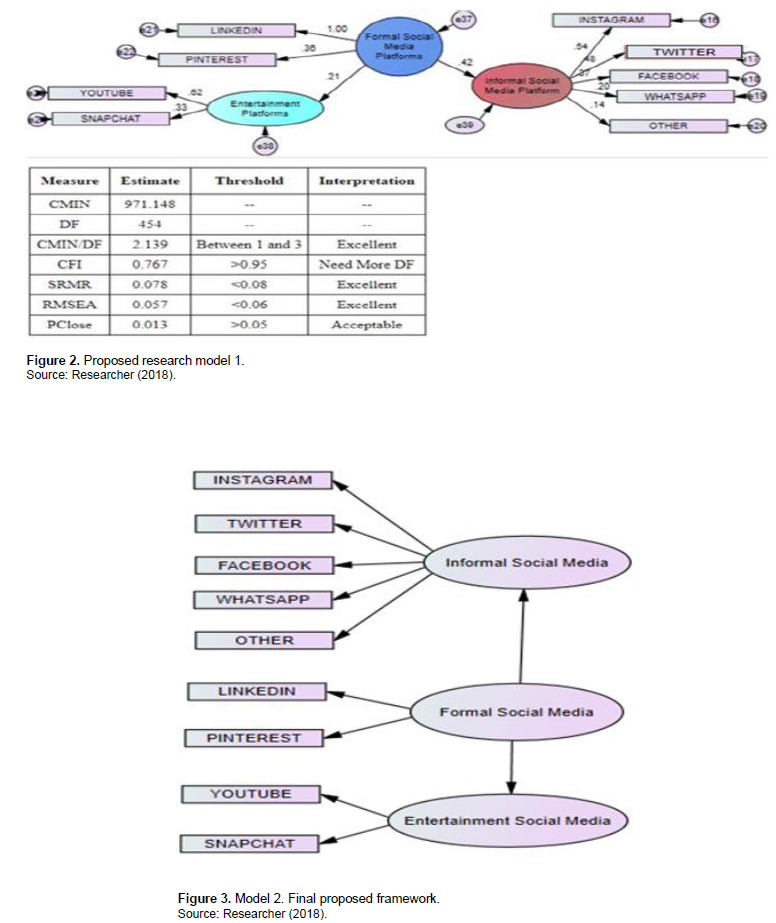
Due to sensitivity of the Chi-square test to sample size, it is not simple to get a good sense of model fit from its value. Therefore, other indices of model fit need to be evaluated, together with GFI (Goodness-of-Fit Index), CFI (Comparative Fit Index), SRMR (Standardized Root Mean Squared Residual) and RMSEA (Root Mean Square Error of Approximation). If the Goodness of Fit Index (GFI) is greater than 0.9 it shows a good overall degree of fit and values less than 0.90 basically recommend that the model may be enhanced. Furthermore, Comparative Fit Index (CFI)considers a value of 0.90 and above as acceptable, for a good model fit. RMSEA (Root Mean Square Error of Approximation) less than .08 is considered acceptable. SRMR (Standardized Root Mean Squared Residual), standardized summary of the average covariance residuals should be below .10 and PClose or P-value should be greater than 0.05 to indicate a well fitted model (Kline, 2010; Hatcher, 2005; Hu and Bentler, 1999). In line with the given threshold values for the test statistics, outcomes demonstrated a good fit for the structural model followed by measurement models. According to the Chi-square (CMIN/DF = 2.139), comparative fit index (CFI = 0.77) and root mean square error of approximation (RMSEA = .057), Standardized Root Mean Squared Residual (SMSR = 0.078), P Value (PClose = 0.013) Model 1 results show excellent fit.
Final proposed framework: Social media types
The model has been developed to explain the links between factors and to conceptualize social media types (Figure 2). The framework was formulated following the examining unstandardized regression weights, examining standardized total effects weights and examining the research measurement framework which translated in the validation of the final proposed framework. Model 2 is the final outcome of the proposed framework and will be discussed in this section (Figure 3).
Formal social media consist of LinkedIn, Pinterest and YouTube. Finally Informal social media are WhatsApp, Facebook, Twitter and Instagram.
DISCUSSION
Findings revealed three types of social media exist, formal, informal and entertainment social media. Formal social media being the main social media is influenced by entertainment social media and informal social media. In addition informal social media platforms are WhatsApp, Twitter Instagram, Facebook and others, while entertainment social media platforms are YouTube and Snapchat.
The findings of this study elaborate the discussion by Johnson and Clark (2013) and Roach (2009, p. 149) further dividing social media into three main types.
The benefits of social media applications to consumers are that smartphones have the capability to transform consumers? shopping experiences (Persaud and Azhar, 2012). The findings of this study can further enhance these shopping experiences by targeting online shoppers based on the social media type they most frequently use.
Smartphones offer consumers with more variety of features, such as mobile web browsing, web applications, electronic-mail, instant messaging, picture messaging, video and audio playback, GPS, games, a video camera, picture and video editing, voice command and much more (Johnson and Clark, 2013). Additionally, mobile phone companies have introduced much affordable data packages making it possible for consumers to stay online continuously using popular social networking sites (Basheer and Ibrahim, 2010). Present marketers have enormous opportunity to integrate and expand their social media marketing strategy with their mobile marketing strategy (Johnson and Clark, 2013). The findings of this study will enable marketers to develop more effective strategies since they can use the main social media types developed in this study to craft consumer specific strategy.
Finally the three social media types developed from this study can aid marketers in developing product specific marketing strategies. Products can be subdivided based on the main social media types and marketed on the social media type related to the product. Social media types can also be used to develop consumer age group marketing strategies.
CONCLUSION AND FUTURE RESEARCH AVENUES
This study classified social media into three main classifications formal, informal and entertainment social media. In addition informal social media platforms are WhatsApp, Twitter Instagram, Facebook and others. While entertainment social media platforms are YouTube and Snapchat.
The findings of this study can further enhance shopping experiences by targeting online shoppers based on the social media type they most frequently use. Findings will enable marketers to improve on their current marketing, craft consumer specific strategies and produce more impactful marketing product centered social media type classifications driven products. Future research can focus on product-based social media marketing as well as age-based social media marketing. Future studies can determine the relationships between age-based and social media usage and productbased and social media correlations.
CONFLICT OF INTERESTS
The author has not declared any conflict of interests.
REFERENCES
|
Al-alak BA, Alnawas IA (2018). Measuring the acceptance and adoption of e-learning by academic staff. Knowledge Management and E-Learning: An International Journal 3(2):201-221. |
|
|
Berliner T (2016). Mobile marketing: a scoping study of the literature and issues for future research. Information Development 32(3):527-553. |
|
|
Berman SJ (2016). Digital transformation: opportunities to create new business models. Strategy and Leadership 40(2):16-24. |
|
|
Burns RB, Burns RA (2008). Business Research Methods and Statistics Using SPSS. London: SAGE Publications Limited. |
|
|
Cameron D, Gregory C, Battaglia D (2012). Nielsen personalises the mobile shopping app. Journal of Advertising Research 52(3):333-338. |
|
|
Hatcher, R. (2005). The distribution of leadership and power in schools. British Journal of Sociology of Education 26(2):253-267. |
|
|
Hejase AJ, Hejase HJ (2013). Research Methods A Practical Approach for Business Students. (2nd edition), Philadelphia, PA, USA: Masadir Incorporated. |
|
|
Hejase HJ, El Skaff D, Hamdar B, Hejase AJ (2017). Trauma Awareness and Education in Lebanon: An Exploratory Study. The Journal of Middle East and North Africa Sciences 3(10):8-31. |
|
|
Hejase HJ, Haddad Z, Hamdar B, Al Ali R, Hejase AJ, Beyrouti N (2014). Knowledge Sharing: Assessment of Factors Affecting Employee' Motivation and Behavior in the Lebanese Organizations. Journal of Scientific Research and Reports 3(12):1549-1593. |
|
|
Hu LT, Bentler PM (1999). Cutoff criteria for fit indexes in covariance structure analysis: Conventional criteria versus new alternatives. Structural Equation Modeling: A Multidisciplinary Journal 6(1):1-55. |
|
|
Peña-López I (2018) International Telecommunications Union (2008). Worldwide mobile cellular subscribers to reach 4 billion-mark late 2018. |
|
|
Johnson P, Clark M (2013). Business and management research methodologies. New Delhi. Sage. |
|
|
Kaplan A, Haenlein M (2010). Users of the world unite: The challenges and opportunities of social media. Business Horizons 53(1):59-68. |
|
|
Kline RB (2010). Promise and pitfalls of structural equation modeling in gifted research. |
|
|
Persaud A, Azhar I (2012). Innovative mobile marketing via smartphones: are consumers ready? Marketing Intelligence and Planning 30(4):418443. |
|
|
Roach G (2009). Consumer perceptions of mobile phone marketing: a direct marketing innovation. Direct Marketing: An International Journal 3(2):124138. |
|
|
Saunders M, Lewis C, Thornhill A (2012). Research methods for business students, 5th ed. Harlow: Pearson Education: India. |
|
|
Srivastava J (2005). Mobile phones & the evolution of social behaviour. Behaviour and Information Technology 24(2):111-129. Tabachnick BG, Fidell LS (2007). Using multivariate statistics (Volume 5). Boston, MA: Pearson. |
|
Copyright © 2024 Author(s) retain the copyright of this article.
This article is published under the terms of the Creative Commons Attribution License 4.0


