Full Length Research Paper
ABSTRACT
The international network for rational use of drugs comprises a set of indicators called "drug use indicators" that can be used to assess rational drug use by the patient, health professionals and drug use managements at facility level. These indicators comprise of: Prescribing indicators, patient care indicators and facility indicators. A cross-sectional descriptive study has been conducted to collect the data on patient care and facility indicators, as recommended by the World Health Organization (WHO). Out of 10 public hospitals found in western Oromo, 4 were randomly selected. Data of 160 general ambulatory patients were randomly collected between the months of November, 2012 to March, 2013 from each facility (40 patients per facility). Patient care indicators were measured prospectively by recording consultation time and dispensing time. Percentages of drugs actually dispensed and adequately labeled were determined by examining the drug packages/bottles which the patient had actually received. It was noted whether they had been adequately labeled, viz. whether the name of the patient, the generic name of the drug and when the drug should be taken was written on the label (WHO, 1995). Lastly, the patient's knowledge of when and in what quantity each dispensed drug should be taken was evaluated. In this study, the average consultation time was significantly better in these facilities (18.20 ± 4.3 standard deviation (SD) min) as compared to WHO recommendation which is > 10 min. The dispensing time of drugs in this study was also good (6.56 ± 5.43 SD min) as compared to WHO recommendation which is > 3 min.
Key words: Rational drug use, World Health Organization (WHO) indicators, facility indicators, patient care indicators.
INTRODUCTION
Rational use of drugs requires that “patients’ receive drugs appropriate to their clinical needs, in doses that meet their own individual requirements, for an adequate period of time and at the lowest cost to them and their community”. The concept of rational drug use is old, as evidenced by the statement made by the Alexanderian physician Herophilus 300 B.C that “Drugs are nothing in themselves but are of good if employed with reason and prudence”. The concept of rational drug use has been the theme of various national and international gatherings during the past few years. Various recent studies conducted in developed as well as developing countries regarding the safe and effective use of drugs show that irrational drug use is a global phenomenon.
Essential drugs are those that satisfy the health care needs of the majority of the population; they should therefore be available at all times, in adequate amounts and in the appropriate dosage forms (Mohammed and Tesfaye, 1997). About one third of the world population lacks access to essential medicines (WHO, Policy Perspective on Medicines, 2002). It is clear that there are differences in public settings regarding the number of health workers and their levels of competence, the particular treatment protocols approved for use by health authorities and those used by agency personnel, the specific compositions of the public populations by age, ethnicity, socio-economic and cultural status and illness profile. However, the effective use of drugs in all public settings depends on rational prescribing, correct dispensing and the treatment adherence by the patient.
In 1993, the World Health Organization (WHO) in collaboration with the International Network for Rational Use of Drugs (INRUD) introduced a set of indicators called "drug use indicators" that can be used to assess rational drug use (WHO, 1993). These indicators comprise of: (i) Prescribing indicators that measure the performance of health care providers in several key dimensions related to the appropriate use of drugs. The indicators are based on the prescription practices observed in a sample of clinical encounters taking place at the health institution (Dawit et al., 1998). (ii) Patient care indicators: the time that prescribers and dispensers spend with each patient sets important limits on the potential quality of diagnosis and treatment. Patients for whom drugs are prescribed are expected to receive well-labeled medication and should understand how to take each drug. These indicators measure key aspects of what patients experience at health institutions, and whether they understand how to take their medication appropriately (Negussu, 1991). (iii) Facility indicators: the ability to prescribe or dispense drugs rationally is influenced by many factors of the working environment. Two particularly important components are an adequate supply of essential drugs and access to un-biased information about the drugs. Without these it is difficult for health personnel to function efficiently (Bashrahil, 2010).
Though, many studies had been done on prescription indicators in Ethiopia and other developing countries, there is a lack of such studies on patient care and facility indicators. The present study was aimed at determining the value of these indicators with a view to providing information for further study.
METHODOLOGY
This is a cross-sectional descriptive study which deals with collecting primary data and charts of the current situation concerning the current status of the drug use in the hospitals of West Oromo region and comparing the result with WHO recommendation of patient care and facility indicators. Out of 10 public hospitals found in western Oromo, 4 were systematically selected. The hospitals selected were Ambo Hospital (AH), Gedo Hospital (GH), Nekemte Hospital (NH), and Gimbi hospital (GIH). Data of 160 general ambulatory were randomly collected between the months of November, 2012 to March, 2013 from each facility. The demographic data of each patient including age, sex and prescribed drugs were recorded. Patient care indicators were measured prospectively by recording consultation time and dispensing time. Percentages of drugs actually dispensed and adequately labeled were determined by examining the drug packages/bottles the patient had actually received. It was noted whether they had been adequately labeled, viz. whether the name of the patient, the generic name of the drug and when the drug should be taken was written on them (WHO, 2002). Lastly, the patient's knowledge of when and in what quantity each dispensed drug should be taken was evaluated. Failure to know either of these two points would result in patient's knowledge being scored as inadequate. Data pertaining to the "facility indicators" were gathered at the end of the present study. The prescribers were asked whether any essential drugs list existed in the outpatient department during the study period (WHO, 1993). Fifteen essential drugs formed the checklist to measure the availability of "key drugs", that is drugs that should always be available for the treatment of common health problems, during the study period (WHO, 1993). This information was obtained from the records in the pharmacies. Even if one unit of unexpired product was available, the drug was recorded as being in stock.
The average consultation/dispensing time was calculated by dividing the total time taken (using stop clock) to consult/dispense drugs to series of patients by the number of patients. For the purpose of this study, the time spent on billing and filling the prescription was not considered as part of dispensing time since this time is the time expended by the dispenser independently, excluding the patient, and actually the time used by other person other than the actual dispenser. Percentages of drugs actually dispensed or adequately labeled were computed by dividing the number of drugs dispensed or adequately labeled by the total number of prescribed drugs presented for dispensing. Percentage of patients who had adequate knowledge of the correct dosage schedule was computed by dividing the number of patients who had adequate knowledge of the dosing schedule by the total number of patients interviewed.
RESULTS
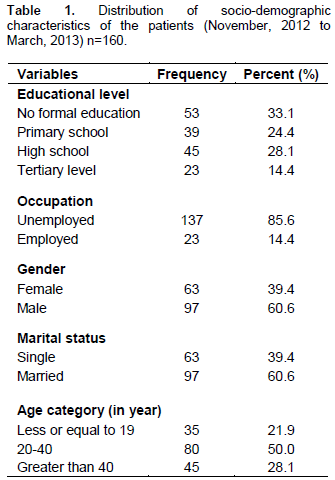
Patient care indicators address the key issues of what the patient’s experience at health facilities was and how they have been prepared to deal with the pharmaceuticals that have been prescribed and dispensed. According to the data collected, the age composition of the study population revealed that 35 (21.9%) were less or equal to 19 years old, 80 (50.00%) were between the age 20 to 40
years, 45 (28.1%) were for age > 40 years old. From those 160 patients, 63 (39.4%) were females and 97 (60.6%) were males. The marital status of the patients were 63 (39.4%) for females and 97 (60.6%) for males. With regard to educational status of our patients, 53 (33.1%) of the respondents were illiterate, 39 (24.4%) of respondents were completed primary school, 45 (28.1%) of the respondents were completed secondary level of education and 23 (14.4%) were colleges graduates and above (Table 1).
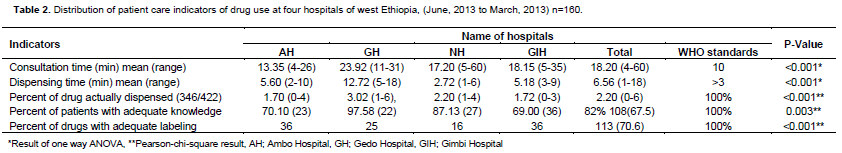
In this study, the average consultation time was significantly better in these facilities (18.20 ± 4.3 SD min) (Table 2) as compare to values reported by Chedi et al. (2009) from other developing countries (3.4 min). Although it is difficult to estimate optimal time period for a patient encounter, such time is too important to conduct complete patient evaluation and prescribe the therapy for most cases. The dispensing time of drugs in this study was also good (6.56 ± 5.43 SD min) compared to the recommended 2 min (Laing, 1994) but there was medium labeling of drugs (70.6% ± 9.67 SD) as recommended by WHO, that is labeling must be 100%, which is dangerous, especially to illiterate patients as drugs dispensed to them can easily be mixed up at home. The average number of drugs actually dispensed and the average percent of patients with adequate drug dosage knowledge were 2.20 ± 0.6 and 67.5 ± 6 SD, respectively which was also low as of WHO recommendation.
Facility indicators
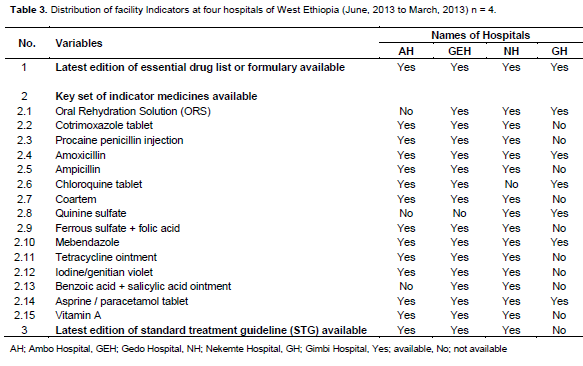
The National standard treatment guidelines are designed to be used as a guide for treatment choices and as a quick reference in order to help in the overall management of patients. Utmost care has been given by the panel of experts to ensure that the recommendations given in the STG are evidence based. Drugs should only be prescribed when they are necessary, and in all cases the benefit of administering the medicine should be considered in relation to the risks involved. Unadapted prescribing habits lead to ineffective and unsafe treatments, exacerbation or prolongation of the illness, and distress and harm to the patient, as well as a higher cost for the community (Mallet et al., 2001; WHO, 2008). The main drugs prescribed were analgesics, mebendazole and amoxicillin. Other prescriptions included oral rehydration salts (ORS) and others such as antihelminthics, benzylbenzoate emulsions, folic acid, multivitamins and cough mixtures (Table 3).
DISCUSSION
In this study, the average consultation and dispensing time in facilities was 18.20 and 6.56 min. These results transcend those from a study in Niger which were 5.75 and 3.25 min in average (Massele et al., 2001) and in Jordan which were 3.90 min and 28.80 s (Otoom et al., 2002), respectively. Hence, prescribers and dispensers spend more time with their patients. The probable reasons for this variation among health facilities may be due to availability of man power, set up of dispensary area and easy access to essential materials such as drugs and medical equipments. The study result revealed that averagely 28.2% of dispensed drugs were adequately labeled which was less than the study conducted in Islamic republic of Iran where 60% of the drugs were adequately labeled (Cheraghali et al., 2004). This practice should be improved since incomplete labeling of drugs leads to irrational use of medicine. Furthermore the study showed that 82% of patients were able to repeat the correct dosage schedule of the drug they had received; which is relatively low when compared with the WHO recommended value of 100%. The most probable reason for this is the patients educational backgrounds as seen from the patient’s socio-demographic study (33% of the study population are illiterate). Other reason that might contribute to this problem may be an overload of patients in the dispensary areas leading to communication problems between dispensers and patients. Almost all of the facilities have their own essential drug list or formulary or standard treatment guideline.
According to the result of this study, the majority of the drugs 776 (76.1%) of the drugs prescribed during the study period in AH, 1142(100%) in GEH, 768(80.7%) in NH and 781(73.5%) in GH were prescribed from the latest edition of Ethiopian essential drug list (EDL) compared with the ideal value of 100% and this is better as compared to the study done by Lifang et al. (2011) that is 64.12%. Percentage of drugs actually dispensed differed between the pharmacies in the study area (77.2 to 137%). These numbers are slightly lower than the average value obtained in other developing countries (Hogerzeil, 1995). This indicates inappropriate supply of drugs in all the hospitals and therefore a minimum level of health care cannot be guaranteed to all citizens.
Although not a all dispensed drugs were adequately labeled in the four hospitals which was also observed in Cambodia (Chareonkul et al., 2002); figures of 56.2 and 87% have been reported in India (Hazra et al., 2000) and Tanzania (Massele et al., 2001), respectively. When the dispensers were asked about the in-adequate labeling, they stated that given their typical workload they hardly got time to interact with the patients and thus they preferred to draw the pictogram and explain how the individual drugs should be taken. The use of pictograms has been shown to improve recall of medical infor-mation in people with low literacy skills (Dowse and Ehlers, 2001). However, writing the patient's name and generic name of the drug on the label is necessary (WHO, 1995). This would also help in reducing the risk of dispensing errors (Peterson, 1999). Educational and behavioral intervention and use of pre-packaged drugs would probably improve the dispensing practice. Results that came up after investigation of the patients' knowledge of correct dosage indicate relatively very high values (70 to 85%). But this does not necessarily reflect reality since the majority of patients were hostile and not willing to repeat the whole dose regimen at the instance of the investi-gator. Their response “I know the dose” was accepted as positive answer, but it remains doubtful whether they really knew the dose regimens.
One notable characteristic of pharmacies in public health institutions in Kano was their consis-tency in stocking of essential drugs. This could be the result of the active Drug Revolving Scheme operating in the state and the appropriate policy about the priorities in supplying drugs by its managers. Because of this, the availability of key drugs in the EDL in the four health institutions studied was high (85 to 96%). A similar figure of 86.6% availability of key drugs has been reported from Cambodia (Chareonkul et al., 2002), a lower figure of 54% from Bangladesh (Guyon et al., 1994) and an optimal figure of 100% from Ethiopia (Desta et al., 2002). In spite of the high availability of key drugs in the four health institutions, only AKTH has a hospital formulary. The remaining had neither the formulary nor copies of essential drug list.
CONCLUSION
The pattern of prescription in terms of poly-pharmacy was near to optimal which was encourageable. Majority of the drugs were prescribed from Ethiopian EDL, still this is encourageable. The average consultation and dispensing time observed from this study is enough to transfer the necessary information to the clients and improve the adherence. There is a need to improve on patients’ knowledge on dis-pensed drugs and adequate labeling of the dispensed drugs. Still there should be an im-provement for stocking of the essential drugs in the facilities. Baseline data gathered by this study can be used by researchers and policymakers to monitor and improve pharmaceutical prescribing and consumption practices in southwest Ethiopia.
CONFLICT OF INTEREST
The authors declare that they have no conflicts of interest.
REFERENCES
|
Bashrahil KA (2010). Indicators of rational drug use and health services in Hadramout, Yemen. East Mediterr. Health J. 16(2):151-5. Pubmed |
||||
| Chedi BAZ, Abdu-Aguye I, Kwanashie HO (2009). Analysis of patient care and facility indicators in public health institutions in Kano state, Nigeria. Niger. J. Pharm. Sci. 8:2. | ||||
|
Cheraghali AM, Nikfar S, Behmanesh Y, Rahimi V, Habibipour F, Tirdad RA, Bahrami A (2004). Evaluation of availability, accessibility and prescribing pattern of medicines in the Islamic Republic of Iran. Eastern Mediterr. Health J. 10(3):406-415. Pubmed |
||||
| Dawit D, Zeleke G, Sheferaw T (1998). A baseline servey on prescribing indicator and factor influencing prescribing in southern Ethiopia. Ethiop. J. Health Dev. 12(2):87-93 | ||||
| Desta Z, Abula T, Ganes A, worku A (2002). Prescribing pattern drugs for outpatient in three hospitals in North West Ethiopia. J. Health Dev. 16(2):183-189. | ||||
|
Hogerzeil HV (1995). Promoting rational prescribing: an international perspective. Br. J. Clin Pharmacol. 39(1):1-6. crossref |
||||
|
Lifang D, Hong Y, Duolao W (2011). Drug prescribing indicators in village health clinics across 10 provinces, of Western China. Fam. Pract. 28:63-67. crossref |
||||
|
Mallet HP, Njikam A, Scouflaire SM (2001). Evaluation of prescription practices and the rational use of medicines in Niger. Sante 11(3):185-96. Pubmed |
||||
|
Massele AY, Nsimba SE, Rimoy G (2001). Prescribing habits in church-owned primary health care facilities in Dar Es Salaam and other Tanzanian coast regions. East Afr. Med. J. 78(10):510-4. crossref |
||||
| Mohammed A, Tesfaye S (1997). Pattern of prescription in Jimma Hospital. Ethiop. J. Health Dev.11(3):263-267. | ||||
| Negussu M (1991). Pattern of drug utilization in Addis Ababa over a seven year interval (1989-1995). Ethop. J. Health Dev.10(1):27-33. | ||||
|
Otoom S, Batieha A, Hadidi H, Hasan M, Al-Saudi K (2002). Evaluation of drug use in Jordan using World Health Organization prescribing indicators. East. Mediterr. Health J. 8(4-5): 537-543. Pubmed |
||||
| WHO (1993). How to investigate drug use in health facilities in selected drug use indicator, EDM Research series, No 07. Available at: http://apps.who.int/medicinedocs/en/d/Js2289e/ | ||||
| WHO (2002). Policy Perspective on Medicines; Promoting rational use of medicines; Core components, September, Geneva. Available at: http://apps.who.int/medicinedocs/en/d/Jh3011e/ | ||||
Copyright © 2024 Author(s) retain the copyright of this article.
This article is published under the terms of the Creative Commons Attribution License 4.0


