Barley is recognized as one of the oldest cereal crop in Ethiopia grown for various uses. The knowledge of the association between various yield components and yield is paramount important for effective selection in crop improvement. The present study was to determine the interrelationship and direct and indirect effects of yield component traits on grain yield of Ethiopian landraces barley for further breeding activities of yield improvement. One hundred barley landraces were laid out in 10 x 10 simple lattice design with two replications in 2017 main cropping season at Mata sub site of Haro-Sabu Agricultural Research Center (HSARC). The analysis of variance revealed highly significant (p≤ 0.01) to low significant (p ≤ 0.05) difference for all the characters. Sixteen parameters were evaluated to assess the inter relationship among yield and yield-related agronomic characters and their effect on grain yield. Grain yield showed positive and significant genotypic correlations with grain weight per spike (rg = 0.36), spike weight per plant (rg = 0.38), 1000-seed weight (rg = 0.66), biological yield (rg = 0.83), awn length (rg = 0.34) and plant height (rg = 0.23). The result revealed that biological yield, 1000-seed weight, productive tillers per plant and grain weight per spike were the most important yield components as they exerted positive direct effect on grain yield as well as positive genetic association with each other explaining the existence of significant correlation. This suggests that simultaneous improvement in these characters might be possible.
Barley has a long history as a domesticated crop, as one of the first to be adopted for cultivation. In Ethiopia, barley is 5th major crop after maize, tef, sorghum and wheat in production (CSA, 2016/2017). It has been cultivated in different regions of Ethiopia and produced twice annually, during the main season (Meher) and during the short rainy season (Belg). Moreover, Oromia, Amara, South Nation and Nationality of People (SNNP) and Tigray are the major barley growing regions which account more than 85% of the total production (Chilot et al., 2008). It is used for human consumption, food and feed (Harlan, 2008). It is prepared in different forms of indigenous food and homemade beverages (Fekadu et al., 2005). Additionally, barley has health benefits, such as barley β-glucans used to reduce blood cholesterol, glucose and weight loss by increased satiety, controls heart disease and type-2 diabetes (Behall et al., 2004; Ripple et al., 2009).
Selection of desired genotypes increased diversity and is used for modem plant breeding (Von Bothmer et al., 2003). In Ethiopia, barley landraces show high diversity mainly due to cultivation under variable climatic, farming systems, ecological and human management. Ethiopian barley landraces are important source of genes for several traits like barley yellow dwarf virus resistance, powdery mildew, high lysine content, good vegetative vigor, drought resistance and resistance to several barley diseases (Qualset, 1975; IBC, 2008). Furthermore, Ethiopian barley landraces have useful characteristics such as high tillering capacity; tolerance to marginal soil conditions, barley shoot fly, aphids and frost resistance; vigorous seedling establishment; and quick grain filling period (Birhanu et al., 2005).
Yield is a complex quantitative trait controlled by a large number of genes with small cumulative effect which, is highly influenced by environment (Dyulgerova, 2012). Hence, selection of barley lines based on direct selection for yield would not be effective. For better and successful yield improvement, selection has to be made for the component traits of yield. This requires understanding of interrelationship between component characters that help in determining which character to select when improvement of the related complex character is desired. Correlation between different traits is generally due to the presence of linkage disequilibrium, pleiotropic gene actions and epistatic effect of different genes (Falconer, 1985). A knowledge of correlations that exists between desirable characters can facilitate the interpretation of results obtained and provide the basis for planning more efficient program for the future (Martintell et al., 2005).
Genotypic correlation coefficient offers a measure of the genetic association between characteristics and may provide an important criterion of the selection procedures (Can and Yoshida, 1999). Although correlation coefficient is very important to determine traits that directly affect grain yield, it is insufficient to determine indirect effect of these traits on grain yields. Thus, path-coefficient analysis is one of the reliable statistical techniques which, allow quantifying the interrelations of different components and their direct and indirect effects on grain yield through correlation estimates (Dyulgerova, 2012). Path coefficient analysis is simply a standardized partial regression coefficient that, measures the direct and indirect effects for one variable upon another. And also permits the separation of the correlation coefficient into components of direct and indirect effect (Dewey and Lu, 1959). Using path coefficient analysis, it is easy to determine which yield component/s is/are influencing the yield substantially and so that selection can then be based on that criterion thus making possible great progress through selection (Garcia et al., 2003; Kashif, et al., 2004).
The magnitude of association between yield and its component as well as their utilization in the selection has been reported in barley by many researchers (Dyulgerova, 2012; Tofiq et al., 2015; Hailu et al., 2016; Amardeep et al., 2017). Breeding for grain yield improvement is dependent on the presence of genetic diversity which is an important factor in any successful hybridization program. Quantitative characters like as grain yield is a complex character influenced directly or indirectly by several genes present in the plant (Bhutta et al., 2005) that making difficult for direct selection. In most breeding programs, the strategy is based on simultaneous selection for several traits and therefore the knowledge on the genetic association between traits is very useful for the establishment of selection criteria.
Therefore, the main objective of the study was to examine the prevailing genetic variability, the effects and the association among agronomic characters in Ethiopia landraces barley for further breeding activities of yield improvement. The specific objectives were to assess the variability and associations among yield and yield-related agro-morphological characters of barley landraces and to assess the direct and indirect effects of yield components on yield of barley landraces.
Study area
The experiment was conducted during the main cropping season in 2017 at HSARC, Mata research sub-site, Western Oromia, Ethiopia. The area is located at 8°53'33"N latitude and 34°80'11"E longitude at the Mata research sub-site found with an elevation of 1900 m.a.s.l. Soil types is classified as about 90% loam, 6% sand and 4% clay soil. The nine years (2009- 2017) mean annual rainfall of the area was 1219.15 mm. The relative humidity was 67.5%. The nine years (2009- 2017) mean minimum and maximum annual temperatures were 16.21 and 27.77°C, respectively (Appendix 1 and 2) (Sayo Agriculture and Natural Resource office, Dembi Dollo, Unpublished).
Breeding materials and experimental design
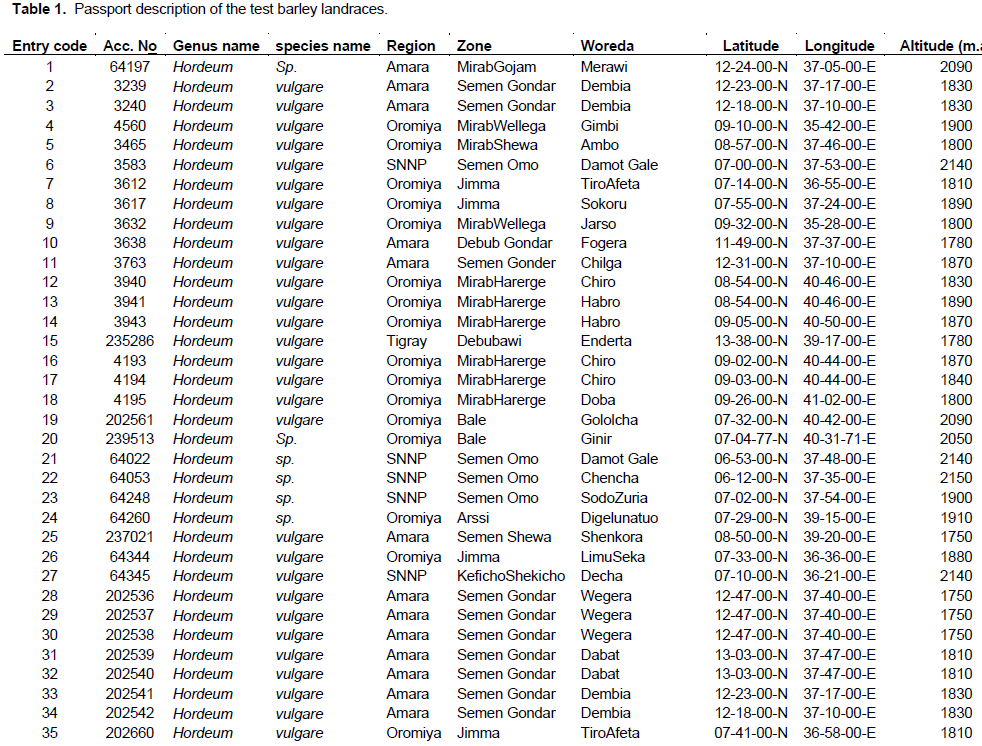
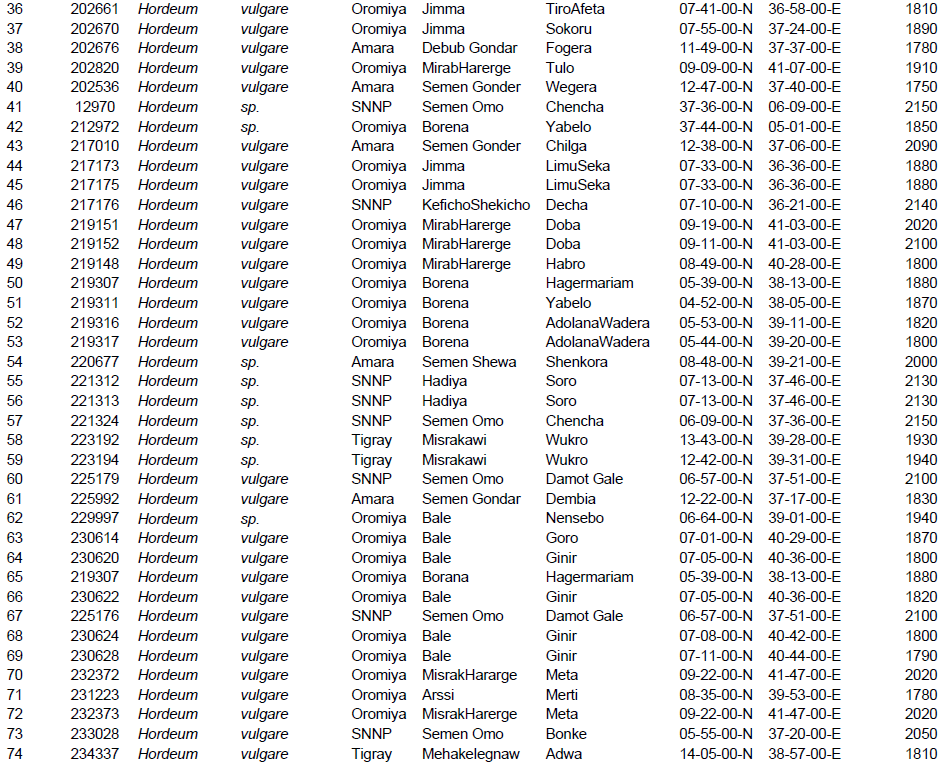
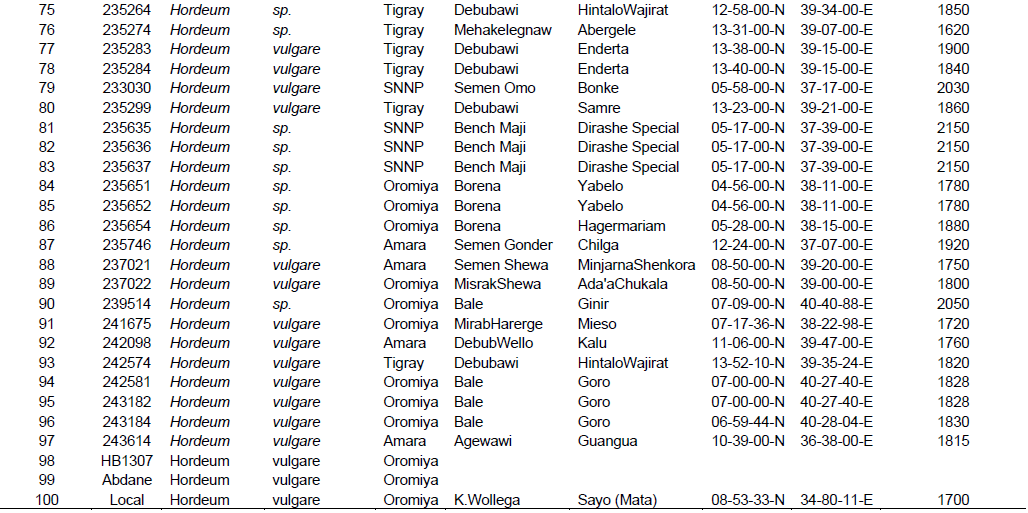
A total of 100 food barley, of which 97 were landraces and two released varieties as standard checks (HB 1307 and Abdane) and one local check were evaluated (Table 1). Materials were sown in the second week of August 2017 in Mata sub site in 10 x 10 simple lattice design with two replications. Seed was drilled on 20 cm row spacing, 1.65 m row length and 1 m spacing between each block. Seed rate of 85 kg ha-1 and recommended dose of fertilizer (41:57:00, NPK kg per ha) were applied (50 kg/ha Urea and 100 kg/ ha DAP). Other crop management practices were undertaken as per the recommendation.
Analysis of variance
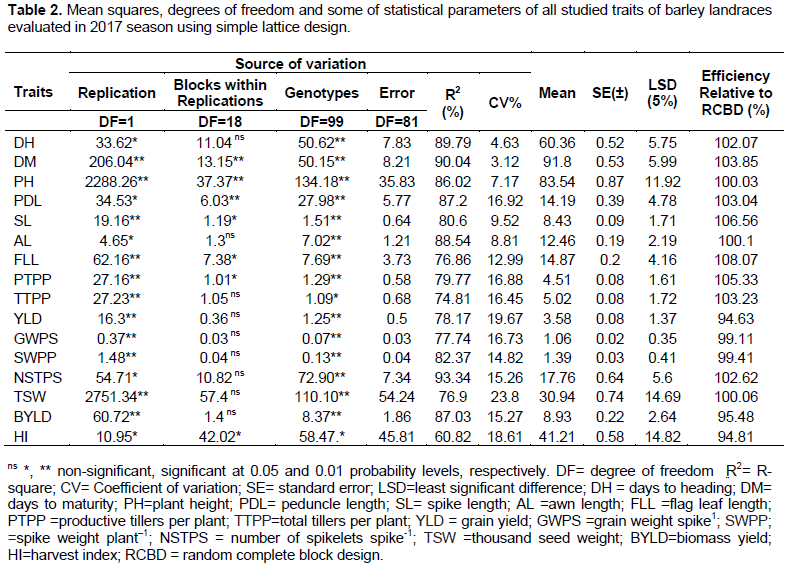
The result of relative efficiency of the design showed that, for most characters’ (more than 68%), simple lattice design was more efficient than randomized complete block design (RCBD) (Table 2). However, for traits like YLD, GWS, SWPP, BYLD and HI, the error variance of the blocks within replications were smaller than or equal to the intra-block error (Table 2), which, was decided to partition various source of variation by RCBD analysis of variance (Appendix 3). Analysis of variance (ANOVA) exhibited that significant (P<0.05 and P<0.01) differences were obtained for all traits evaluated (Table 2). Significant differences were recorded for parameters like days to heading, days to maturity, plant height, peduncle length, spike length, awn length, flag leaf length, productive tillers per plant, grain yield, grain weight per spike, spike weight per plant, number of spikeletes per spike, 1000-seed weight and biological yield at (P≤0.01) probability level. Whereas, total tillers per plant and harvest index were recorded at P≤0.05. The significant differences of the parameters indicated that, there is considerable amount of genetic variation among the studied landraces (Table 2). This variation would offer scope of selection for development of desirable genotypes which, could also be attributed to the diverse composition of the populations evolved through time. Similarly, Assefa (2003) reported that, barley landraces showed significant variations for many traits like 1000 seed weight, spike length, heads per square meter, grain yield per spike, days to heading, days to maturity and plant height in Ethiopian barley landraces. Study by Oettler et al. (2009) showed significant differences among nine barley genotypes for grain yield, spikes/m2, 1000 seed weight, dry matter, days to anthesis and plant height.

Genotypic and phenotypic correlation of grain yield with other traits
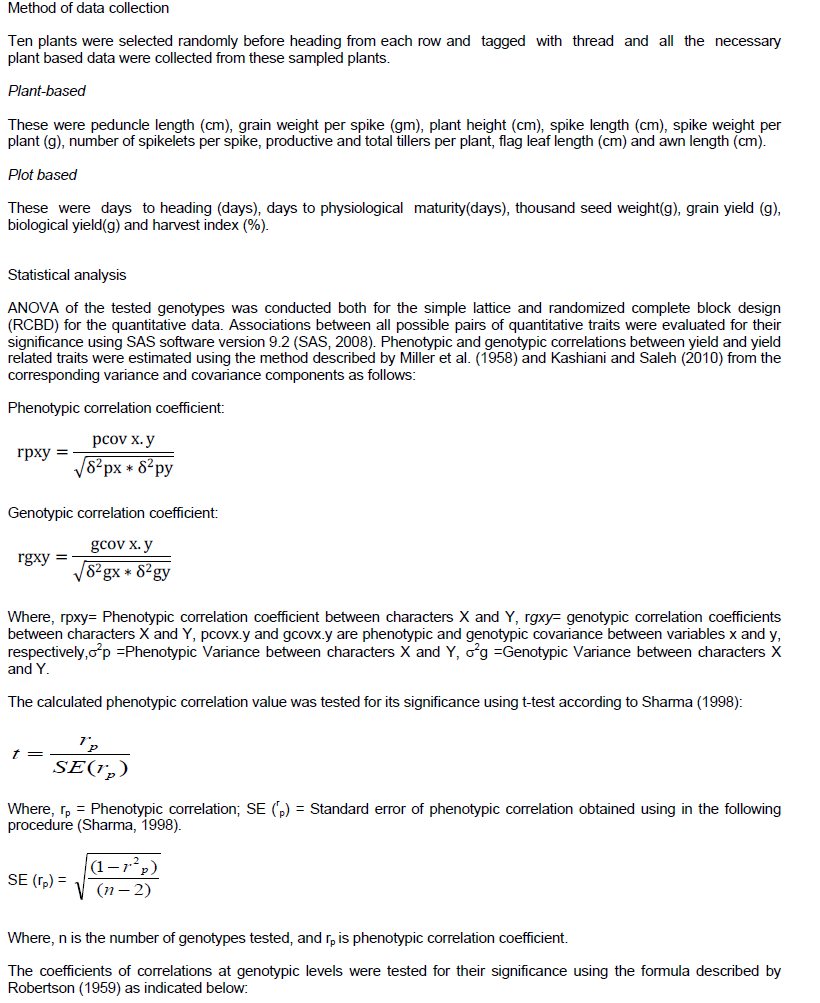
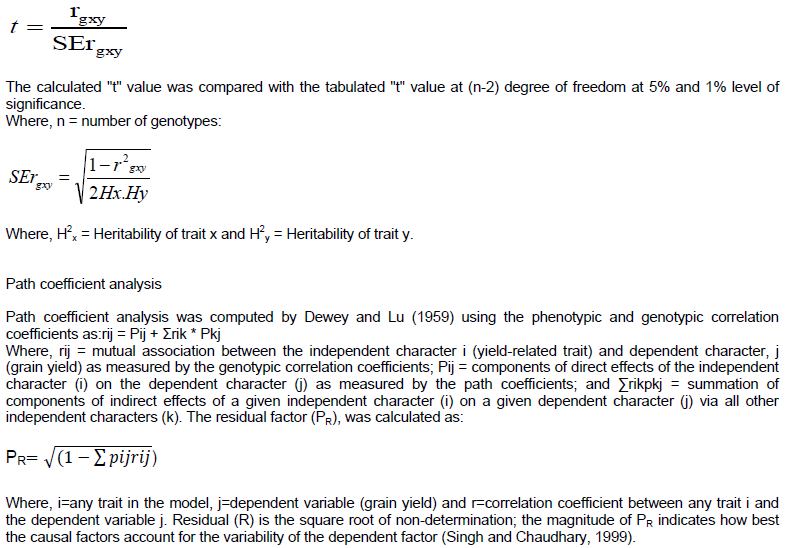
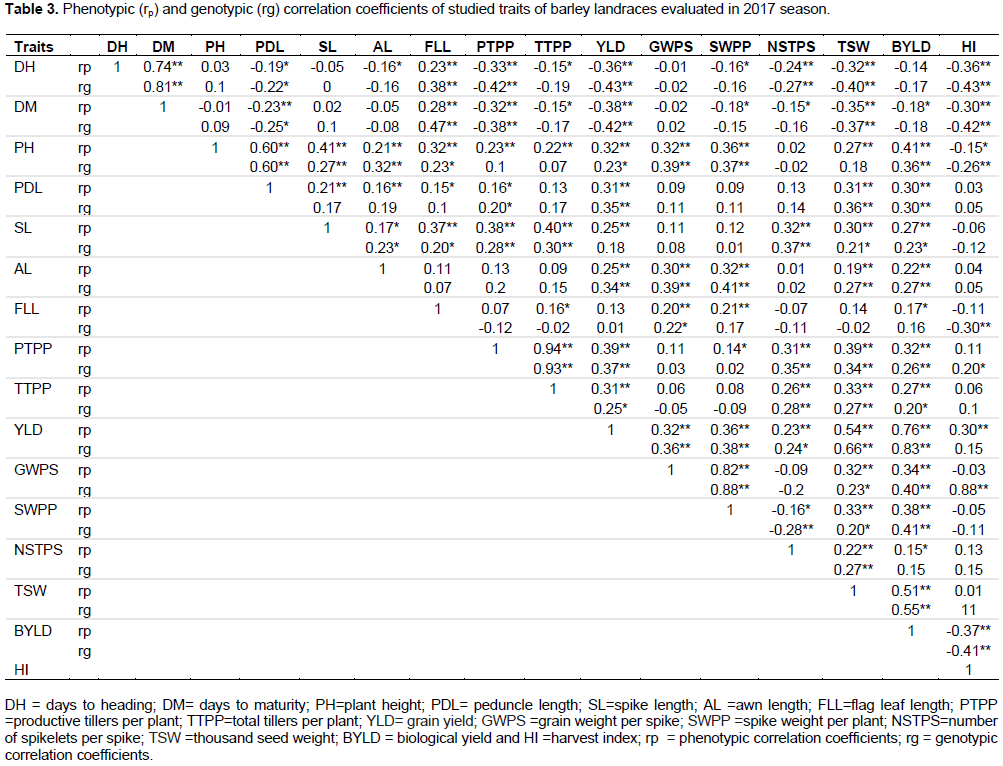
In the present study, the estimated values of phenotypic and genotypic correlation coefficients between all pairs of characters are presented in Table 3. The analyses revealed, genotypic correlation coefficient values were greater for most of the characters than their corresponding phenotypic correlation coefficient values, indicating inherent association of the characters so, that selection for the correlated characters could give a better yield.
Phenotypic correlations
Grain yield per plant showed positive and high significant (p<0.01) correlation with spike length (rp = 0.25), awn length (rp = 0.25), plant height (rp = 0.32), thousand seed weight (rp = 0.54), biological yield (rp = 0.76), harvest index (rp = 0.30) and grain weight per spike (rp = 0.32) (Table 3). It appears that phenotypic selection of phenotypically high values of these characters’ result in increasing yield potential. Similarly, positive and highly significant phenotypic correlation of grain yield with 1000-kernel weight and biological yield in all environments was reported by Azeb et al. (2016). This finding is also in agreement with those of Acevedo et al. (1991) and Alam et al. (2007) who reported the association of grain yield with plant height in barley. At phenotypic level, grain yield per plant was positively and significantly associated with biological yield and harvest index (Amardeep et al., 2017). Moreover, grain yield showed negative and significant phenotypic correlation with days to heading (rp = -0.36) and days to maturity (rp = -0.38) (Table 3) which is in agreement with the finding of Bhutta et al. (2005) and Blanco et al. (2010) on barley.
Genotypic correlations
Grain yield showed positive and significant correlation with grain weight per spike (rg = 0.36), spike weight per plant (rg = 0.38), 1000-seed weight (rg = 0.66), biological yield (rg = 0.83), awn length (rg = 0.34) and plant height (rg = 0.23). Similarly, grain yield had positive and highly significant genotypic correlation with 1000-kernel weight and biological yield in all environments (Azeb et al., 2016) and with biological yield and plant height at the genotypic level (Amardeep et al., 2017). However, days to heading (rg = -0.43) and days to maturity (rg = -0.42) had negatively significant correlation with grain yield (Table 3) which was also similarly reported by Bhutta et al. (2005). Azeb et al. (2016) also reported negative and highly significant genotypic correlation of grain yield with days to heading and days to maturity at Ofla site. This might be due to the presence of common genetic elements that controlled the characters in the same and/or in different direction. The observed significant positive correlation could be either due to the strong coupling linkage between the genes or was the result of pleiotropic genes that controlled these characters in the same direction (Kearsey and Pooni, 1996). Thus, the negative correlations of grain yield with days to heading and maturity indicates that, late varieties would produce low grain yield. Normally, inverse relationship between earliness characters and grain yield is necessary especially if stresses such as terminal heat and drought are expected. That means even if long duration of the growing period would mean that there would be more accumulation of dry matter over the extended growing period; and there should be certain compromise between earliness as a stress escape mechanism and the possible yield reduction in moisture stress areas. Previous studies have confirmed this result (Gebeyehou et al., 1982; Amin et al., 1992; Van Oosteron and Acevedo, 1992; Gashaw, 2007), which means that early heading genotypes with adequate grain filling period escape terminal moisture stress and, thus give better grain yield. The yield components exhibited varying trends of association among themselves.
Furthermore, plant height had positive significant association with peduncle length, spike length, awn length, grain weight per spike, spike weight per plant, and biological yield. Peduncle length had positive and significant correlation with productive tillers per pant, 1000-seed weight and biological yield. Spike length had positive and significant correlation with awn length, productive and total tillers per plant, number of spikelets per spike, 1000-seed weight and biological yield. The correlation of awn length with grain weight per spike, spike weight per plant, 1000-seed weight and biological yield was positive and significant. Productive tillers per plant had positive and significant correlation with total tillers per plant, number of spikelets per spike, 1000-seed weight, biological yield and harvest index (Table 3). The positive significant associations between grain yield and plant height because of these tall genotypes generally excelled in their capacity to support kernel growth by stem reserve mobilization (Blum et al., 1989). Therefore, selection for tall plants tends to increase grain yield per plant.
Path coefficient analysis
Path coefficient analysis provides more effective means of separating direct and indirect factors, permitting a critical examination of the specific forces acting to produce a given correlation and measuring the relative importance of the causal factors. Genotypic and phenotypic correlations were partitioned into direct and indirect effects using grain yield as a dependent variable. In this study, grain yield was the result of days to heading, days to maturity, plant height, peduncle length, awn length, total tillers per plant, productive tillers per plant, grain weight per spike, spike weight per plant, number of spikeletes per spike, 1000-seed weight, biological yield, harvest index and residual factor that included other factors affecting grain yield (Tables 4 and 5).
Genotypic path coefficient
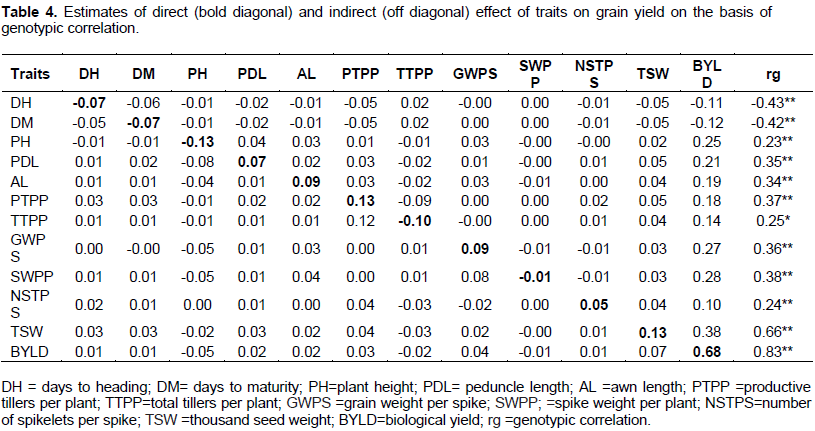
Biological yield had positive and significant correlation coefficient and it showed the highest positive direct effect (0.68) on grain yield. Biological yield has also exerted large indirect effects thousand seed weight, total tillers per plant, grain weight per spike than other characters included in the analysis showing its high contribution for a better partitioning of the photosynthetic products into the grain. The direct effect of 1000-seed weight followed by productive tillers per plant, awn length, grain weight per spike, peduncle length, and number of spikelets per spike on grain yield was positive with significant correlation and so exerted positive direct effect (Table 4). Biological yield, thousand kernel weight, productive tillers per plant and grain weight per spike revealed positive direct effect and had positive genetic correlation explaining the existence of real relation between the characters and yield indicating that, indirect selection of yield via this characteristic is effective. Similarly, Getachew et al. (2007) reported positive direct effect of the number of productive tillers per plant on grain yield in Ethiopian barley landraces. Azeb et al. (2016) indicated that biological yield exerted maximum positive direct effect on grain yield across locations. In another study the highest positive direct effect on seed yield per plant was exerted by biological yield, number of productive tillers per plant, plant height, length of spike, days to maturity, harvest index (Amardeep et al., 2017). Mogghhadam et al. (2009) and Blanco et al. (2010) reported positive direct effect of 1000-seed weight on grain yield. Bhutta et al. (2005) reported positive maximum association between peduncle length and number of spikelets with grain yield in six rowed barleys.

Plant height exerted higher negative direct effects on grain yield but positive and highly significant association at genotypic levels. The indirect effects of plant height on grain yield via biological yield was however positive and high. Smaller negative direct effects were also exerted by days to heading, days to maturity, total tillers per plant and spike weight per plant. However negative genotypic correlation was obtained only for days to heading and days to maturity. Days to heading, days to maturity and plant height had negative direct effect. The indirect effects of days to heading, days to maturity and plant height with other characters were mostly negatives and negligible. The total negative correlation coefficient of days to heading and maturity with grain yield were due to mainly direct effect while the positive correlation for plant height with grain yield was due to large indirect effect of biological yield (Table 4). The present study is in agreement with those of Pathak (2008) and Azeb et al. (2016) reporting negative direct effect of plant height on grain yield. The negative direct effect of days to heading, days to maturity and plant height on grain yield suggests the possibility that grain yield could be improved by focusing on early maturing genotypes with shorter or medium plant height. Shorter plant height is also responsive to high input resulting higher yield. Singh and Chaundhary (1985) suggested an indirect effect seemed to be the cause of correlation and hence, these indirect causal factors (traits) should be considered simultaneously for selection. Besides to significant, awn length, grain weight per spike, productive tillers per plant and thousand seed weight exhibited positive direct effects on grain yield indicating that, increasing in those traits could possibly to increase grain yield. The genotypic residual value (0.4326) showed that, the characters under study accounted for 56.74% of the variability with grain yield components (Table 4).
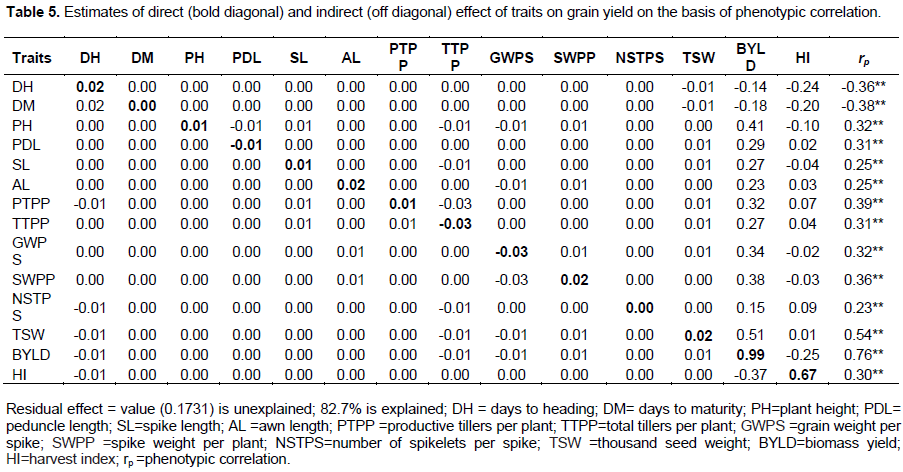
Phenotypic path coefficient analysis
Biological yield and harvest index showed positive and significant correlation (r = 0.76) and (r = 0.30) with grain yield and they had the highest direct effect (0.99) and (0.67) on grain yield respectively. The existence of negligible and positive indirect effect of biological yield and harvest index with most of the other characters determines that, the correlation of these traits with grain yield were found to be due to the direct effect (Table 5). Days to maturity has negligible positive direct effect on grain yield. The correlation of days to maturity with grain yield was because of indirect effect. Plant height, spike length, awn length, productive tillers per plant and 1000- seed weight have positive and negligible direct effect on grain yield and the phenotypic correlation they had with grain yield were positive. The indirect effect of biological yield through days to heading, total tillers per plant, grain weight per spike and harvest index counter balanced the direct effect of biological yield on grain yield. The indirect effect of harvest index through biological yield (-0.37) counter balanced the direct effect of harvest index on grain yield (0.67). The residual value (0.1731) showed the characters under the study accounted 82.7% of the variability in grain yield (Table 5).