ABSTRACT
The identification of stable and adaptable high yielding quinoa (Chenopodium quinoa Willd.) and, highly discriminative environments are worthwhile for a successful introduction and adoption of this crop in Burkina Faso. The objectives of this study were to determine the relationship among test environments, to identify the most discriminative and representative test environment(s), and to identify high yielding and stable quinoa variety. The study highlighted that prevailing agrometeorological conditions in an area determine the specificity of the environment. Thus, quinoa growth and productivity is affected by differences in pedological and meteorological conditions. Emerging findings showed that environment E1 at Farako-Bâ characterized by a relative low wind speed (2.03 m/s), no rainfall (0 mm) and moderate temperature (25.07°C), was efficient discriminative and representative of quinoa growing conditions in Burkina Faso for both grain yield and grain yield per plant. Quinoa varieties, Puno and Titicaca were the highest yielding (1132 and 892 kg/ha, respectively) and stable across the environments, while Pasankalla, with an average yield of 779 kg/ha, showed a specific adaptation in two environments having a short day length located at Saria and Lanfiera. The photoperiodicity and temperature were key factors determining the adaptation of this variety in an environment. Plant height and number of branches of Negra Collana were highly stable but its yield performance was low (121 kg/ha). The research implications of this study are numerous, including tailoring quinoa growing calendars and screening a large number of genotypes under the best test environment identified, prior a multi-location trial.
Key words: Quinoa, G x E interaction, GGEbiplot, pedological and meteorological conditions.
Quinoa is an ancestral crop, first domesticated by Andean pre-Columbian tribes 7000 years ago (Babot, 2011). Subsequently, its cultivation spread throughout the region, while diversifying and adapting to new ecotypes: Altiplano, Salares, Inter-Andean valleys, Coastal and Yunga zones (Jellen et al., 2015). Quinoa’s high genetic diversity is of growing interest in regions where environmental factors can limit the development of crops. Its resilience to abiotic stresses (drought-tolerant, thermo-resistant, halophyte plant, pH versatile, among others) has drawn scientific attention for its potential introduction in marginal environments (Sahel region, Middle East and North African region-MENA) (Bazile et al., 2016a, b). As a result, quinoa´s responses to different growing conditions have been studied worldwide. Changes in abiotic factors like photoperiod, radiations, temperature, soil types, wind and precipitation affect quinoa growth and productivity (Hirich et al., 2012, 2014; Razzaghi et al., 2012; Hinojosa et al., 2019; Alvar-Beltrán et al., 2019; Dao et al., 2020). Variation among quinoa varieties in response to environmental change was also observed. Hence, the investigation of the extent and nature of genotype by environment interaction is crucial for identifying suitable genotypes for a given agro-climatic zone.
Genotype by environment interaction can be explored based on the use of biplots, through Additive Main Effects and Multiplicative Interaction (AMMI) (Gauch et al., 2008) and Genotype and Genotype-Environment (GGE) interaction methods (Yan et al., 2000). The GGE biplot method exploits two sources of variation, GGE interaction simultaneously to evaluate genotype and test environment.
In GGE-biplot different visualization methods were developed to address specific questions relative to genotype by environments data (Yan and Tinker, 2006). Evaluation of both genotype and environment on GGE-biplot allows inspection of various aspects in the adaptability and stability analysis, like discriminating ability and representativeness of environments, mega-environment investigation, ‘ideal’ genotype identification and which-won-where pattern.
In general, the study of genotype by environment interaction emphasizes the genotype evaluation with identification to high mean performance and stable genotype. However, the environment evaluation is less explored. The understanding of the relationship between test environments can help breeders to reduce the number of environments by selecting one among several environments that provide the same information. Moreover, a prescreening test with multiple cultivars can be carried out in a discriminating and representative test environment for reducing the number of cultivars in multi-location trials. Since its introduction in Burkina Faso, quinoa has been tested in two agro-climatic zones (Soudano-Sahelian and Soudanian zones), for different sowing dates. These growing conditions define different physical environments representative of quinoa cultivation environment in Burkina Faso. Hence, in this study GGE biplot was used to determine the relationship among test environments, to identify the most discriminative and representative test environment, and to identify among four quinoa varieties the one with high yield performance and stable across environments.
Experimental design
The present study was conducted in Burkina Faso between 2018 and 2019 in five different locations: Farako-Bâ (11°05´N and 4°20´W; 416 m.a.s.l), Saria (12°16´N and 2°09´W; 320 m.a.s.l), Soumousso (11°00´N and 4°02´W; 304 m.a.s.l), Banakeledaga (11°19´N and 4°20´W; 320 m.a.s.l) and Lanfiera (13°00´N and 3°26´W; 358 m.a.s.l). There were 4 sowing dates (from October 2018 until January 2019) at Farako-Bâ and 3 sowing dates (from November 2018 until January 2019) at Saria; whereas the trials at Soumousso, Banakeledaga and Lanfiera were implemented in October 2019. In total, ten different trials were set up. In each trial four quinoa varieties (Negra Collana INIA, Pasankalla, Puno and Titicaca) were randomly laid out in completely block design with three replications.
Management strategies
The soil was prepared manually and prior to sowing the soil was amended using compost at a rate of 5 t/ha (1.1% N content). NPK fertilization (14-23-14) was applied during sowing at a rate of 100 kg/ha, while 30 days after sowing (DAS) urea, CO(NH2)2 (46% N content), was spread at rate of 100 kg/ha. Prior to sowing the seeds were treated with insecticides (Permethrin 25 g/kg and Thiram 250 g/ kg), and 3 to 5 seeds were introduced per hole at 10 mm depth. At 15 DAS, quinoa plants were thinned and 1 plant was left per hole giving a plant density of 20 plant/m2. The trials were fully irrigated twice a week using a drip-irrigation system at Farako-Bâ and Saria and furrow irrigation system at Soumousso, Banakélédaga and Lanfiéra.
Agrometeorological measurements
The time to maturity (MAT), plant height (PH), branches per plant (BP), grain yield per plant (GYP) and grain yield per hectare (GY) for the four varieties were collected. In addition, the following meteorological parameters were measured: mean air temperature (°C), precipitation (mm) and photoperiodicity (minutes/day), wind speed (m/s). Prior to sowing, soil samples, were extracted using an auger at 0-40 cm depth to measure the soil physico-chemical characteristics: soil texture (% clay, loam and sand) pH water, organic carbon, organic matter content (%), nitrogen content in the soil (%), while P and K available (mg/kg) for the plant in the soil were estimated using Bray-method.
In this study, ‘environment’ was defined as the observed microclimate conditions during the period of evaluation. It was characterized by combination of six factors including geographical coordinates, air temperature, photoperiod, wind speed, precipitation and soil characteristics that were prevailing during the trial. Hence, the 10 trials corresponded to 10 different environments.
Data analysis
Analysis of variance was conducted with PROC MIXED procedure in SAS (SAS, 2004) to determine genotype (G), environment (E) and genotype x environment (G x E) effects for all the traits evaluated. Afterwards, data was subjected to genotype, genotype x environment (GGE) biplot analysis (Yan and Tinker, 2006). The biplots visually describe genotypic performance over multiple environments based on principal components. The biplots were formatted for comparing environments to a hypothetical ideal environment as well as to compare the different genotypes to an ideal genotype. The graphical display of GGE biplot was constructed using GGE-biplot software (GGE-biplot, 2012).
Agrometeorological parameters
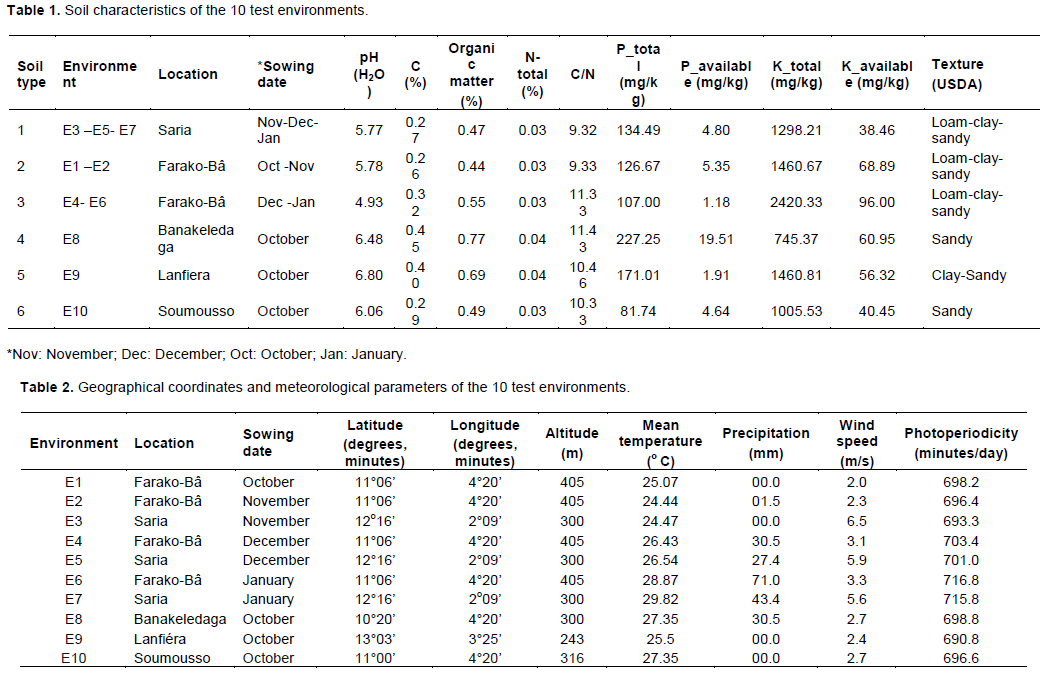
The 10 test environments were characterized for having different textural classes: sandy-loam-clay soil for E1 to E7, sandy soil for E8 and E10 and clay-sandy soil for E9 (Table 1). The soil pH ranges for these environments were very strongly acidic (E4; E6), moderately acidic (E1; E2; E3; E5; E7), slightly acidic (E8; E10) and neutral (E9). E8 (0.77%) and E9 (0.69%) showed a slightly higher organic matter when compared to the other environments (from 0.44 to 0.55%). The availability of phosphorus (P) was particularly high in E8 (19.51 mg/kg) and low in E4, E6 (1.18 mg/kg) and E9 (1.91 mg/kg). Whereas, the availability of potassium (K) was higher in E4 and E6 compared to others environments. Analysis of the physico-chemical properties and the texture of the soils of the 10 test environments highlighted the differences among the six soil types, however environments with soil types 1 and 2 presented similar soil composition and texture though they were located distant from each other (Saria and Farako-Bâ). In contrary, environments with soil types 2 and 3 were found in the same location (Farako-Bâ), but showed important differences in soil properties (particularly in terms of pH, P and K availability).
All the environments considered in this study were distributed in two agro-climatic zones, Soudanian agro-climatic zone (all the environments located at Farako-Bâ, Soummousso, Banakélédaga and lanfiéra) and Soudano-Sahelian agro-climatic zone (environments at Saria) (Table 2). Strong Harmattan winds (prevailing winds from the north) were observed in both zones, being more intense in Soudano-Sahelian agro-climatic zone. Slightly variability in wind speeds among the environments in Soudanian agro-climatic zone was observed with E1 recording the lowest wind speed value of 2.0 m/s. There was no a major difference in photoperiod among the 10 environments. The maximum difference in photoperiod between environments was 26 min/day. The shortest day length was in E3 (693.3 min/day) and E9 (690.8 min/day) while the longest day length was in E6 (716.8 min/day) and E7 (715.8 min/day) (Table 2).
Mean-temperatures during the growing period of quinoa were moderate (between 24.4 and 25.5°C in E1, E2, E3 and E9), slightly moderate (between 26.4 and 27.4°C in E4, E5, E8 and E9) and high (above 28.5°C in E6 and E7). Exceptional precipitations were recorded in six environments (E2, E4, E5, E6, E7 and E8), a precipitation of 71 mm registered in E6 was particularly higher compared to others environments. Combined analysis of the geographical coordinates, meteorological parameters (temperature, wind speed, photoperiodicity, and precipitation) and soil properties indicate that each of the 10 environments presented unique characteristics. Only E1 and E2 tended to have similar characteristics.
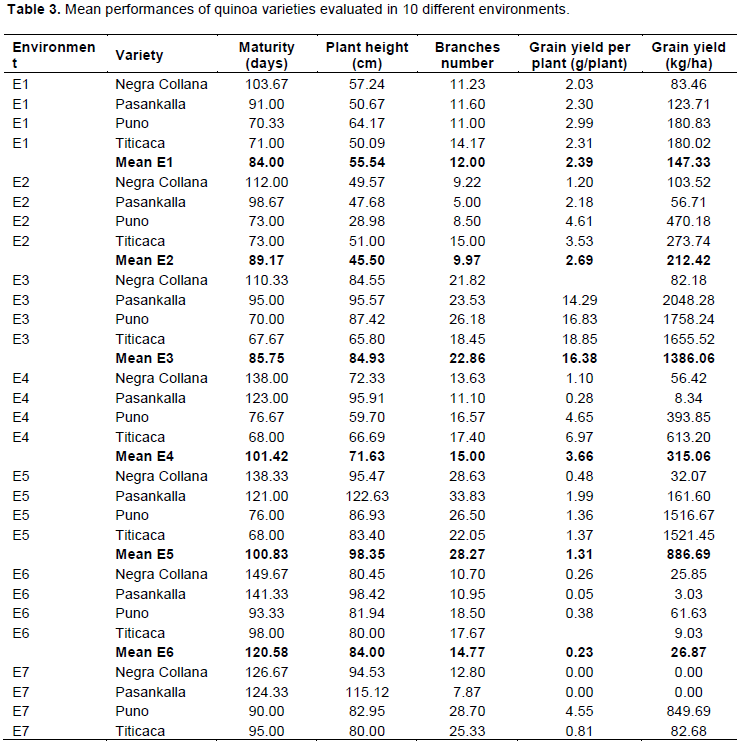
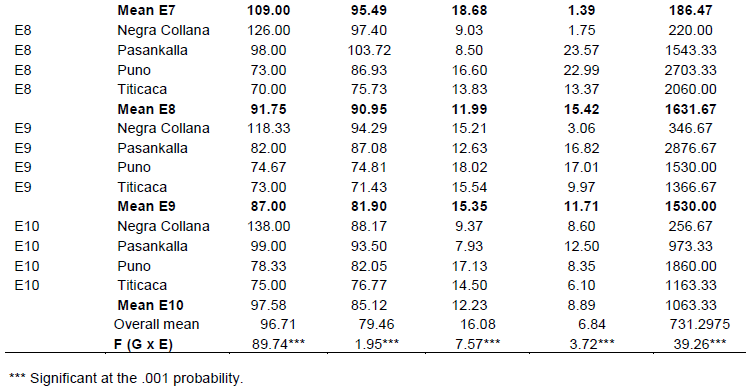
Mean performance and combined analysis of variance
Environment means grain yield (GY) and grain yield per plant (GYP) ranged from 26.87 kg/ha and 0.23 g/plant, respectively at E6 to 1631.67 kg/ha (GY) at E8 and 16.38 g/plant (GYP) at E3 (Table 3). At E2, quinoa plants were characterized for having a different branching architecture when compared to E5. The quinoa varieties were early maturing (84 days) at E1 and late maturing (120 days) at E6. Genotype means GY and GYP ranged from 0 (Negra Collana, Pasankalla) to 2877 kg/ha and 23.57 g/plant (Pasankalla), respectively. Results of combined ANOVA revealed significant genotype by environment interaction (G X E) effect for all evaluated traits.
GGE plot analysis for maturity day, plant height and branches number
Discriminating ability and representativeness of test environments
The discriminating ability of the environments is indicated by the length of the environment vectors, which is proportional to the standard deviation within the respective environments (Yan et al., 2011). It indicates the ability of the test environment to provide information about genotype difference. Hence, the most discriminative environment has the longest vector.
Discriminating but non-representative test environments are useful for selecting specifically adapted genotypes in a specific environment. The representativeness of test environments referred to the consistency of a targeted environment when compared with the mean of all test environments, it is measured by the angle formed by the test environment with Average environment Axis (AEA), represented by the small circle at the end of the arrow. The smaller the angle between environment vector and the AEA, the more representative the tested environment.
Interpretation of the Figures 1 to 3 indicate that all tested environments were almost equally discriminative for maturity day, plant height and branches number indicating that all these environments detected phenological and morphological difference among quinoa varieties. However, the representativeness of the 10 environments were different. Test environments E1, E2 and E3 were the most representative for maturity day, E9 and E10 for plant height and, E7 and E6 for branches number.

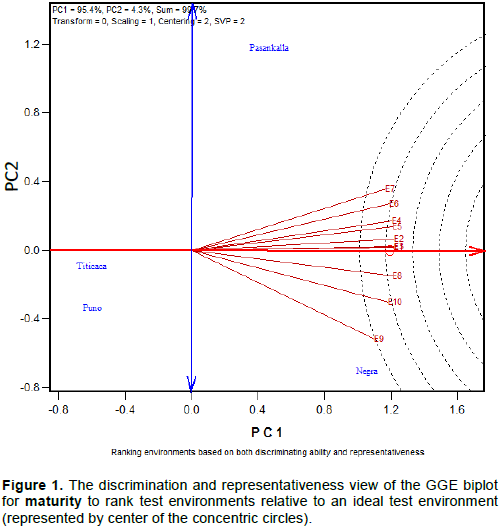
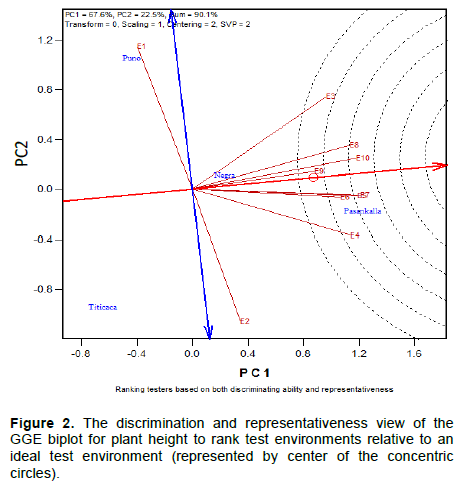
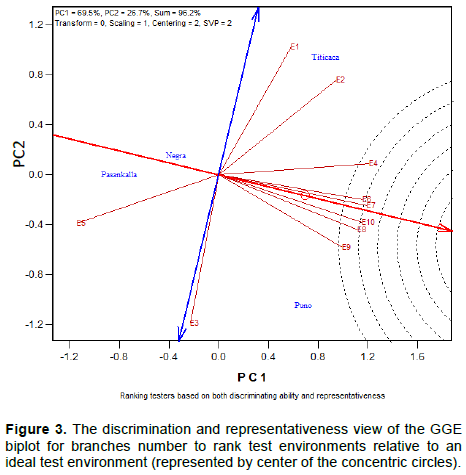
The ideal test environments for selecting generally adapted genotype should be both discriminating and representative. In Figures 1 to 3, the ideal test environment is the center of the concentric circles. It is a point on the AEA in the positive direction (most representative) with a distance to the biplot origin equal to the longest vector of all environments (most informative). The closest environment(s) to this point is or are the best. Thus, E1 and E3 are the best environments to determine the maturity period of quinoa varieties, E5, E7 and E10 for plant height and, E6, E7, E8 and E10 for branches number.
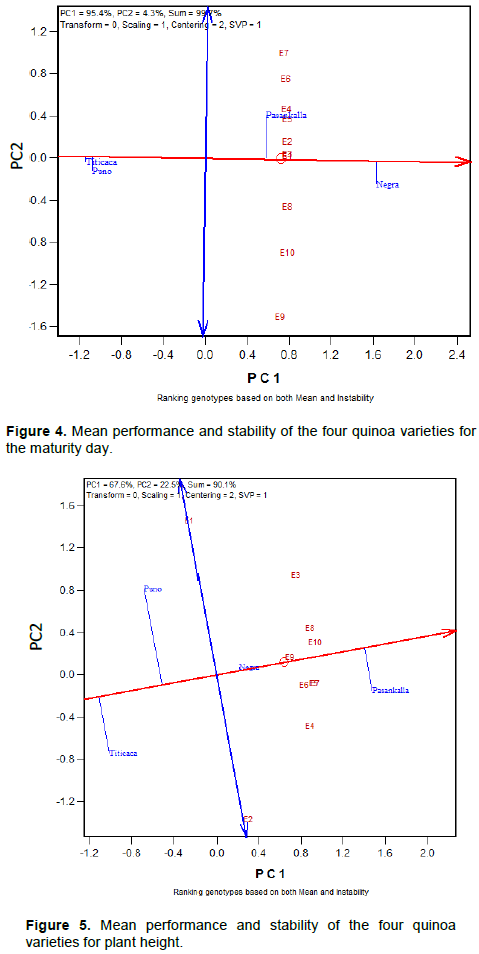
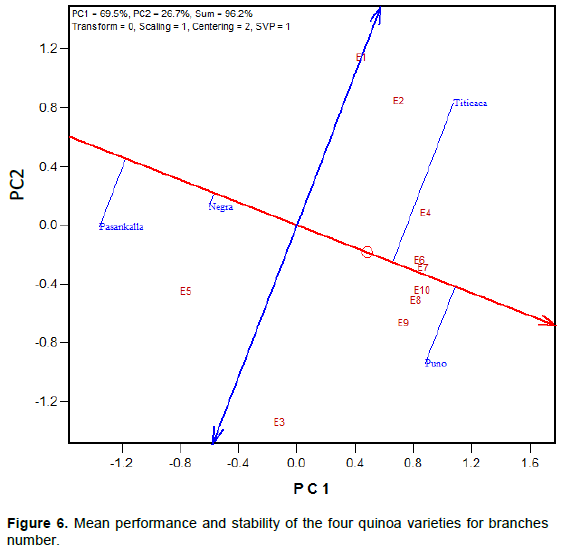
Mean performance and stability of the quinoa varieties
Mean performance and stability of the quinoa varieties for maturity day, plant height and branches number is represented in Figures 4 to 6, respectively. The Average Environment Coordinate (AEC) abscissa (single-arrowed line) points to higher mean of the trait across environments whereas the AEC ordinate, double-arrowed line, points to greater variability (poorer stability) in either direction.
Figure 4 represents the time to maturity of the four genotypes in study, Titicaca and Puno were early maturing and consistent across environments when compared to Negra Collana and Pasankalla, characterized for having a longer time to maturity period and for not being stable across environments. The plant
height of Negra Collana was very stable across environments contrary to the plant height of others varieties that was very variable (Figure 5). In addition, the graph indicates that plants of Negra Collana and Pasankalla are higher when compared to Puno and Titicaca. Like in Figure 5, Negra Collana had a consistent number of branches across environments (Figure 6) but there was a high variability of branches number for the other varieties especially for Titicaca. Overall, Pasankalla and Negra Collana developed less branches than Titicaca and Puno.
GGE plot analysis for grain yield and grain yield per plant
Correlation, discriminating ability and representativeness of test environments
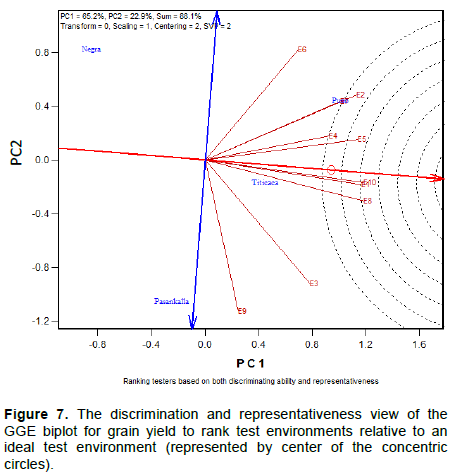
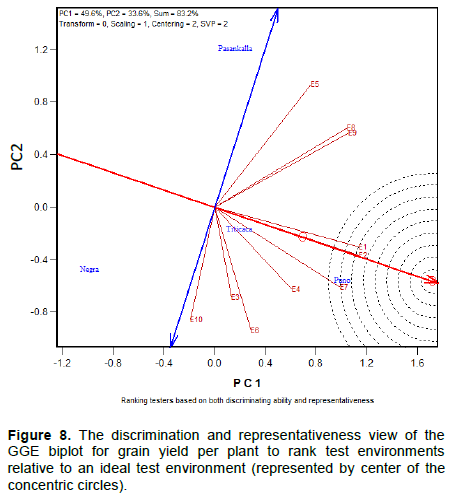
The correlation between two environments was determined by the cosine of the angle between them.
Thus, acute angle (< 90°) indicates a positive correlation, right angle (90°) and obtuse angles (> 90°) denote no correlation and negative correlation, respectively. Figures 7 and 8 indicate three pairs of environments that are closely related. These are E8/E9; E1/E2; E3/E6 for grain yield per plant (GYP) and E1/E10; E4/E5; E2/E7 for grain yield (GY). This indicates that the same information about the yield performance of quinoa varieties could be obtained from fewer test environments, and hence the potential to reduce testing cost.
The graphics indicate also the presence of an important Genotype by environment interaction (GE). This is because of the presence of strong negative correlations (wide obtuse angles) among test environments, which is an indication of strong crossover GE. In Figures 7 and 8 the largest angle are greater than 90° (between E6 and E9 for GY; between E5 and E10 for GYP). The most discriminating (informative) quinoa test environments in Burkina Faso and also the most representative are E1 and E10 for GY and E1 and E2 for GYP. The two environments for each trait are also correlated. E1 is an ideal test environment for both GY and GYP, it should be the test environment of choice to screen quinoa varieties for general adaptability.
Mean performance and stability of the quinoa varieties
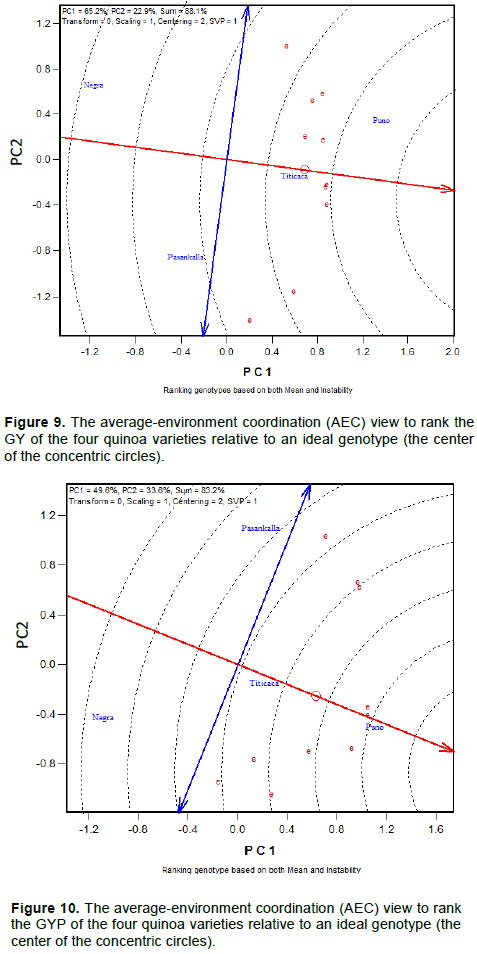
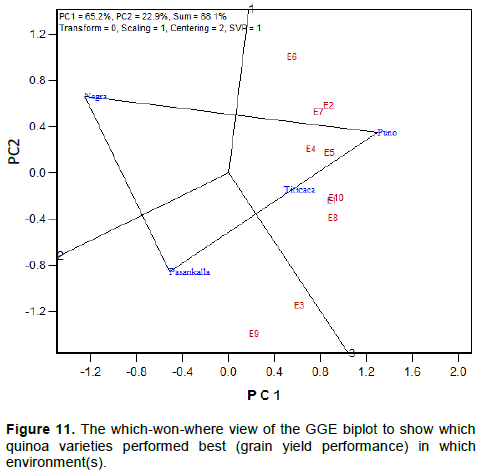
GY and GYP of Titicaca were very stable across environments and higher compared to the performance of Pasankalla and Negra Collana (Figures 9 and 10). An “ideal” genotype (the center of the concentric circles) is a point on the AEA (absolutely stable) in the positive direction and has a vector length equal to the longest vectors of the genotypes on the positive side of AEA (highest mean performance). Therefore, genotypes located closer to the ‘ideal genotype’ are more desirable than others.
In this study, Puno was the best genotype carrying both higher yield (GYP and GY) performance and stability and Negra Collana was the poorest genotype. Puno showed a slightly GY variability among environments. Negra Collana and Pasankalla showed a high sensitivity to the environment. GY and GYP variability of Pasankalla were particularly very high.
Specific adaptation of the varieties (which-won-where)
The function of “which-won-where” of a GGE biplot allows the visual inspection of the mega-environment differentiation and specific adaptation. In Figure 11, there is two representations, a polygon regroup all the four quinoa varieties and three rays that originated from the biplot origin divide the polygon into three sectors. Thus, each sector having its own winning variety at the vertex. Therefore, Pasankalla performed better in environments E3 and E9, whereas Puno was the winning variety in the 8 other environments. Negra Collana was located in a vertex but there was no environment in the sector. It indicates that Negra Collana had the poor yield performance in all the environments. Titicaca is located on the line that connects Puno and Pasankalla showing that the grain yield of the three varieties are ordered as follows Puno, Titicaca and Pasankalla in almost all the environments.
Quinoa growth, germination and productivity are affected by several abiotic factors including temperature, photoperiod, soil types, wind and rainfall intensity (Hirich et al., 2012; Razzaghi et al., 2012; Hirich et al., 2014; Hinojosa et al., 2019; Alvar-Beltrán et al., 2019; Dao et al., 2020). The combination of these factors has a major influence on the prevailing agro-climatic conditions of an area.
Results of this study showed correlations among the test environments for all the traits evaluated. However, the environmental factors explaining the similarity of the correlated environments were not clearly established. But, it evidently appears that a combination of several environmental elements determine quinoa growth and productivity. Others abiotic factors that were not collected in this study may also influence quinoa growth. For instance, it was demonstrated that radiation, not considered in this study, influences quinoa growth and yield, with more radiation led to more leaf elongation and growth and consequently decrease in the growing period of quinoa (Bertero, 2001; Hirich et al., 2014). In addition to abiotic factors affecting quinoa growth, the occurrence of some biotic factors such as insect and weeds in the test environments may affect quinoa productivity.
Findings of the study indicated that the geographical position, particularly the Longitude and Altitude, of a location is not a major factor influencing quinoa performance in Burkina Faso. Mukankusi et al. (2016) reported a similar result with altitudinal differences varying from 200 to 900 mm between test environments in a study conducted in Eastern and Southern Africa. However, the Latitude may affect differently the genotypes depending their sensitivity to photoperiod.
The current study identified the test environment E1 as the best test environment to evaluate quinoa varieties for grain yield and grain yield per plant. It provides more information on the tested genotypes and is representative, to some extent, of the potential quinoa growing environments in Burkina Faso. Quinoa variety selected in such environment will have a large adaptation. The postulate environmental parameters of E1 that made it different to the others test environments are the relative low wind speed (2.03 m/s), no rainfall (0 mm) and moderate temperature (25.07°C). Previous studies demonstrated the influence of these abiotic factors on quinoa growth and productivity. More wind and heavy rain negatively affect quinoa productivity by flattening the plants (Maliro and Guwela, 2015; Dao et al., 2020), and the extreme temperatures are not favorable for quinoa germination, growth and productivity (Garcia et al., 2015; Hinojosa et al., 2018; Dao et al., 2020). These findings suggest that breeders should target such environmental condition to effectively screen new quinoa genotypes in this region.
Results on yield stability of the four quinoa varieties tested suggest that Puno and Titicaca can be recommended in Burkina Faso in all the growing environments since they had both high mean performance and high stability across environments. On the other hand, Pasankalla did not showed a large adaptation but presented a high yield performance in two test environments (E3 and E9), so it should be recommend for specific environments. Pasankalla tends to be highly sensitive to photoperiod than the three others genotypes. The high yields registered for this genotype were 2877 and 2048 kg/ha at E9 and E3, respectively, the photoperiodicity at these two environments was low with 690.8 mm/day and 693.3 mm/day, respectively. However, when the photoperiodicity is high the yield performance of Pasankalla is low. At E7 and E6, it yielded 0 kg/ha and 3.03 kg/ha with a day length of 715.8 mm/day and 716.8 mm/day, respectively. In addition to photoperiod, high temperature and the occurrence of the precipitation at E6 and E7 account for the low yield performance of Pasankalla in these environments.
The visualization of which-won-where patterns of GGE biplot identifies the existence of two different ‘mega-environments’ in quinoa growing conditions. The mega-environment defines by environments E3 and E9, and the mega-environment represented by the 8 others environments (E1; E2; E4; E5; E6; E7; E8; E10). Results showed that all the environments in the latter mega-environment are closely related except E6 evidencing their similarity. On the other hand, the soil and meteorological parameters do not show a clear pattern that could explain the difference of the two mega-environments. However, we hypothesize that the photoperiodicity, temperature and precipitation occurrence might be major factors creating the difference between environments. These findings highlight the fact that mega-environment in quinoa evaluation cannot be define by the physical location or the macro agro-climatic conditions prevailing in a region. For instance, environments E4 and E5 located in Soudanian agro-climatic and Soudano-Sahelian agro-climatic zones, respectively, belong to the same mega-environment. Likewise, environments E3 and E9 forming one mega-environment are located in two different locations and agro-climatic zones.
The morphological and agronomical characteristics of the four varieties have had determined their response to the test environments. Puno and Titacaca are early maturing genotypes with short plants, more branches and a glomerulate panicle while Pasankalla is an intermediate maturing genotype with tall plants, less branches and amarantiform. The poorest variety across the environments was Negra Collana, late maturing genotype with tall plants, less branches and amarantiform. The long maturity period of this variety was the major limiting factor in all the test environments. The genotypes with a compact (glomerulate) inflorescence are more exposed to the effect of winds and heavy rain than a lax (amarantiform) inflorescence. On the other hand, early maturing varieties can easily escape high temperature period contrary to long cycle varieties.
Results on the depiction of the mega-environments and the response of quinoa varieties suggest that crop calendars cannot be tailored according to the different agro-climatic zones in Burkina Faso, opposing to what Dao et al. (2020) recommended. It should rather be adapted to specific soil types and meteorological conditions.
Breeders conduct multi-location trials and employ different G x E analytical methods to identify the most stable genotype for several crops (Mahendra et al., 2016; Mukankusi et al., 2016; Oladosu et al., 2017; Mare et al., 2017; Edmar et al., 2019; Yan and Rajcan, 2002). In addition, these studies help the breeder to select locations that are efficient for distinguishing among genotypes and that are good representatives of the target regions. Identification of redundant test locations can reduce testing cost and improve the efficiency of breeding programs. In the light of this study, multi-location trails can be conducted in fewer locations but in varying the environmental conditions (soil types, meteorological parameters) in a single location. Prior, the major environmental factors affecting the crop in the target region should be identified.
Quinoa, recently introduced in Africa’ Sahelian regions, can contribute to reduce the malnutrition if it is adopted by the population and grown by farmers. Study of genotype by environment interaction pattern provided useful information on quinoa adaptation in Burkina Faso growing conditions. Soil characteristics, air temperature, wind speed and precipitation were the key agrometeorological parameters identified that characterized quinoa growing environments. The extent of the variation of one or several of these environmental factors will determine the quinoa performance. The variability of quinoa genotypes in response to environmental factors was also proved indicating that the cycle of maturity and plant architecture of quinoa determine its adaptation to an environment. In the light of this study, Puno, Titicaca and Pasankalla can be recommended for release in Burkina Faso. Puno and Titicaca have a large adaption whereas Pasankalla will be recommended for specific environments.
The authors have not declared any conflict of interests.
To the Food and Agriculture Organization (FAO) for the seed and fund provision for carrying out this experiment under the technical cooperation programs TCP/SFW/3404 and TCP/RAF/3602.
REFERENCES
|
Alvar-Beltrán J, Dao A, Marta AD, Saturnin C, Casini P, Sanou J, Orlandini S (2019). Effect of drought, nitrogen fertilization, temperature, and photoperiodicity on quinoa plant growth and development in the Sahel. Agronomy 9(10):607.
Crossref
|
|
|
|
Babot MDP (2011). Cazadores-recolectores de los andes centrosur y procesamiento vegetal: Una discusión desde la puna meridional argentina (ca. 7.000-3.200 años AP). Chungará (Arica) 43(Especial): 413-432.
Crossref
|
|
|
|
|
Bazile D, Pulvento C, Verniau A, Al-Nusairi MS, Ba D, Breidy J, Sepahvand NA (2016a). Worldwide evaluations of quinoa: preliminary results from post international year of quinoa FAO projects in nine countries. Frontiers in Plant Science 7:850.
Crossref
|
|
|
|
|
Bazile D, Jacobsen SE, Verniau A (2016b). The global expansion of quinoa: trends and limits. Frontiers in Plant Science 7:622.
Crossref
|
|
|
|
|
Bertero D (2001). Effects of photoperiod temperature and radiation on the rate of leaf appearance in quinoa (Chenopodium quinoa Willd.) under field conditions. Annals of Botany 87(4):495-502.
Crossref
|
|
|
|
|
Dao A, Guira A, Alvar-Beltrán J, Gnanda A, Nebie L, Sanou J (2020). Quinoa's response to different sowing periods in two agro-ecological zones of Burkina Faso. Italian Journal of Agrometeorology 3:63-72.
|
|
|
|
|
Mahendra D, Todd W, Richard H, Daniel P, George B, Stephen O, Stephen K, Angela D, Gregory T, Jerome B, Benito J (2016). Value of locations for representing mega-environments and for discriminating yield of watermelon in the U.S. Crop Science 56:1726-1735.
Crossref
|
|
|
|
|
Edmar V, Marcia E, Marcio K, Marcelo L (2019). Selection and recommend of quinoa (Chenopodium quinoa) genotypes based on the yield genotypic adaptability and stability. Revista Ceres 66:117-123.
Crossref
|
|
|
|
|
Gauch HG, Piepho HP, Annicchiarico P (2008). Statistical analysis of yield trials by AMMI and GGE: further considerations. Crop Science 48:866-889.
Crossref
|
|
|
|
|
GGE-biplot (2012). GGE-biplot software version 8.1. The Complete Biplot Analysis System: GGEbiplot Pattern Explorer. Copy Right Weikai Yan 2001-2012 USA.
|
|
|
|
|
Hinojosa L, González JA, Barriosâ€Masias FH, Fuentes F, Murphy K (2018). Quinoa abiotic stress responses: a review. Plants 7(106).
Crossref
|
|
|
|
|
Hinojosa L, Matanguihan JB, Murphy KM (2019). Effect of high temperature on pollen morphology plant growth and seed yield in quinoa (Chenopodium quinoa Willd.). Journal of Agronomy and Crop Science 205(1):33-45.
Crossref
|
|
|
|
|
Hirich A, Choukrâ€Allah R, Jacobsen SE (2014). Quinoa in Morocco-effect of sowing dates on development and yield. Journal of Agronomy and Crop Science 200(5):371-377.
Crossref
|
|
|
|
|
Hirich A, Choukr-Allah R, Jacobsen SE, Benlhabib O (2012). Could quinoa be an alternative crop of wheat in the Mediterranean region? case of Morocco. Les notes d'alerte du CIHEAM 86:1-8.
|
|
|
|
|
Jellen E, Maughan P, Fuentes F, Kolano B (2015). Chapter 1.1. Botany phylogeny and evaluation. In: Bazile Didier (ed.) Bertero Hector Daniel (ed.) Nieto Carlos (ed.). State of the art report on quinoa around the world in 2013. Santiago du Chili: FAO CIRAD pp. 12-23.
|
|
|
|
|
Maliro MFA, Guwela V (2015). Quinoa Breeding in Africa: History, Goals, and Progress. Chapter 9. In Quinoa: improvement and sustainable production pp. 161-170.
Crossref
|
|
|
|
|
Mare M, Manjeru P, Ncube B, Sisito G (2017). GGE biplot analysis of genotypes by environment interaction on Sorghum bicolor L. (Moench) in Zimbabwe. African Journal of Plant Science 11:308-319.
Crossref
|
|
|
|
|
Mukankusi C, Amongi W, Berhanu F, Wanderi S, Rono BK, Okee JP, Okiro AO, Mwaba C, Kooma E, Abang M (2016). Adaptability of quinoa (Chenopodium quinoa Willd) in Eastern and Southern Africa: Potential implications for food security and climate change adaptation. International Quinoa Conference 2016: Quinoa for Future Food and Nutrition Security in Marginal Environments, Dubai 6-8 December 2016 [Accessed on: 8/02/2020]. Available at:
View
|
|
|
|
|
Oladosu Y, Rafii MY, Magaji U, Abdullah N, Ramli A, Hussin G (2017). Assessing the representative and discriminative ability of test environments for rice breeding in Malaysia using GGE Biplot. International Journal of Scientific and Technology Research 6(11):8-16.
|
|
|
|
|
Razzaghi F, Plauborg F, Jacobsen SE, Jensen CR, Andersen MN (2012). Effect of nitrogen and water availability of three soil types on yield radiation use efficiency and evapotranspiration in field-grown quinoa. Agricultural Water Management 109:20-29.
Crossref
|
|
|
|
|
SAS Institute. (2004). User's guide: Statistics. Cary NC: SAS Institute.
|
|
|
|
|
Yan W, Hunt LA, Sheng Q, Szlavnics Z (2000). Cultivar evaluation and mega-environment investigation based on the GGE biplot. Crop Science 40(3):597-605.
Crossref
|
|
|
|
|
Yan W, Rajcan I (2002). Biplot analysis of test sites and trait relations of soybean in Ontario. Crop Science 42(1):11-20.
Crossref
|
|
|
|
|
Yan W, Tinker NA (2006). Biplot analysis of multi-environment trial data: Principles and applications. Canadian Journal of Plant Science 86(3):623-645.
Crossref
|
|
|
|
|
Yan W, Pageau D, Frégeau-Reid J, Durand J (2011). Assessing the representativeness and repeatability of test locations for genotype evaluation. Crop Science 51:1603-1610.
Crossref
|
|