ABSTRACT
Dialium guineense is a multipurpose species useful in many respects. It is used in agroforestry and the trade of most of its organs is source of income for rural populations. Despite the high interests of this species to populations, we do not know much about how its spatial distribution could be impacted by climate change and which strategies to implement for its sustainable use and conservation. In order to overcome these challenges, MaxEnt was used to model the ecological niche of D. guineense and different decision thresholds were used to interpret and classify the outputs. Climate will impact the distribution of D. guineense. Indeed under Africlim rcp 4.5 horizon 2055, the predicted stable areas of species distribution will be about 73% of West Africa when the threshold of the minimum training presence is considered and will decrease to 12% when the threshold of the maximum training sensitivity plus specificity is considered. Under Africlim 8.5 horizon 2055, the corresponding values for the stable areas of the species are, respectively 70 and 8% of the study area. In comparison with the global results of West Africa, in Benin, D. guineense will be less threatened by climate change. As strategies for sustainable use and conservation of the species, growing and introducing it in its favorable areas to account for its absence or low densities, is recommended. Also, building capacities to the users of the species so that they can grow it on their farms is recommended.
Key words: Dialium guineense, ecological niche modeling, biodiversity conservation.
Despite its utmost importance to the survival of humanity, biodiversity is submitted to threat of habitat destruction, ecosystem overexploitation, invasive alien species, climate change, and pollution (Millenium Ecosystem Assessment (MA), 2005; CBD, 2011; Åževik, 2012; Åževik et al., 2012; Åževik and TopaçoÄŸlu, 2015; Yigit et al., 2016). In certain continents, for example Africa, these threats are furthermore exacerbated by many developmental challenges such as endemic poverty, complex governance, limited access to capital including markets, infrastructure, and technology, ecosystems degradation, complex disasters, and conflicts (Boko et al., 2007). Warming trends in temperature and climate related extremes such as heat waves, droughts, floods, cyclones, and wildfires are being observed at global scale and across regions (Boko et al., 2007; IPCC, 2013, 2014). These effects are known to particularly affect poorest regions like several African countries, impacting agricultural production and causing risks of ill-human health and death.
They will aggravate water stress and inundation and impact ecosystems’ composition, structure, and functions. This will result in food insecurity, loss of biodiversity and ecosystems goods, functions, and services provided to people (Boko et al., 2007; Bentz et al., 2010; IPCC, 1997, 2014). Under climate change threat, species might respond in different ways. For example, species might survive in the margins of their actual range, track or colonize new areas where ecological conditions are more suitable or might even go extinct (IPCC, 1997, 2014; Hannah et al., 2007; Blach-Overgaard et al., 2010; Sanchez et al. 2011; Abrahms, 2017). In order to address the threat of climate change to biodiversity, it is important to advance our knowledge on species geographic distributions and the factors that govern their spatial patterns.
It is known that climatic and physical factors impact the geographic distributions of species at different spatial scales (Soberón and Peterson, 2005). At large spatial scales, climate is considered more relevant than biotic interactions in determining species’ geographic distributions (Pearson and Dawson, 2003). Based on this, the approach of ecological niche and species distribution modeling (ENM and SDM, respectively) use the relationship between species occurrence points and their related environmental variables to describe the ecological niche (climatic preferences) and the potential spatial distribution of species (Peterson et al., 2011). Such ENM and SDM approaches are currently widely used in biogeography, conservation biology and ecology (Stockwell and Peterson, 2001; Segurado and Araújo, 2004; Pearson et al., 2007; Elith et al., 2011).
For examples, Fandohan et al. (2015) modeled the vulnerability of protected areas of Benin to possible invasion of Lantana camara (invasive species native to South America) under current and future climates; Adjahossou et al. (2016) assessed the effectiveness of protected areas through the prediction of potential favorable areas for the cultivation and conservation of some tree species of socio-economic importance in Benin; Idohou et al. (2016) used niche models to identify potential spatial priorities for the conservation of wild palm species across West Africa; Gbètoho et al. (2017) applied ecological niche models to predict the suitability and ability of some pioneer forest species to restore secondary forests in Lama forest reserve in Benin. All those studies showed the usefulness of the ENM/SDM approach for providing information that can derive in adequate strategies to conserve species, communities, biomes, and biodiversity as a whole at national, regional or more global scales.
Dialium guineense commonly named black velvet or velvet tamarind belongs to the family of Fabaceae- Cesalpinioidae (Orwa et al., 2009). It is a multipurpose species useful in many respects. The species is used in agroforestry and is believed to restore soil fertility in fallows (Ewédjè and Tandjiékpon, 2011). Its fruits have high nutritional potentialities and selected micronutrients (Ayessou et al., 2014). It is recognized that the crude leaf extracts of D. guineense exhibit some anti-vibrio activities and significant antioxidant and antimicrobial properties (David et al., 2011; Ogu et al., 2013). The leaves of this species are also used to cure many diseases such as diarrhea, cough, stomachaches, malaria fever (Ogu and Amiebenomo, 2012).
Its wood is said to make good firewood and charcoals (Orwa et al., 2009; Ewédjè and Tandjiékpon, 2011). The stems of the species are used in water ponds for fish-farming purposes and the trade of its fruits, firewood and charcoal is a substantial source of income for rural populations (Ewédjè and Tandjiékpon, 2011). Despite those high interests of D. guineense to populations, we do not know much about how its spatial distribution could be impacted by climate change and which strategies to implement for its sustainable use and conservation in West Africa [our landscape of interest (LOI)] and particularly in Benin.
In order to achieve that purpose, this study aimed at addressing the following research questions: in the context of climate change, under different scenarios (IPCC, 2013); (i) what is the extent of stable (suitable both at present and in the future) areas for the spatial distribution of D. guineense? (ii) What is the extent of unsuitable (both at present and in the future) areas for the spatial distribution of the species? (iii) What is the extent of the areas of the spatial distribution of the species that are suitable at present but unsuitable in the future? (iv) What is the extent of the areas of the spatial distribution of the species that are unsuitable at present but will become suitable in the future? Answering those questions will surely help us address our main research objective that is to identify and set in place adequate strategies to contribute to the conservation and sustainable use of the multiple resources of D. guineense.
Data sources
Study species and presence data
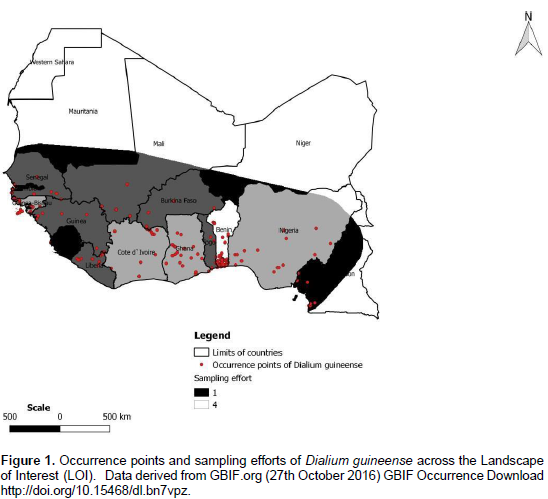
The natural distributional range of D. guineense encompasses many parts of Sub Saharan Africa (Orwa et al., 2009; Ayessou et al., 2014) where it is found in humid dense forests, dry dense forests, and forest galleries (Ewédjè and Tandjiékpon, 2011). In its natural range, the species is submitted to a temperature ranging from 25 to 32°C and a mean annual rainfall of 900 to 3000 mm (Ewédjè and Tandjiékpon, 2011). Its habitats distribution was studied in Benin by Assongba et al. (2013). According to their main results, the species was found in D. guineense and Sida acuta-community that grows on farms, gardens, and fallows; in D. guineense and Berlinia grandiflora- community in savannas; and in D. guineense and Celtis zenkeri-community in semi-deciduous and gallery forests. The occurrence data we used in our study were downloaded from GBIF site in October 2016 (http://doi.org/10.15468/dl.bn7vpz). A final dataset of 947 georeferenced records was retained to run models with MaxEnt (Phillips et al., 2006) after cleaning efforts that consisted in eliminating: occurrences data lacking geographic coordinates and those falling outside West Africa, our landscape of interest.
Environmental variables
Fifteen bioclimatic variables (bio1-bio7 and bio10-bio17) were downloaded from Wordclim site (Hijmans et al., 2005;
http://www.worldclim.org/current) at a resolution of 2.5 arc minutes (approximately 5 Km at equator). Those data cover the time period 1950-2000 (Hijmans, 2005). Corresponding projection environmental layers were downloaded on Africlim site (Platts et al., 2014;
https://webfiles.york.ac.uk/KITE/AfriClim/GeoTIFF_150s /) under rcp4.5 and rcp8.5, horizon 2055. Only 15 projection environmental layers (bio1-bio7 and bio10-bio17) are available on Africlim site, and this justifies why we relied on Worldclim to choose the corresponding environmental layers for the present. Africlim environmental layers for projections were considered advantageous over that of Wordclim because they are more adapted to the ecological realities of Africa than the pixel resolutions of general circulation models (Platts et al., 2014). Moreover, the general circulation models have less confidence simulating surface temperature at regional levels than at larger scales and the precipitations are not simulated at regional scales because of uncertainties in observations (IPCC, 2013).
In Africlim ensembles derived from two Regional Circulation Models, a range of observational baselines were used to empirically downscale the models outputs to resolutions that can capture environmental local variations and are therefore useful for ecological applications at local scales (up to 1 km) (Platts et al., 2014). According to Soberón and Peterson (2005) four classes of factors affect the distribution of species: 1) abiotic factors in terms of climate, topography, soils; 2) biotic factors such as interactions between species (competition, mutualism, diseases); 3) accessibility of the species to the area studied (availability of seeds and dispersers, absence of barriers) from original distribution areas in ecological time; 4) evolutionary capacities of species to adapt to new environment. Taking into account the case of D. guineense with respect to those four classes of factors affecting and explaining its actual distribution, we inferred that the actual area where the occurrence points are sampled globally defined its region of accessibility and represent the region (M) on the Venn Diagram of Soberón and Peterson (2005).
According to Barve et al. (2011), M has important implications in model training as it represents the area where background points are sampled. According to the same authors, M also affects the model validation because, the larger its extent, the better the model predicts suitable areas of the distribution of a species. The specification of M is also important in model comparison because it impacts the relative similarity of niches sampled from that space (Barve et al., 2011). We considered that region (M) as our Landscape of Interest (LOI) and clipped the environmental layers to that LOI (Figure 1). As we know, one fundamental limitation to presence-only data is sample bias whereby some areas in the landscape are sampled more intensively than others (Phillips et al., 2009). In order to account for that, we considered that in West Africa, where the species grows, the countries don’t inventory or publish their data at the same rate / intensity; we therefore added bias grids on a scale of 1 (less effort in inventorying and publishing data) to 4 (most effort in inventorying and publishing data) to represent sampling efforts across the LOI (Elith et al., 2011) (Figure 1). This enabled us to provide a bias file to run Max Ent.
Model fitting
We used MaxEnt to achieve our modeling purpose. In order to calculate the probability of the species’ presence, MaxEnt uses background data which are randomly sampled in the LOI (Phillips et al., 2006, 2009). According to Phillips et al. (2009), the purpose of selecting background data is also to characterize the environmental factors shaping the geographic distribution of presence records. That approach is important for presence-only data since it alleviates bias in samples and improves the prediction performance of models (Phillips et al., 2009). The MaxEnt method is however somehow limiting as the reliable estimation of the probability of the presence of a species over a LOI requires true-absence data (Soberón and Peterson, 2005; Pearce et al., 2006; Soberón and Nakamura, 2009). It is however known that MaxEnt has a better predictive ability than other algorithms like the Genetic Algorithm for Rule-Set Prediction (GARP) (Pearson et al., 2007).
It is indeed evident that in general, MaxEnt predicted a larger proportion of the presence of species and is therefore more helpful in exploration purposes designed to discover new distributional areas of species (Pearson et al., 2007). With respect to the types of the data, MaxEnt also performed well compared to a set of algorithms (Genetic algorithm for Rule-Set prediction, Generalized linear models, Boosted regression trees, Random forests) in predicting the relationship of species to environment, mapping predictions, and extrapolating predictions beyond the training data (Elith and Graham, 2009). In order to run MaxEnt, we converted the environmental layers into ascii format using QGIS 2.16.2. We used the default value 1 as regularization multiplier (beta value). We then proceeded to the selection of appropriate environmental variables.
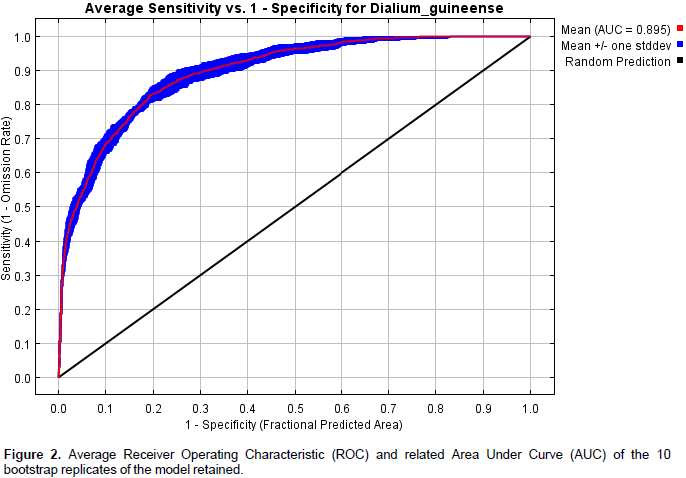
For that purpose, the Receiver Operating Characteristic (ROC) curve and its related Area Under Curve (AUC) (Phillips et al., 2006), the percentage contribution table of variables, and the Jackknife charts were taken into account to judge the most important contributing variables to the models and these were bio3 (isothermality), bio4 (temperature seasonality), bio12 (annual precipitation), and bio15 (precipitation seasonality). In order to run MaxEnt, we used the following settings options: 25 as value of random test percentage; 10,000 as maximum number of background points; remove duplicate presence records. The remaining options were set to default. The models simulating climate changes are based on scenarios of anthropogenic forcings (IPCC, 2013). In the framework of the fifth assessment report (AR5) of the Intergovernmental Panel on Climate Change (IPCC), a new set of scenarios, the Representative Concentration Pathways (RCPs), was used for the new climate model simulations led by the Coupled Model Inter comparison Project Phase 5 (CMIP5) of the World Climate Research Program.
The magnitude of projected changes in climate is substantially affected by the choice of emission scenarios (IPCC, 2013). Four RCP scenarios are used withinCMIP5. They are identified by the 21st century peak or stabilization of the radiative forcings (RF) derived from reference model (IPCC, 2013). We therefore had the lowest RCP scenario corresponding to a RF of 2.6 W m-2 by 2100; two medium RCP scenarios corresponding respectively to RF of 4.5 and 6 W m-2 by 2100 and the highest RCP scenario that corresponds to a RF of 8.5 W m-2 by 2100. Among all those scenarios, emissions would need to decline drastically in order to reach the level of 2.6 W/m² by the end of the century. According to Van Vuuren et al. (2011), to achieve that purpose, the cumulative emission reduction over the century will be about 70% compared to the baseline trends.
This will need great efforts and involvement of every country in improving energy efficiency, replacement of unabated use of fossil fuels by renewable energy, nuclear power (Van Vuuren et al., 2011). As of today, both at national and international levels, little is done to achieve that purpose and even, countries among the big greenhouse gases emitters don’t agree on actions to be taken forward to reduce emissions. The recent withdrawal of USA from the climate change agreements is an illustration of lack of consensus in that field. Therefore, achieving the purpose of the scenario of RCP 2.6 is not obvious. In this context, in predicting the distribution of D. guineense, we used two of the above scenarios: RCP 4.5 (the low medium) where some mitigation efforts by governments and world populations are supposed to limit RF at 4.5 W m-2 by 2100 and RCP 8.5 (the highest scenario) where mitigation efforts are supposed to be at their least. After selecting the most relevant variables, we ran MaxEnt with 10 replicates using the bootstrapping as replicated run type. In the bootstrapping replication process, the training data is selected by sampling with replacement from the presence points, with the number of samples equaling the total number of presence points (Phillips, 2010). This option will compensate the little numbers of presence points in parts of our LOI. Projection layers under each scenario were provided accordingly.
Model evaluation
We proceeded to the selection of models using threshold-independent tests. For this purpose, we took into account the Receiver Operating Characteristic (ROC) curve and its related Area Under Curve (AUC) (Phillips et al., 2006); for more model validation, we also used the Partial ROC test (Peterson et al. 2008; http://shiny.conabio.gob.mx:3838/nichetoolb2/). Furthermore, we used a threshold-dependent test (the True Skill Statistic (TSS) (Allouche et al., 2006); to appraise the decision thresholds we chose to classify MaxEnt outputs as unsuitable, suitable or highly suitable for the presence of the species in geographic space.
Impact of climate change evaluation
Using QGIS 2.16.2 adequate algorithms of the Geospatial Data Abstraction Library (GDAL), we reclassified, converted, and polygonize (raster to vector) appropriate output layers and calculated the extent of the spatial distribution of the species with respect to decision thresholds at present and in the future (horizon 2055) under the considered scenarios. The decision thresholds we used are “the minimum training presence” representing areas where ecological factors for the occurrence of D. guineense are as favorable as those found at the occurrence points (conservative and most ecologically reasonable option) (Pearson et al., 2007); the maximum training sensitivity plus specificity (least conservative and most likely presence option).
With respect to the decision thresholds, we categorized the whole distribution area of the species into a) stable area, that is the area suitable (pixels where the probability of presence of the species is more or equal to the logistic threshold related to the decision threshold considered) at present and predicted to be so in the future under either scenarios; b) unsuitable area (pixels where the probability of presence of the species is less than the logistic threshold related to the decision threshold considered) at present and predicted to remain so in the future under either scenarios; c) suitable area at present but predicted to be unsuitable in the future under either scenarios; d) unsuitable area at present but predicted to become suitable in the future under either scenarios. This helped us derive potential spatial distributions of D. guineense and use them as tools to inform the potential impact of climate change, which in turn allowed us suggesting strategies for the sustainable use and conservation of the species.
Model validation
The average training Area Under Curve (AUC) for the 10 bootstrap replicate runs was 0.895 with a standard deviation of 0.010 (Figure 2). This low value of the standard deviation indicates a limited dispersion of AUC values among the replicates. The results of Partial ROC test showed that after 500 simulations, the mean value for AUC ratio at 0.05 omission rate is 1.86 and that of AUC is 0.93. Furthermore, the test showed that the difference between the AUC from model prediction and the AUC at random is highly significant and therefore, the model performs better than random. The values of the True Skill Statistic (TSS) test at the threshold values of 0.043 (minimum training presence, conservative option) and 0.311 (maximum training sensitivity plus specificity, least conservative and most likely presence option) are respectively 0.288 and 0.586 and also showed that the model performed better than random.
Environmental variables controlling the spatial distribution of D. guineense
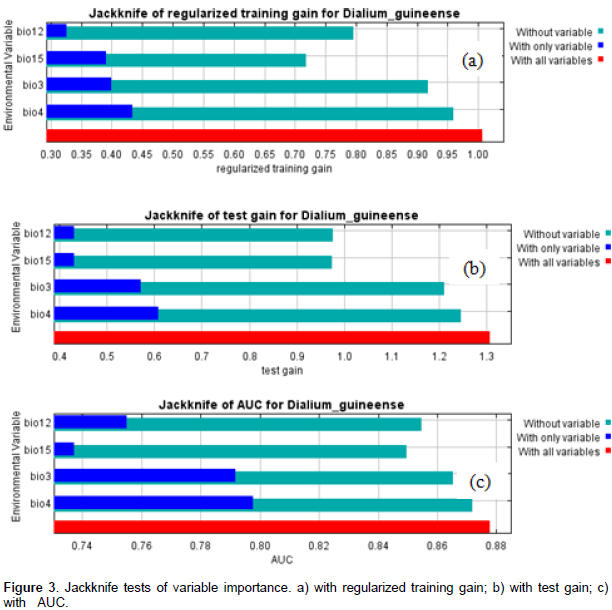
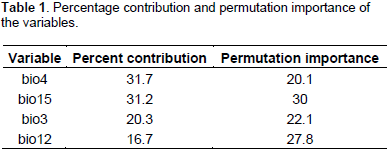
From our knowledge on the ecology of the species, D. guineense is a Guinean species, growing optimally in equatorial and subequatorial zones characterized by abundant and regular rainfall. Its presence in drier zones is usually linked to water galleries and swampy zones. The Jackknife tests of variable importance (Figures 3a, b, and c) and the table of variable contributions (Table 1) helped us identify four environmental variables as contributing most to the spatial distribution of Dialiumguineense. They are bio3 (isothermality), bio4 (temperature seasonality), bio12 (annual precipitation), and bio15 (precipitation seasonality). The Jackknife tests of variable importance showed that leaving out any of those four variables did not allow achieving the training gain, AUC and test gain levels of the whole set of variables. Consistent with the Jackknife tests, the table of variable importance (Table 1) showed that bio 4 (temperature seasonality) was the most important contributing variable to the model among the set of the four variables retained in the model. Bio 15 (precipitation seasonality) decreases the gain the most when omitted and appears to be the most informative variable of the model.

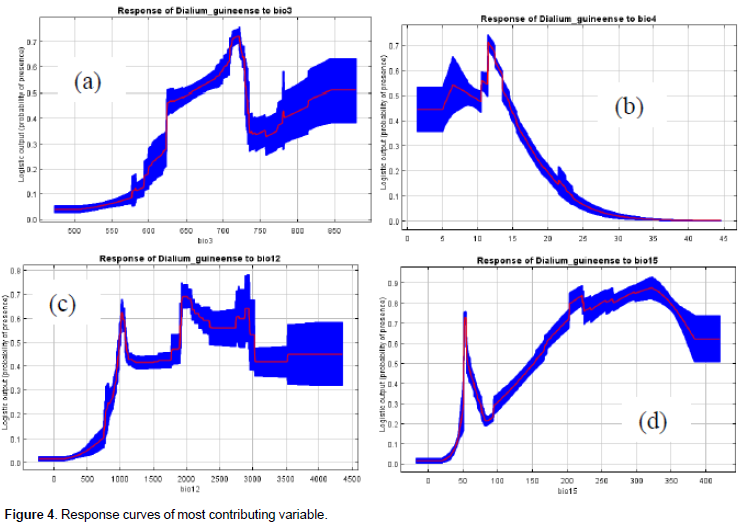
The response curves of those variables to the suitability prediction of the species are in Figures 4a, b, c, and d. Bio3 clearly showed the responsiveness of the species to monthly diurnal temperature variability relative to that of the year. We deduced that the prediction of higher suitability for the species coincides with a percentage variation of about 62 to 75% of diurnal monthly range temperature relative to the annual one (Figure 4a). The species is therefore not linked to the extreme fluctuations of monthly diurnal temperature. The response curve of the species to bio4 (temperature seasonality) showed that the highest probabilities of its presence are linked to the least seasonality (1 to 15%) and that higher values are likely limiting its presence. The response curve of the species to bio 12 (annual precipitation) is also consistent with its ecology and indicated values of precipitation of 1000 mm and more as optimal values for the species high suitability prediction. The response of the species to bio15 (precipitation seasonality) showed that the prediction of highest suitability for the species is linked to the highest values (15 to 40%) of that variable. This result is also consistent with the known ecology of the species that is alternately exposed to dry and rainy seasons in its natural range.

Spatial distribution of the species at present
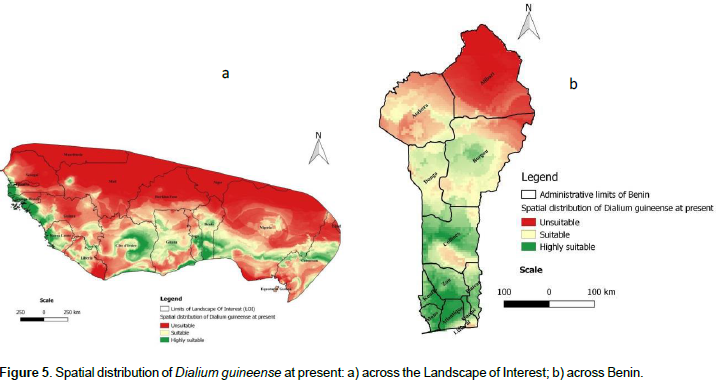
The present spatial distribution of D. guineense in the landscape of interest (LOI) is presented on Figure 5a. In the LOI, the prediction of suitability is higher southwards, mostly limited to coastal zones of West African countries. However, gaps of suitability (or low suitable areas) were predicted to occur all over the coastal zones. The northern parts of the LOI are the domain of unsuitable prediction, which may be related to the mostly dry Sahelian climate that is inconsistent with the ecology of the species. In Benin (Figure 5b), the distribution of the species is globally similar to that of the LOI. Consistent with the general distributions, we noticed that high suitability prediction is concentrated in the South of the country and more precisely in the six southern departments (Ouémé, Plateau, Littoral, Altlantique, Mono, and Kouffo) that are influenced by a subequatorial climate consistent with the ecology of the species. The suitability prediction is also noted in the central part of the country whereas the unsuitable prediction is mostly concentrated in the northern departments (Donga, Atakora, Borgou, and Alibori) mostly characterized by a Sudanian Sahelian climate, unsuitable for the ecology of D. guineense.
Projected distribution of the species in the future
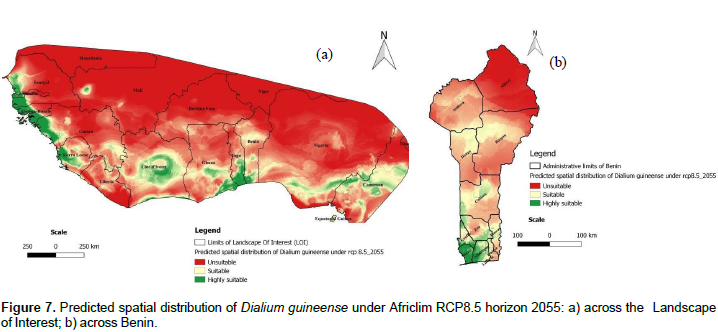
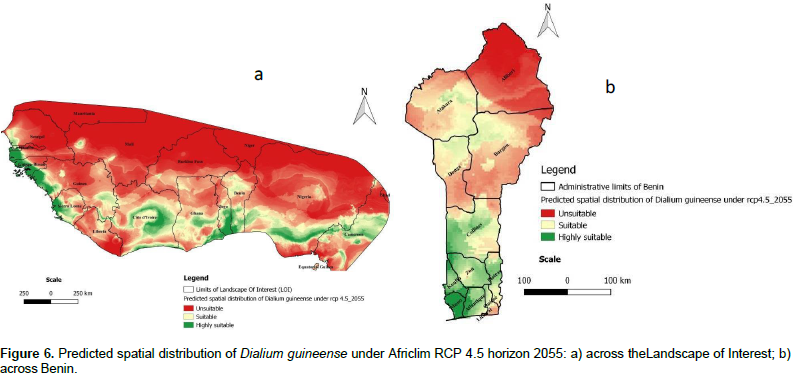
The projected distributions of D. guineense for 2055 across the LOI are presented in Figures 6a and 7a, respectively under Africlim rcp 4.5 and rcp 8.5. Compared to the distribution at present (Figure 5a), we noted that the suitability prediction progressively decreases in most of the countries under both scenarios with a maximum decay under rcp 8 .5. In Benin (Figures 6b and 7b), consistent with the general predictions across the LOI, only the departments of Atlantique and Mono respectively in South Center and South West of the country, are predicted to remain suitable for the species under rcp 8.5.

Impact of climate change on the spatial distribution of D. guineense
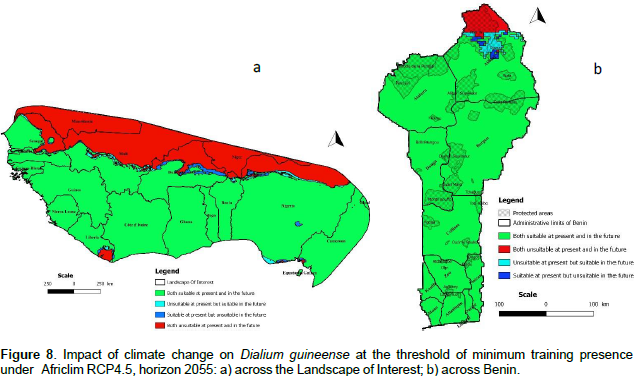
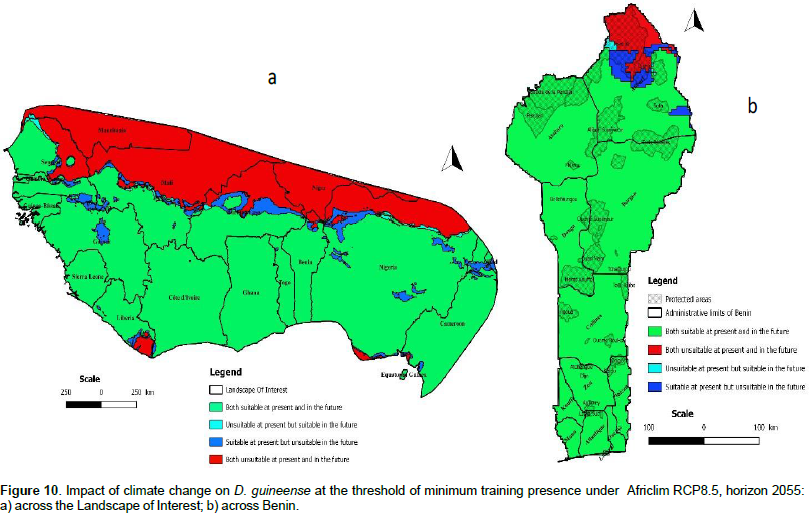
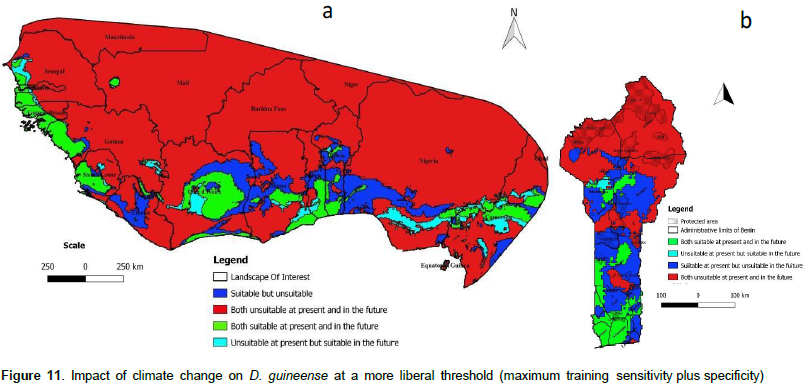
We noted that under Africlim rcp 4.5 horizon 2055 (Figures 8 and 9; Tables 2 to 5), the predicted stable areas of the distribution of the species will be about 73% of the LOI when we considered the threshold of the minimum training presence and will decrease to 12% of the LOI when the threshold of the maximum training sensitivity plus specificity is considered. Under Africlim 8.5 horizon 2055, the corresponding values we noted for the stable areas are respectively 70 and 8% of the LOI (Figures 10 and 11; Tables 2 to 5). Globally, under Africlim rcp 4.5 at horizon 2055 (Figures 8 and 9; Tables 2 to 5) the predicted suitable areas for the distribution of D. guineense will be about 74% of the LOI at the threshold of the minimum training presence and will decrease to about 17% of the LOI at the threshold of the maximum training sensitivity plus specificity.

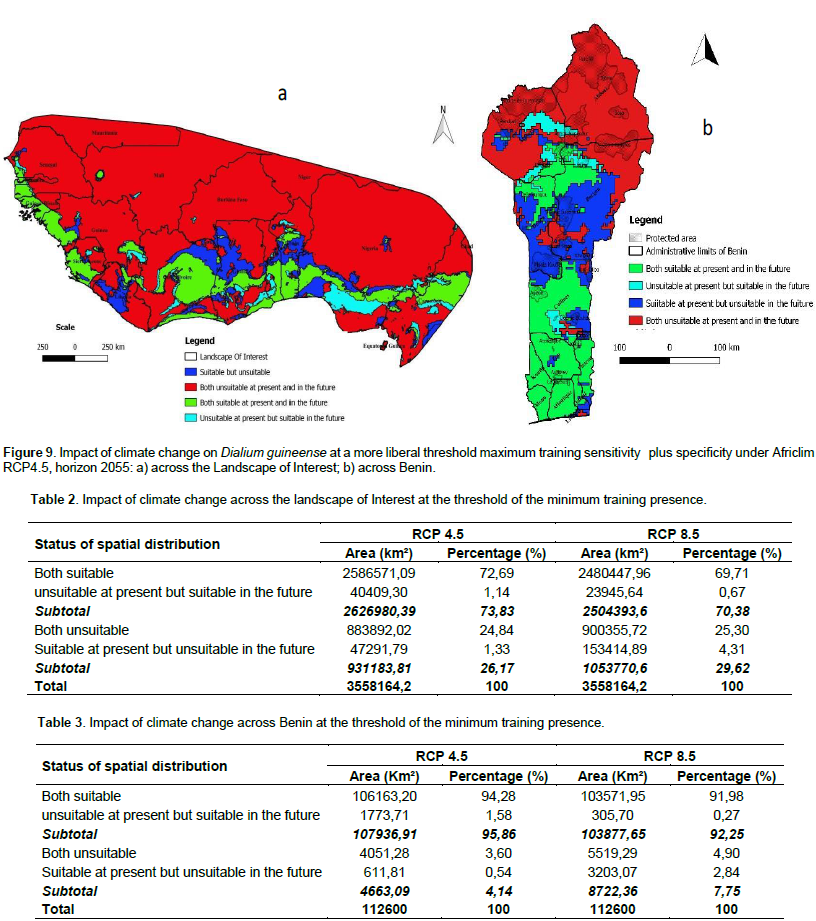
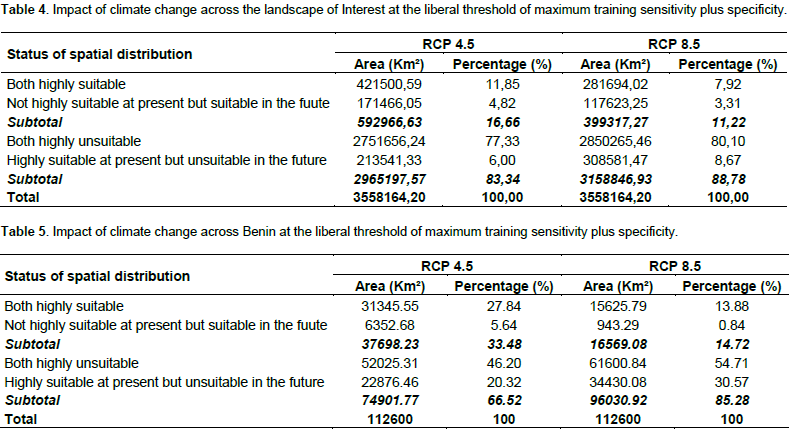


Under Africlim 8.5 horizon 2055, the corresponding values of the predicted suitable area for the distribution of D. guineense will be respectively 70 and 11% of the LOI (Figures 10 and 11; Tables 2 to 5). At the threshold of the minimum training presence, under Africlim 4.5, horizon 2055, the predicted suitable areas of D. guineense is mostly concentrated on coastal countries with however a thorough extension northwards except a South Eastern part of Liberia at the border of Côte- d’Ivoire. Only the upmost northern parts coinciding with the Sahelian zones of the LOI are predicted unsuitable for the species. At the same threshold, under Africlim rcp 8.5, horizon 2055, the predicted suitable areas of the distribution of the species is close to its extension under Africlim rcp 4.5 with however a remarkable reduction at the northern parts of the LOI. At the threshold of the maximum sensitivity plus specificity, only portions of some coastal countries are predicted suitable to the species and this distribution worsted up under Africlim 8.5, horizon 2055 (Figures 8 to 11; Tables 2 to 5).
In Benin, the predictions are globally similar to the general trends of the LOI though, some particularities are noted. At the threshold of minimum training presence, only an upmost northern part of the country (4663 Km², 4% of the country) covering the national park W in the Department of Albori is predicted unsuitable for the species under Africlim 4.5 horizon 2055 (Figure 8a and Table 3). Under Africlim 8.5 horizon 2055, the predicted unsuitable area of the distribution of the species extended southwards (87722 Km², 7.75% of the country) and encompassed the forest reserves of Djona and Alibori (Figure 10b, Table 3). At the threshold of maximum training sensitivity and specificity, the predicted suitable area of the species is about 33% of the total area of the country (112600 Km²) under rcp 4.5 horizon 2055 (Figure 9b; Table 5) and will decrease by more than 50% under rcp 8.5 at the same horizon (Figure 11b, Table 5).
Moreover at that threshold, when we focused on Benin under rcp 4.5 at horizon 2055 (Figure 9b), we realized that only few protected areas, namely the forests of Djigbé in the Department of Atlantique in South Benin, Lama in South and Center Benin, Kétou-Dogo in the Department of Plateau (South East Benin), Agrimey, Dan, Atchérigbé at the Center part of the country in the Department of Zou, and Agoua forest in the Department of Collines (Center northern part of Benin) are globally predicted to be suitable for the distribution of the species. The remaining protected areas, particularly those of the North of the country are predicted to be unsuitable for the distribution of the species. Under rcp 8.5 at the same horizon of 2055 (Figure 11b), only Djigbé, Lama, and Agrimey forests will remain suitable for the distribution of the species.
Consistency of the environmental variables controlling the spatial distribution of D. guineense with regards to the ecology of the species
D. guineense grows in Sub Saharan Africa (Orwa et al., 2009; Ayessou et al., 2014) in humid dense forests, dry dense forests, and forest galleries (Ewédjè and Tandjiékpon, 2011). In its natural range, the species is submitted to a temperature ranging from 25 to 32°C and a mean annual rainfall of 900 to 3000 mm (Ewédjè and Tandjiékpon, 2011). In dry zones, its occurrence is under Africlim RCP8.5, horizon 2055: a) across the Landscape of Interest; b) across Benin.always linked to waterways and swampy zones. Our findings are therefore reliable with regards to the ecology of the species. Indeed, the annual precipitation (bio 12) and its seasonality (bio 15) are among the most contributing variables to the prediction model of the spatial distribution of the species. Precipitation seasonality (bio 15) is a measure of the variation in monthly precipitations over the course of the year (O’Donnell and Ignizio, 2012).
Our results showed that the highest probabilities (>0.5) for the presence of the species are obtained between 15 and 40% of bio 15 avoiding then the extreme variations of precipitation. Water has many functions in the plants and is found to impact the distribution patterns of species at finer scales (Willis and Whittaker, 2002) as compared to global scales. It is a solvent for mineral nutrients and the complex organic matters produced within the plant; it also acts as a temperature regulator during the process of plant transpiration and serves as raw material in the process of photosynthesis which is the basic process underlying all life (Ferguson, 1959). Plants can be stressed by lack of moisture as well as an excess of moisture (Haferkamp, 1987). Because of those important functions, the presence of water in the environment of plants is quite important.
It is therefore understandable that large variations in water supply, that is high values (> 40) of bio 15, can limit the growth and therefore the presence and extension of D. guineense. Our results are supported by many others. Indeed, high values of bio 15 can be associated with drought or water deficit. Drought is the most significant environmental stress in agriculture worldwide. Drought induces water deficit that is known to be harmful for plants and cause among others, a decline in stem elongation, reduction in photosynthetic performance and then reduce plant growth, development, survival and productivity (Boyer, 1982; Cattivelli et al., 2008; Ings et al., 2013). Although D. guineense is found in dry areas (Sudanian Sahelian regions) along waterways or in swampy areas, in its natural range (Guinean regions), the species grows on well drained soils and is alternatively submitted to dry and rainy seasons. Low values of bio 15 (<5%) are associated with little variation in water supply.
We can therefore understand that in the natural range of D. guineense, constant water supply or little water supply variation (low values of bio 15 (<5%)) can affect the species’ physiology and therefore limit the presence of a non-hydrophilic or non- hygrophilous plant species like D. guineense. Although annual mean temperature (bio 1) was not among the most important contributors to the distribution model of D. guineense, its variations in terms of isothermality (bio 3) and temperature seasonality (bio 4) proved to significantly control the spatial distribution of the species. It is useful to underline here that the rate of plant growth and development is controlled by its surrounding temperature and each plant has a specific temperature range characterized by a minimum, maximum and optimum (Hatfield and Prueger, 2015). Isothermality (bio 3) quantifies how large the day to night temperatures oscillate relative to annual oscillations (O’Donnell and Ignizio, 2012) and the highest probabilities (>0.5) of our modeled species’ presence was achieved with values of bio 3 between 65 to 75% (mean to high values of the parameter).
The temperature seasonality (bio 4) is the amount of temperature variation over a given year based on the standard deviation of monthly temperature averages (O’Donnell and Ignizio, 2012). The highest probabilities (>0.5) of our species’ presence was achieved with values of bio 4 between 5 to 15% (small variations of temperature). According to Hatfield and Prueger (2015), vegetative development increases as temperature rises to the species optimum level and for most plant species vegetative development usually has a higher optimum rate than for the reproductive development. In light of their findings we can understand that large variations of temperature (high value of bio 4) can affect the optimum temperature of D. guineense and then impact its distribution and development both at vegetative and reproductive phases.
We therefore deduce that the maximum value of bio 4 beyond which the distribution of D. guineense can be negatively impacted is 15%. The rate of daily temperature variation relative to the annual oscillation (bio 3) must be less relevant for plant growth and development than temperature variation along the year (bio 4) and this can explain the relative tolerance of D. guineense displaying its maximum presence probabilities between 65 to 75% (mean to high values) of bio 3. The generalization of a model depends on the choice of the variables used to run it (Elith et al., 2011). In our case, the variables bio 3 and bio 4 measured availability and variability of light and heat to the species while bio 12 and bio 15 measured respectively the availability and variability of water for D. guineense. As those variables controlling the spatial distribution of the species are fundamental primary conditions, our model can be generalized to regions outside the study areas and serve the purpose of species management in such regions (Elith et al., 2011).
Impact of climate change on the distribution of the species with regards to the decision thresholds
As pointed out by Pearson et al. (2007), we understand that niche modeling to estimate the impact of climate change on species depends both on environmental factors taken into account when building the models and the thresholds used to interpret the outputs. The outputs must therefore be interpreted with caution. At the threshold of minimum training presence, the impact of climate change on D. guineense is at its minimal since more than 70% of our LOI and more than 90% of Benin will remain suitable for the distribution of the species under rcp 4.5 and 8.5 at horizon 2055. In contrast, when we considered the least conservative option at the threshold of maximum training sensitivity plus specificity, the suitable area for the distribution of the species sharply decreased to 17 and 34% respectively in the LOI and in Benin under rcp 4.5 and to 11 and 15% respectively in the LOI and in Benin under rcp 8.5. Our findings therefore confirmed that the choice of decision thresholds greatly matters. When we considered the impact of climate change on other species, we found that Lantana camara is projected to cover 65% of the Pendjari Biosphere reserve in Benin and about 6% of the W National Park (Fandohan et al., 2015). As this projection will remain so in the future (Fandohan et al., 2015), under rcp 8.5 and at the liberal threshold of maximum training sensitivity plus specificity, D. guineense will be more threatened by climate change than Lantana camara at least in the northern protected areas of the country. Likewise, the seven species studied by Adjahossou et al. (2016), Afzelia Africana, Prosopis africana, Khaya senegalensis, Detarium microcarpum, Anogeissus leiocarpa, Burkea Africana, and Daniellia oliveri, are predicted to have globally suitable areas for their cultivation and conservation in North Benin at the threshold of 10 percentile training presence. Therefore they appear to be less threatened than D. guineense in the North of the country at the liberal threshold of maximum training sensitivity plus specificity under rcp 8.5 horizons 2055. Furthermore, under the threshold of minimum training presence, Dialium guineense will be less threatened than Lonchocaprus serinaceus and Anogeissus leiocarpa across Benin (Gbètoho et al., 2017) both under rcp 4.5 and rcp 8.5 horizons 2055. In contrast however, under the threshold of maximum training sensitivity plus specificity, D. guineense will be more threatened than Lonchocaprus serinaceus and Anogeissus leiocarpa across Benin under both scenarios at horizon 2055 (Gbètoho et al., 2017). The advantage of the threshold of minimum training presence, the most conservative option, is that it has a direct ecological interpretation, in identifying sites that are at least as suitable as those where a species’ presence has been recorded (Pearson et al., 2007). In contrast, the threshold of maximum training sensitivity plus specificity is a more liberal, yet least conservative but most likely presence option. This latter threshold, as shown by our results, is less explorative and therefore less appropriate to identify the maximum of the potential areas of the distribution of the species. As MaxEnt is known to have a high predictive ability (Pearson et al., 2007) we inferred that our results at the threshold of minimum training presence showed the largest potential spatial distribution of the species in the future.
Considerations on the strategies of the conservation and sustainable use of D. guineense
In our model building, we considered only environmental factors. Doing so has some limitations and uncertainty (Abrahms, 2017) in predicting species distribution. Indeed, ecological niche models predict the environmental space that corresponds to the fundamental niche of the species (Soberón and Peterson, 2005). It can yield both false positives and false negatives in the presence of the species in the predicted geographic areas (Thuiller et al., 2005). False positives occur when other factors than climate control the distribution of the species and prevent it from growing in the potential area considered (Thuiller et al., 2005; Blach-Overgaard et al., 2010), whereas false negatives appear when lack of information in the background sample or incomplete sampling efforts prevent from accurately predicting the presence of the species. Implicitly, those other factors not associated with climate, can be related to biotic interactions and accessibility (that is dispersal capacity) of the species to reach geographic areas presenting conditions of its fundamental niche (Soberon and Peterson, 2005) and thus impacting the distribution of the species although it is well known that at very broad continental and global scales, climate is the most important factor to predict the distribution of species (Woodward, 1987; Willis and Whittaker, 2002; Thuiler et al., 2005; Blach-Overgaard et al., 2010).
Another factor to be considered is human pressure as a consequence of demography explosion. For decades, Benin is losing about 50,000 ha of forest every year (FAO, 2015) due to human pressure and therefore the depletion of D. guineense, a multipurpose species, from its suitable areas is common at least in the South of the country. This contributes to increase the false positives in the prediction of our models. Therefore, our results under both scenarios illustrated the possible distribution of the species from an optimistic and explorative option at the threshold of minimum training presence to a more pessimistic, yet more likely presence but least explorative option at the threshold of maximum training presence plus specificity. We agree here with Pearson et al. (2007) that the choice of a decision threshold should depend on proposed application of the models. In order to conserve D. guineense with respect to the impacts of climate change, we recommend a more conservative and explorative option that consists in considering the distribution of species under both scenarios but at the threshold of minimum training presence. Some actions can therefore be undertaken.
First, we recommend a field inventory in the predicted suitable areas of the species to find out where the species is actually absent or present at low densities (for example less than 10 trees / ha). Second, we recommend that forest administration and its related offices grow the species in nurseries and introduce it in the areas previously identified as of low densities or absence of the species; in such areas, after planting, tending operations (weeding, liana cuttings, thinning…) should be carried out by forest administration to ensure the survival of D. guineense along the successional stages of the vegetation growth. Third, because the species is well appreciated by populations and to lighten pressure on it, we recommend capacity building of populations to raise their ability in growing the species in nurseries, and in planting and tending operations on the field or home gardens. Fourth and more globally, forest administration can organize workshops to raise the awareness of populations on the issues of threats to biodiversity and the adequate behaviors compatible with its conservation. Fifth, we also recommend an adaptive approach to the conservation of the species (Williams and Brown, 2012) that will consist in evaluating in the coming future possible new trends in the evolution of its population’s traits (densities, regeneration processes, survival, growth through developmental stages of vegetation) and the environmental or non-environmental factors involved in such evolution so as to develop new strategies and actions to a more effective conservation of the species with time.
Our study revealed that, consistent with its ecology, the spatial distribution of D. guineense, a Guinean species is controlled by four environmental variables bio3 (isothermality), bio4 (temperature seasonality), bio12 (annual precipitation), and bio15 (precipitation seasonality). At present the prediction of suitable area of the species in West Africa is higher southwards, mostly limited to coastal zones with however some gaps of occurrence all over its spatial distribution. Climate will impact the spatial distribution of the species because the suitability prediction will progressively decrease in most of the countries of our study area under both scenarios with a maximum decay under rcp 8 .5. We need therefore to apply adaptive strategies to conserve the species. We then suggest that the species be planted in the predicted suitable areas to account for insufficient existing densities or absence of the species. Populations should also be trained so as to be capacitated to grow, plant and carry out tending operations on the species. As future investigation, since a species does not grow alone on the field, it will be useful to find out, how plant communities including D. guineense can be resilient to the climate and global changes in the future.
The authors declare that they have no conflict of interest.
REFERENCES
|
Abrahms B, DiPietro D, Grafï¬s A, Hollander A (2017). Managing biodiversity under climate change: challenges, frameworks, and tools for adaptation. Biodivers Conserv. pp.1-17.
Crossref
|
|
|
|
Adjahossou SGC, Gouwakinnou NG, Houehanou DT, Sode AI, Yaoitcha AS, Houinato MRB, Sinsin B (2016). Efficacité des aires protégées dans la conservation d'habitats favorables prioritaires de ligneux de valeur au Bénin. Bois et Forêts des Tropiques 328(2):67-76.
|
|
|
|
|
Allouche O, Tsoar A, Kadmon R (2006). Assessing the accuracy of species distribution models: prevalence, kappa and the true skill statistic (TSS). J. Appl. Ecol. 43:1223-1232.
Crossref
|
|
|
|
|
Assongba YF, Djègo GJ, Sinsin B (2013). Distribution des habitats de Dialium guineense (willd) (Fabaceae: Caesalpinioideae) dans les phytodistricts Est du Sud-Bénin. Bulletin scientifique de l'Institut national pour l'environnement et la conservation de la nature 12:1-16.
|
|
|
|
|
Ayessou NC, Ndiaye C, Cisse M, Gueye M, Sakho M, Dornier M (2014). Nutritional potential of wild fruit Dialium guineense. J. Food Composition Anal. 34(2):186-191.
Crossref
|
|
|
|
|
Barve N, Barve V, Jiménez-Valverde A, Lira-Noriega A, Maher PS, Peterson AT, Soberón J, Villalobos F (2011). The crucial role of the accessible area in ecological niche modeling and species distribution modeling. Ecol. Model. 222:1810-1819.
Crossref
|
|
|
|
|
Bentz BJ, Régnière J, Fettig CJ, Hansen EM, Hayes JL, Hicke JA, Kelsey RG, Negrón JF, Seybold SJ (2010). Climate change and bark beetles of the Western United States and Canada: direct and indirect effects. Bioscience 60:602-613.
Crossref
|
|
|
|
|
Boko MI, Niang A, Nyong C, Vogel A, Githeko M, Medany B, Osman-Elasha R, Tabo, Yanda P (2007). Africa. Climate Change 2007: Impacts, Adaptation and Vulnerability. Contribution of Working Group II to the Fourth Assessment Report of the Intergovernmental Panel on Climate Change, Parry ML, Canziani OF, Palutikof JP, van der Linden PJ, Hanson CE, Eds, Cambridge University Press, Cambridge UK, pp. 433-467.
|
|
|
|
|
Boyer JS (1982). Plant productivity and environment. Science 218:443448.
Crossref
|
|
|
|
|
Cattivelli L, Rizza F, Badeck FW, Mazzucotelli E, Mastrangelo AM, Francia E, Marè C, Tondelli A, Stanca, AM (2008). Drought tolerance improvement in crop plants: an integrated view from breeding to genomics. Field Crops Res. 105(1-2):1-14.
Crossref
|
|
|
|
|
CBD (2011). Considerations for Implementing International Standards and Codes of Conduct in National Invasive Species. Strategies and Plans. CBD
|
|
|
|
|
David AA, Olaniyi AT, Mayowa AO, Olayinka AA, Anthony OI (2011). Anti-vibro and preliminary phytochemical characteristics of crude methanolic extracts of the leaves of Dialium guineense (Willd). J. Med. Plants Res. 5(11):2398-2404.
|
|
|
|
|
Elith J, Graham HC (2009). Do they? How do they? WHY do they differ? On ï¬nding reasons for differing performances of species distribution models. Ecography 32:66-77.
Crossref
|
|
|
|
|
Elith J, Phillips SJ, Hastie T, Dudik R, Chee YE, Yates CJ (2011). A statistical Explanation of MaxEnt for ecologists. Diversity and Distributions 17:43-57.
Crossref
|
|
|
|
|
Fandohan AB, Koko IKED, Avocevou-Ayisso C, Gouwakinnou GN, Savi MK, Assogbadjo AE, Kakai RG (2015). Lantana camara (verbenaceae): a potential threat to the effectiveness of protected areas to conserve flora and fauna in Benin. Agron. Afr. 27(2):115-126.
|
|
|
|
|
Ferguson HM (1959). The Role of Water in plant growth. In: Musser HB. (ed) Turf Management. USGA, 40 East 38th Street, New York 16, N. Y.
|
|
|
|
|
Gbètoho AJ, Aoudji KNA, Roxburgh L, Ganglo CJ (2017). Assessing pioneer species' suitabilities for Benin's secondary forest restoration in the context of global climate change. Bois et Forêts des Tropiques 332(2):43-55.
|
|
|
|
|
Haferkamp MR (1987). Environmental factors affecting plant productivity. In: White RS, Short RE (Eds) Achieving efficient use of rangeland resources. Montana Agricultural Experiment Station.
|
|
|
|
|
Hatfield JL, Prueger JH (2015). Temperature extremes: Effect on plant growth and development. Weather and Climate Extremes 10:4-10.
Crossref
|
|
|
|
|
Hijmans RJ, Cameron SE, Parra JL, Jones PG, Jarvis A (2005). Very high resolution interpolated climate surfaces for global land areas. Int. J. Climatol. 25:1965-1978.
Crossref
|
|
|
|
|
Idohou R, Assogbadjo EA, Glèlè Kakaï R Peterson AT (2016). Spatio-temporal dynamic of suitable areas for species conservation in West Africa: eight economically important wild palms under present and future climates. Agrofor. Syst. 91(3):527-540.
Crossref
|
|
|
|
|
Ings J, Mur LAJ, Robson RHP, Bosch M (2013). Physiological and growth responses to water deï¬cit in the bioenergy crop Miscanthus x giganteus. Front. Plant Sci. 4:12.
Crossref
|
|
|
|
|
IPCC (2007). Climate Change 2007: Impacts, Adaptation and Vulnerability. Contribution of Working Group II to the Fourth Assessment Report of the Intergovernmental Panel on Climate Change, Parry ML, Canziani OF, Palutikof JP, van der Linden PJ, Hanson CE (Eds) Cambridge University Press, Cambridge, UK
|
|
|
|
|
IPCC (2013). Climate Change 2013: The Physical Science Basis. Contribution of Working Group I to the Fifth Assessment Report of the Intergovernmental Panel on Climate Change. Stocker TF, Qin D, Plattner GK, Tignor M, Allen SK, Boschung J, Nauels A, Xia Y, Bex V, Midgley PM (eds.) Cambridge University Press, Cambridge, United Kingdom and New York, NY, USA
|
|
|
|
|
IPCC (2014). Climate Change 2014: Impacts, Adaptation, and Vulnerability. Summaries, Frequently Asked Questions, and Cross-Chapter Boxes. A Contribution of Working Group II to the Fifth Assessment Report of the Intergovernmental Panel on Climate Change. Field CB, Barros VR, Dokken DJ, Mach KJ, Mastrandrea MD, Bilir TE, Chatterjee M, Ebi KL, Estrada YO, Genova RC, Girma B, Kissel ES, Levy AN, MacCracken S, Mastrandrea PR, White LL (eds) World Meteorological Organization, Geneva, Switzerland.
|
|
|
|
|
Millennium Ecosystem Assessment (MA) (2005). Ecosystems and Human Well-Being: Synthesis. Island Press, Washington.
|
|
|
|
|
O'Donnell MS, Ignizio DA (2012). Bioclimatic predictors for supporting ecological applications in the conterminous United States: U.S. Geological Survey Data Series 691
|
|
|
|
|
Ogu GI, Amiebenomo R (2012). Phytochemical analysis and in vivo antidiarrhoeal potentials of Dialium guineense Willd stem bark extract. J. Intercult. Ethnopharmacol, 1(2):105-110.
Crossref
|
|
|
|
|
Ogu GI, Ezeadila J, Ehiobu M (2013). Antioxidant and antimicrobial activities of Dialium guineense (Willd) leaf extract. Pharmacy and Pharmacology Research 1(1): 1-7
|
|
|
|
|
Orwa C, Mutua A, Kindt R, Jamnadass R, Anthony S (2009). Agroforestree Database: a tree reference and selection guide version 4.0
|
|
|
|
|
Pearce LJ, Boyce SM (2006). Modeling distribution and abundance with presence-only Data. J. Appl. Ecol. 43:405-412.
Crossref
|
|
|
|
|
Pearson GR, Raxworthy JC, Nakamura M, Peterson AT (2007). Predicting species distributions from small numbers of occurrence records: a test case using cryptic geckos in Madagascar. J. Biogeogr. 34:102-117.
Crossref
|
|
|
|
|
Peterson AT, PapeÅŸ M, Soberón J (2008). Rethinking receiver operating characteristic analysis applications in ecological niche modeling. Ecol. Model. 213:6372.
Crossref
|
|
|
|
|
Peterson AT, Soberón J, Pearson RG, Anderson RP, Nakamura M, Martinez-Meyer E, Araújo MB (2011). Ecological niches and geographical distributions. Princeton University Press, Princeton, New Jersey, USA.
|
|
|
|
|
Phillips S (2010). A Brief Tutorial on Maxent. Network of Conservation Educators and Practitioners, Center for Biodiversity and Conservation, American Museum of Natural History. Lessons in Conservation 3:108-135.
|
|
|
|
|
Phillips SJ, Anderson RP, Schapire RE (2006). Maximum entropy modeling of species geographic distributions. Ecol. Model. 190:231259.
Crossref
|
|
|
|
|
Phillips SJ, Dudik M, Elith J, Graham CH, Lehmann A, Leathwick J, Ferrier S (2009). Sample selection bias and presence-only distribution models: implications for background and pseudo-absence data. Ecol. Appl. 19(1):181-197.
Crossref
|
|
|
|
|
Platts JPh, Peter A, Omeny PA, Marchant R (2014). Africlim: high-resolution climate projections for ecological applications in Africa. Afr. J. Ecol. 53:103-108.
Crossref
|
|
|
|
|
Segurado P, Araújo MB (2004). An evaluation of methods for modelling species distributions. J. Biogeogr. 31:1555-1568.
Crossref
|
|
|
|
|
Åževik H (2012). Variation in seedling morphology of Turkish fir (Abies nordmanniana subsp. bornmulleriana Mattf). Afr. J. Biotechnol. 11(23):6389-6395.
|
|
|
|
|
Åževik H, Yahyaoglu Z, Turna I (2012). Determination of Genetic Variation Between Populations of Abies nordmanniana subsp. bornmulleriana Mattf According to some Seed Characteristics, Genetic Diversity. In: Mahmut Caliskan (Ed.), Genetic Diversity in Plants, InTech, pp. 231-248.
Crossref
|
|
|
|
|
Åževik H, TopaçoÄŸlu O (2015). Variation and Inheritance Pattern in Cone and Seed Characteristics of Scots pine (Pinus sylvestris L.) for Evaluation of Genetic Diversity. J. Environ. Biol. 36(5):1125-1130.
|
|
|
|
|
Soberón J, Peterson AT (2005). Interpretation of models of fundamental ecological niches and species' distributional areas. Biodivers. Inform. 2:1-10.
Crossref
|
|
|
|
|
Soberón J, Nakamura M (2009). Niches and distributional areas: Concepts, methods, and assumptions. PNAS 106:19644-19650.
Crossref
|
|
|
|
|
Stockwell RBD, Peterson AT (2001). Effects of sample size on accuracy of species distribution models. Ecol. Model. 148:1-13.
Crossref
|
|
|
|
|
Thuiller W, Richardson DM, Pysek P Midgley GF, Greg OK, Hughes RO, Rouget M (2005). Niche-based modelling as a tool for predicting the risk of alien plant invasions at a global scale. Glob. Chang. Biol. 11:2234-2250.
Crossref
|
|
|
|
|
Van Vuuren DP, Stehfest E, den Elzen MGJ, Kram T, van Vliet J, Deetman S, Isaac M, Goldewijk KK Hof A, Beltran AM, Oostenrijk R, van Ruijven B (2011). RCP2.6: exploring the possibility to keep global mean temperature increase below 2°C. Clim. Chang. 109:95-116.
Crossref
|
|
|
|
|
Williams BK, Brown ED (2012). Adaptive Management: The U.S. Department of the Interior Applications Guide. Adaptive Management Working Group, U.S. Department of the Interior, Washington, DC
|
|
|
|
|
Willis KJ, Whittaker RJ (2002). Species Diversity - Scale Matters. Science 295(5558):1245-1248.
Crossref
|
|
|
|
|
Yigit N, Åževik H, Cetin M, Gul L (2016). Clonal Variation in Chemical Wood Characteristics in Hanönü (Kastamonu) Günlüburun Black Pine (Pinus nigra Arnold. subsp. pallasiana (Lamb.) Holmboe) Seed Orchard. J. Sustain. For. 35(7):515-526.
Crossref
|
|