Full Length Research Paper
ABSTRACT
Maternal nutrition is a well documented determinant of pregnancy outcome. Maternal anthropometry has been shown to be a predictor of the occurrence or otherwise of low birth weight, foetal macrosomia, increased maternal and newborn morbidity and mortality. Rural-urban differences in nutritional status have been documented in literature. A cross-sectional comparative study of the anthropometric indices of 720 pregnant women accessing antenatal care at selected rural and urban primary health centres in Ogun State, Nigeria was carried out, using semi-structured, interviewer-administered questionnaires, adult weighing scales, a stadiometre and measuring tapes. The mean height, weight, and body mass index of rural participants were higher than those of urban participants, although the difference was not significant (p > 0.05) for these parameters. The mean mid-upper arm circumference value for urban participants was significantly higher (p = 0.014) than that of the rural participants. Community-level nutritional interventions, including adequate feeding of the girl child, will help to improve maternal nutrition in developing countries.
Key words: Maternal, anthropometry, pregnant, rural, urban.
INTRODUCTION
Malnutrition is a major public health concern in many developing countries, particularly for women and children, being responsible for a significant proportion of morbidity and mortality in the affected countries (Farugue et al., 2008). Studies have shown that women from low socio-economic status households are most affected by mal-nutrition, and their children are also not spared (Edilberto, 1997; Teller and Yimmer, 2000; Getaneh et al., 1998; Genebo et al., 1998). Increased perinatal and neonatal mortality, a higher risk of low birth weight babies, still births and miscarriage, are some of the well documented conse-quences of maternal under-nutrition (Hernandez-Julian et al., 2011; Henriksen, 2006; Scott and Duncan, 2000).
Studies from low income countries corroborate the association between maternal under-nutrition prior to and during pregnancy as well as high rates of low birth weight and stillbirths (Scott et al., 1997; Lartey, 2008). Women in developing countries have been shown to gain the least weight during pregnancy and have the lowest birth weight infants, when compared with counterparts from developed countries (Scott et al., 1997; Durnin, 1987).
Poor nutrition in pregnancy, in combination with infections, aggravates maternal and infant morbidity and mortality, particularly among the poor and underserved in rural areas and urban slums (Pena and Becalao, 2002). Many sub-Saharan African countries, like others in Latin America and south Asia, have a high prevalence of malnourished children and women of reproductive age. In some of these countries, particularly in Africa and Latin America, childhood under-nutrition, as evidenced by stunting, coexists with both maternal overweight and under-nutrition (Garrett and Ruel, 2005).
A study in rural India showed that 23.3% of all pregnant women studied had a body mass index (BMI) less than 18.5 kg m-2. An average weight gain of 6.6 kg was recorded for all the pregnant women studied. Inadequate dietary intake was found in 29.5% of the women studied (Saxena et al., 2000). A cohort of 5,564 pregnant women attending a public antenatal clinic was assessed for malnutrition, using height and body mass index. The prevalence of underweight was 5.7%, overweight 19.2% and obesity 5.5%. Overweight nutritional status (obesity and pre-obesity) was seen in 25% of adult pregnant women and was associated with increased risk for gestational diabetes, macrosomia, hypertensive disorders and renal problems (Nucci et al., 2001). The prevalence of underweight among pregnant women was assessed in Western Kenya, using BMI, in addition to mid-upper arm circumference. Different cut off points were used for the first (BMI >18.5 kg/m2) and second trimesters (BMI > 20.2 kg/m2) of pregnancy (van Ejik et al., 2008).
A study of the predisposing factors of protein – energy malnutrition (PEM) among pregnant women in a Nigerian Igbo community measured the weight, height and body mass index of the 1,387 study participants. The weight and height of the 477 rural women were significantly lower (p < 0.0001) than those of the 910 urban women. The mean BMI of rural subjects (25.28 ± 4.60 kg/m2) was significantly lower (p < 0.0027) than that (26.41 ± 3.36) of the urban subjects. Pregnant women aged 24 years and below had significantly lower (p < 0.0001) mean BMI and a higher prevalence of PEM (Okwu et al., 2007). Ugwa (2014) in a prospective study of maternal anthropometry as a determinant of birth weight in Northwest Nigeria reported a significant association between birth weight and maternal body mass index and weight. The mean maternal weight was 72.05 ± 11 kg; maternal height was 1.64 ± 0.55 m; while the mean maternal BMI was 27.9 ± 4.3 kg/m2. In Lagos, Southwest Nigeria, Oluwafemi et al. (2013) found mothers of small-for-gestational age babies to have significantly lower anthropometric characteristics than mothers of normal and large-for-gestational age babies, including weight, height and BMI. A mean maternal height of 1.61 ± 0.08 m; mean weight of 72.55 ± 11.01 kg and mean maternal BMI of 27.90 kg/m2 at delivery was reported by Ukegbu et al. (2012) in Umuahia, Abia, southeast Nigeria.
The American College of Obstetricians and Gyneacologists (ACOG) recommended that BMI be recorded for all women at the initial prenatal visit. Information concerning the maternal and foetal risks of an elevated BMI in pregnancy should also be provided (ACOG, 2005). Maternal morbid obesity, particularly in early pregnancy, is strongly associated with a number of pregnancy complications and peri-natal conditions (Satpathy et al., 2008). Morbidly obese mothers as com-pared with normal-weight mothers had an increased risk of the following outcomes: pre-eclampsia, ante-partum stillbirth, instrumental delivery, shoulder dystocia, meconium aspiration, foetal distress and early neonatal death in studies conducted in Europe (Cedergren, 2004; Grossetti et al., 2004).
Maternal mid-upper arm circumference (MUAC) has been used as a potential indicator of maternal nutritional status. Ricaldo et al. (1998) studied 92 pregnant women who were followed through at the prenatal service of a hospital in Sao Paulo, Brazil, showing significant asso-ciation between gestational age and newborn variables. Maternal MUAC and pre-pregnancy weight were found to be positively correlated to birth weight. The authors concluded that MUAC could be used in association with other anthropometric measurements, instead of pre-pregnancy weight, as an alternative indicator to assess women at risk of poor pregnancy outcome.
The effect of maternal nutritional status on pregnancy outcome was studied in Sudan. This descriptive study involved 1000 Sudanese mothers and their singleton babies. The birth weight of newborns was measured in addition to maternal anthropometric indices, including weight, height and MUAC. Maternal age and all maternal anthropometric measurements were positively correlated (p < 0.01) with birth weight. A maternal height of less than 156 cm; a weight of less than 66 kg; a maternal MUAC of less than 27 cm and years of education of less than or equal to 8 years, were found to increase the relative risk of low birth weight (Elshibly and Schmalisch, 2008). A similar study carried out in Sudan, investigated the re-lationship between maternal and newborn anthropometry, utilizing multiple regression and multivariate analysis. Maternal anthropometry was found to be significantly associated with newborn anthropometry. The strongest associations were found for maternal MUAC, supine length and birth weight (Elshibly and Schmalisch, 2009).
No study has been carried out on maternal anthropo-metric indices in Ogun State, Nigeria. This study therefore assessed and compared anthropometric indices of pregnant women accessing antenatal care at rural and urban primary health centres in Ogun State, Nigeria, as a means of determining their nutritional status.
METHODOLOGY
A cross-sectional comparative study was carried out among 720 pregnant women at selected Primary Health Centres in rural and urban areas of Ogun state, between 4th December, 2012 and 6th May, 2013. Only women aged between 18 and 49 years, in the first and second trimesters of pregnancy and fully resident in the study locations were allowed to participate. Using a formula for the comparison of two independent proportions, the calculated sample size (N) was rounded up to 360 per group. A total of 720 pregnant women were studied in all. The sampling technique used in this study was multi-stage sampling. The first stage involved the selection of a senatorial district/zone, from the three zones present in the state, by simple random sampling. Ogun - East senatorial district was selected. The second stage involved the selection of one rural and one urban LGA, by simple random sampling. Sagamu LGA was selected as the urban study location, while Remo-North LGA was selected as the rural study location, by simple random sampling. The third stage of sampling involved the selection of two wards, from each of the selected LGAs, by simple random sampling. In Remo-North LGA, wards 7 and 9 were selected from the 15 existing wards, by simple random sampling (balloting).
In Sagamu LGA, wards 5 and 8 were also selected. The Primary health cares (PHCs) located within the selected wards, constituted the study sites, making a total of four primary health facilities. All consenting pregnant women, who met the inclusion criteria, were recruited into the study consecutively till the required sample size was reached. A semi-structured, interviewer-administered questionnaire was used to collect information on respondents’ socio-demographic profile. The semi-structured, interviewer-administered questionnaire was translated into the local language (Yoruba) and back into English, to ensure clarity, standard and uniformity. It was pretested in Ikenne and Ijebu-Ode LGAs, which are similar to the study locations in Ogun-East senatorial district.
Five research assistants were trained over a period of two days prior to commencement of the study. They were undergraduate students of Olabisi Onabanjo University and neighbouring tertiary institutions. An adult weighing scale was used to measure participants’ body weight, to the nearest 0.1 kg. Study participants had only light clothing on, with no shoes, keys, phones or anything that added to the weight being recorded. After each recording, the weighing scale was checked and reset at the zero point, in order to ensure accuracy of the measurements taken (James et al., 1998). A stadiometer was used to measure participant’s height to the nearest 0.01 m. Participants were required to remove their shoes, head ties and any other thing that may distort the measurement of their height. With the two feet placed together and the women standing fully erect, with both hands placed by the side and the head at 90 degrees to the rest of the body, the participants’ heights were measured using the stadiometer in the Frankfurt plane (Zerihun et al., 1997). Respondents’ body mass index was classified according to World Health Organization (WHO) criteria, similar to previously published research works (Nucci et al., 2001; Crane et al., 2009).
Mid – upper arm circumference (MUAC) was measured using a measuring tape. The mid-point between the acromion process and the olecranon was taken as the site for measurement of the mid-upper arm circumference. This was recorded in centimeters (cm) (Ricaldo et al., 1998; UNICEF, 2009). The adult tape has three colour codes namely: red; yellow and green. MUAC readings below 21 cm are in the red region, signifying severe malnutrition; those between 21 and 23 cm are in the yellow region, showing mild malnutrition or borderline nutritional status. Only measurements from 23 cm and beyond fall into the green – coloured region, signifying a healthy nutritional status.
Data analysis was done using the IBM Statistical Package for the Social Sciences (SPSS) version 14.00. Proportions, means and frequencies were calculated, presented as tables and charts, and compared between the two groups using the appropriate statistical tests. Chi square test was used to test for association between categorical variables, while t test was used for comparison of means. Level of significance was placed at p = 0.05.
Ethical approval was obtained from the Ogun State Primary Health Care Board, Ogun State Ministry of Health, as well as the Health Research and Ethics Committee of Olabisi Onabanjo University Teaching Hospital, Sagamu. Written approval was also sought from the Local Government Health Authorities in Sagamu LGA and Remo-North LGA, through the Medical Officer for Health/Director, Primary Health Care Department. Participants’ informed consent was obtained verbally and by thumb printing, prior to the commencement of the study. Strict confidentiality was ensured throughout the course of the research.
RESULTS
Age of respondents
Women aged 18 to 25 years were 27.2 and 26.4% among rural and urban respondents, respectively. About 52% of rural and 54% of urban respondents were aged between 26 and 33 years; 19.4 and 17.8% of rural and urban respondents were aged between 34 and 41 years, respectively; while 1.7% of rural respondents and 1.9% of urban respondents were aged between 42 and 49 years. There was no significant difference (p = 0.905) between the ages of rural and urban respondents.
Occupation of respondents
Traders constituted 49.2% of rural respondents and 53.3% of urban respondents. Only 10.3% of rural and 9.2% of urban respondents were either housewives or unemployed; 29.0% of rural women were unskilled workers compared with 29.2 of the urban respondents. An equal number (11.3% rural and 10.8% urban) of respondents were Civil servants in both rural and urban study locations. There was no significant difference (p = 0.572) between both groups of respondents.
Source of drinking water
A nearby well was the source of drinking water for 3.0% of rural respondents and 5.3% of urban respondents; 48.0% of rural respondents and 50.0% of urban respondents drank pipe-borne water flowing within their homes. Nearby streams served as a source of drinking water for 3.0% of rural and 1.9% of urban respondents. Public taps and neighbourhood water points served as a source of drinking water for 46.0% of rural respondents and 42.8% of urban respondents. There was no significant difference (p = 0.316) in the source of drinking water between rural and urban respondents.
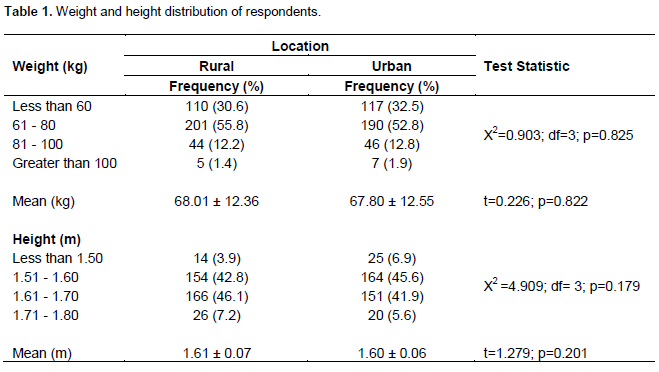
Weight and height distribution of respondents
Most rural participants (55.8%) and their urban counterparts (52.8%) weighed between 61 and 80 kg; 1.4% of rural and 1.9% of urban participants weighed more than 100 kg. The mean weight of rural respondents was 68.01 ± 12.36 kg and that of urban respondents was 67.80 ± 12.55 kg. There was no statistically significant difference (p = 0.822) between both means. A height of less than 1.50 m was found in 3.9% of rural participants, compared with 6.9% of urban participants; 42.8% of rural participants compared with 45.6% of urban respondents had a height measurement between 1.51 and 1.60 m. There was no significant difference (p = 0.179) between the height distributions of rural and urban participants. The mean height of rural respondents was 1.61 ± 0.07 m, while that of urban respondents was 1.60 ± 0.06 m. There was no significant difference (p = 0.201) between both means (Table 1).
Respondents’ body mass index
Women with BMI values less than 18.5 kg/m2 were 1.3% in the rural and 2.8% in the urban areas; 43.9% of rural respondents and 40.0% of urban respondents had a BMI value between 18.5 and 24.9 kg/m2. BMI values between 25.0 and 29.9 kg/m2 were found in 35.6 and 37.8% of rural and urban respondents, respectively. Only 5.6% of rural participants and 6.1% of urban participants had a BMI greater than 35 kg/m2. There was no significant difference (p = 0.616) in BMI, between the rural and urban women studied (Table 2).
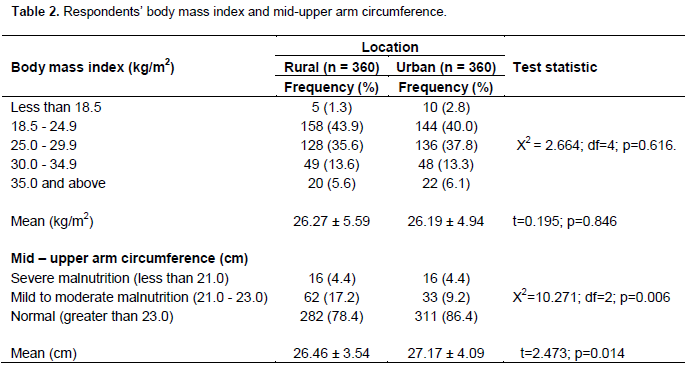
Mid-upper arm circumference of respondents
Most rural participants (78.4%) and their urban counter-parts (86.4%) had normal MUAC readings. 17.2% of rural participants and 9.2% of urban participants had MUAC readings indicative of mild to moderate malnutrition. An equal proportion (4.4%) of respondents was severely malnourished in both rural and urban groups of women. There was a significant difference (p = 0.006) in MUAC readings between rural and urban women. The mean MUAC reading among rural respondents was 26.46 ± 3.54 cm, while that of urban respondents was 27.17 ± 4.09 cm. There was a statistically significant difference (p = 0.014) between both means (Table 2).
DISCUSSION
Over the years, maternal anthropometry has been used as a measure of the nutritional status of pregnant women (Watkins et al., 2003; Mantakas and Farell, 2010; Saxena et al., 2000; Nucci et al., 2001; Crane et al., 2009). It has been considered a predictor of pregnancy outcome over several years (Scott et al., 1997; Lartey, 2008; ACOG, 2005; Nucci et al., 2001; Crane et al., 2009; Cedergren, 2006; Addo, 2010). The mean height of rural respondents was 1.61 ± 0.07 m, while that of urban respondents was 1.60 ± 0.06 m. There was no statistically significant difference between both means (p = 0.201). This is different from findings in a small scale study in Oromiya, where the mean height was 155.5 cm (Zerihun et al., 1997). In this study, only 3.9% of rural and 6.9% of urban women showed evidence of chronic childhood under nutrition, with heights less than 150 cm, which is very much lower than 20% reported in the Oromiya study (Zerihun et al., 1997). The difference could be as a result of a disparity in the nutritional status of the underlying populations of both countries. The mean weight of rural respondents was 68.01 ± 12.36 kg, while that of urban respondents was 67.80 ± 12.55 kg. However, there was no statistically significant difference between both mean values (p = 0.822). This is different from the findings of a previous research in a Nigerian Igbo community in which the weight of rural respondents was significantly lower (p < 0.001) than that of their urban counterparts (Okwu et al., 2007). The weight measurements were mainly used to calculate body mass index values. This is because a single weight measurement in the first or second trimester, without knowledge of the pre-pregnancy weight and serial measurement of same, does not offer adequate information about the magnitude of weight gained in pregnancy by the woman concerned. Therefore, serial weight measurements have been documented in literature, with the aim of determining the adequacy or otherwise of the weight gained in pregnancy (Crane et al., 2009; Cedergren, 2006; Addo, 2010).
The mean BMI values were 26.27 ± 5.59 kg/m2 for rural women and 26.19 ± 4.94 kg/m2 for the urban women. There was no significant difference between both means (p = 0.846). These findings are different from those documented in a study from southeastern Nigeria, in which the mean BMI of rural women was significantly lower (p < 0.003) than that of the urban pregnant women. Also the mean BMI value recorded in that study for the rural women (25.28 ± 4.60 kg/m2) was much lower than the value obtained in our study (Okwu et al., 2007). Only 1.3% of rural women and 2.8% of urban respondents had BMI values less than 18.5 kg/m2, indicative of a sub-optimal nutritional status. Such women have been described as being in a state of chronic energy deficiency (James et al., 1998). These findings are different from those reported from a study of pregnant women in their second trimester, where 5.7% had BMI values less than 18.5 kg/m2 (Nucci et al., 2001).
BMI values between 30 and 34.9 kg/m2 were found in 13.6% of rural and 13.3% of urban study participants. This is higher than the value (5.5%) reported in a previous study (Nucci et al., 2001). BMI values greater than 30 kg/m2 as well as excessive weight in pregnancy are well documented to be associated with negative pregnancy outcomes (Watkins et al., 2003; Crane et al., 2009; Cedergren, 2006; Addo, 2010). Only 5.6% of rural respondents and 6.1% of urban respondents had BMI values greater than or equal to 35 kg/m2, a finding associated with some obstetric risks including gestational diabetes, foetal macrosomia, gestational hypertension, pre-eclampsia, stillbirth, increased likelihood of instrumental delivery and caesarean sections, as well as neonatal metabolic abnormalities (Nucci et al., 2001; Crane et al., 2009; Cedergren, 2004; Satpathy et al., 2008; Grossetti et al., 2004).
According to MUAC readings, severe malnutrition was found in 4.4% of rural and urban respondents. A higher proportion of respondents had MUAC readings indicative of mild malnutrition, with 17.2% of rural respondents and 9.2% of urban respondents falling into this category. However, most rural respondents (78.4%) and their urban counterparts (86.4%) had MUAC readings indicative of a normal nutritional status. The prevalence of malnutrition found in this study using MUAC (21.6% rural; 13.6% urban), is far lower than the 60 and 37% reported by United Nations International Children Education Fund (UNICEF) in Samburu and Marsabit districts of Kenya, respectively (Carter, 2006). It is also lower than the prevalence of 65% reported for malnutrition among preg-nant women in Ghana (Kwapong et al., 2008). There was a significant association (p = 0.006) between location and MUAC readings. There was also a significant difference (p = 0.014) between the mean MUAC values of rural and urban respondents.
Some studies have used maternal MUAC values as indicators of poor pregnancy outcomes; maternal MUAC was also found to be positively correlated with birth weight and other newborn anthropometry (Ricaldo et al., 1998; Elshibly and Schmalisch, 2008; Elshibly and Schmalisch, 2009). Although the mid - upper arm circum-ference tape has been widely acknowledged as a tool for determining the nutritional status of children several years ago, not many studies have documented MUAC as an indicator of nutritional status in adults. UNICEF developed guidelines for the use of MUAC tapes; published the relevant cut off points and supervised the distribution of such in 2009, for the assessment of nutritional status of pregnant women and children. The essential medicines and nutrition unit of UNICEF has been in the forefront of enlightenment and advocacy for its use as a rapid assessment tool in resource-constrained settings as well as in emergency situations (UNICEF, 2009). Although this study did not investigate participants’ pregnancy outcomes due to its cross-sectional design, the MUAC values recorded are representative of the pregnant women’s nutritional status and provide baseline information for more detailed longitudinal studies in the nearest future.
The high burden of malnutrition in Nigeria is well do-cumented in literature, due to a multiplicity of factors, requiring a multi-sectoral response (Ubesie and Ibeziakor, 2012). Many women in sub-Saharan Africa are in a state of chronic energy deficiency. It has been defined as a steady state at which a person is in energy balance at a cost to his or her health (James et al., 1998). Nutrition affects the health economics outcomes at both the individual and the societal levels. An individual’s nutritional choices affect his or health condition, thereby influencing productivity and economic contributions to the household and society at large (Gyles et al., 2012).
CONCLUSION
The mean weight, height and body mass index of rural study participants was higher than those of their urban counterparts, with the exception of the MUAC, which was significantly higher among urban participants. Community level nutritional interventions, including behavior change communication on adequate nutrition from infancy to reproductive age, will have considerable impact on the anthropometric indices of pregnant women in developing countries like Nigeria.
ACKNOWLEDGEMENT
The authors sincerely acknowledge the help rendered by our professional colleagues in making this research work contributory to the body of knowledge in the scientific world. We are particularly grateful to Dr. Albert Salako, Dr. Francis Oluwole, Dr. Olorunfemi Amoran, Dr. Feyisola Abe and Mrs. Taiwo Babalola.
CONFLICT OF INTEREST
The authors have not declared any conflict of interests.
REFERENCES
|
Addo VN (2010). Body Mass Index, weight gain during pregnancy and obstetric outcomes. Ghana Med. J. 44(2):64-69. Pubmed |
||||
|
American College of Obstetricians and Gynecologists (ACOG) (2005). Obesity in pregnancy: ACOG Committee Opinion No. 315. Obstet. Gynecol. 106(3):671-675. Crossref |
||||
| Carter BR (2006). Malnutrition rates among pregnant women in Kenya. New York. United Nations Children's Fund (UNICEF) – Kenya. | ||||
|
Cedergren M (2006). Effects of gestational weight gain and body mass index on obstetric outcome in Sweden. Int. J. Gynaecol. Obstet. 9(3):269-271. Crossref |
||||
|
Cedergren MI (2004). Maternal morbid obesity and the risk of adverse pregnancy outcome. Obstet. Gynecol. 103(2):219-224. Crossref |
||||
| Crane JM, White J, Murphy P, Burrage L, Hutchens D (2009). The effect of gestational weight gain by body mass index on maternal and neonatal outcomes. J. Obstet. Gynaecol. Can. 3(1):28-35. | ||||
|
Durnin JV (1987). Energy requirements of pregnancy: an integration of longitudinal data from the five country study. Lancet 2:1131-1133. Crossref |
||||
| Edilberto L (1997). Maternal nutritional status. DHS Comparative studies, No 24. Calverton, Maryland, USA. Macro International Inc. | ||||
|
Elshibly EM, Schmalisch G (2008). The effect of maternal anthropometric characteristics and social factors on gestational age and birth weight in Sudanese newborn infants. BMC Public Health. 8:244. Crossref |
||||
|
Elshibly EM, Schmalisch G (2009). Relationship between maternal and newborn anthropometric measurements in Sudan. Pediatr. Int. 51(3):325-331. Crossref |
||||
|
Faruque AS, Ahmed AM, Ahmed T, Islam MM, Hossain MI, Roy SK, Alam N, Kabir I, Sack DA (2008). Nutrition: basis for healthy children and mothers in Bangladesh. J. Health Popul. Nutr. 26(3):325-339. Pubmed |
||||
|
Garrett J, Ruel MT (2005). The coexistence of child under-nutrition and maternal overweight: prevalence, hypothesis and programme and policy implications. Matern. Child Nutr. 1(3):185-196. Crossref |
||||
| Genebo T, Girma W, Hardir J, Demmissie T (1998). Factors contributing to positive and negative deviance in child nutrition in Ziggbato, Gueigie Zone, South Ethiopia. Ethiop. J. Health Dev. 12(2):69-73. | ||||
|
Getaneh T, Assefa A, Taddesse Z (1998). Protein – energy malnutrition in urban children: prevalence and determinants. Ethiop. Med. J. 36(3):153-166. Pubmed |
||||
|
Gyles CL, Lenoir-Wijnkoop J, Calberg JG, Senanayale V (2012). Health economics and nutrition: a review of published evidence. Nutr. Rev. 70(12):693-708. Crossref |
||||
|
Grossetti E, Beucher G, Régeasse A, Lamendour N, Herlicoviez M, Dreyfus M (2004). Obstetrical complications of morbid obesity. J. Gynecol. Obstet. Biol. Reprod. (Paris). 33(8):739-744. Crossref |
||||
|
Henriksen T (2006). Nutrition and pregnancy outcome. Nutr. Rev. 64:S19-S23. Crossref |
||||
| Hernandez-Julian R, Mansour H, Peters C (2011). The effects of intra-uterine malnutrition on birth and fertility outcomes: evidence from the 1974 Bangladesh famine. Working Paper. Denver. University of Colorado Press: 29. | ||||
| James WP, Ferro-Luzzi A, Waterloo JC (1998). Definition of chronic energy deficiency in adults: report of working party of the International Dietary Energy Consultative Group. Eur. J. Clin. Nutr. 42(12):969-981. | ||||
|
Kwapong OAT (2008). The health situation of women in Ghana. Rural Remote Health 8:963. Pubmed |
||||
|
Lartey A (2008). Maternal and child nutrition in sub-Saharan Africa: challenges and interventions. Proceed. Nutr. Soc. 67:105-108. Crossref |
||||
|
Mantakas A, Farell T (2010). The influence of increasing BMI in nulliparous women on pregnancy outcome. Eur. J. Obstet. Gynaecol. Reprod. Biol. 153(1):43-46. Crossref |
||||
|
Nucci LB, Schmidt MI, Duncan BB, Fuchs SC, Fleck ET, Santos-Britto MM (2001). Nutritional status of pregnant women: prevalence and associated pregnancy outcomes. Rev. Saude Publica 35(6):502-507. Crossref |
||||
| Okwu GN, Ukoha AI, Nwachukwu N, Agha NC (2007). Studies on the predisposing factors to Protein Energy Malnutrition among pregnant women in a Nigerian community. Online J. Health Allied Sci. 6(3):1-9. | ||||
| Oluwafemi RO, Njokanma OF, Disu EA, Ogunlesi TA (2013). Maternal factors in the aetiology of small-for-gestational age among term Nigerian babies. Niger. J. Paed. 40(2):119-124. | ||||
|
Pena M, Bacalao J (2002). Malnutrition and poverty. Ann. Rev. Nutr. 22:241-253. Crossref |
||||
|
Ricaldo AE, Velasquez-Melendez G, Tanaka AC, de Siqueirre AA (1998). Mid-upper arm circumference in pregnant women and its relation to birth weight. Rev. Saude Publica 32(2):112-117. Crossref |
||||
|
Satpathy HK, Fieming A, Frey D, Barsoom M, Satpathy C, Khandalavada J (2008). Maternal obesity and pregnancy. J. Postgrad. Med. 120(3):E01-09. Crossref |
||||
| Saxena V, Srivastava VK, Idris MZ, Mahan U, Bhushan V (2000). Nutritional status of rural pregnant women. Indian J. Commun. Med. 25(3):104-107. | ||||
|
Scott S, Duncan CJ (2000). Interacting effects of nutrition and social class differentials on infertility and infant mortality in a pre-industrial population. Local Popul. Stud. 54(1):71-87. Crossref |
||||
| Scott S, Duncan SR, Duncan CJ (1997). Critical effects of malnutrition during pregnancy. Local Popul. Stud. 39:62-65. | ||||
| Teller H, Yimmer G (2000). Levels and determinants of malnutrition in adolescent and adult women in southern Ethiopia. Ethiop. J. Health Dev. 14(1):57-66. | ||||
|
Ubesie A, Ibeziakor N (2012). High burden of protein-energy malnutrition in Nigeria: beyond the health care setting. Ann. Med. Health Sci. Res. 2(1):66-69. Crossref |
||||
|
Ugwa EA (2014). Maternal anthropometric characteristics as determinants of birth weight in North-West Nigeria: a prospective study. Niger. J. Basic Clin. Sci. 11:8-12. Crossref |
||||
| Ukegbu PO, Uwaegbute AC, Ijeh II, Anyika JU (2012). Influence of maternal anthropometric measurements and dietary intake on lactation performance in Umuahia urban area, Abia State, Nigeria. Niger. J. Nutr. Sci. 33(2):31-39. | ||||
| United Nations Children's Fund (UNICEF) (2009). Mid-upper arm circumference (MUAC) measuring tapes. Technical Bulletin No. 13. New York. UNICEF. | ||||
|
van Eijk AM, Lindblade KA, Odhiambo F, Peterson E, Sikuku E, Ayisi JG, Ouma P, Rosen DH, Slutsker L (2008). Reproductive health issues in rural Western Kenya. Reprod. Health 5:1. Crossref |
||||
| Watkins ML, Ramussen SA, Honein MA, Botton LD, Moore CA (2003). Maternal obesity and risk for birth defects. Paediatrics 111:1152-1158. | ||||
Copyright © 2024 Author(s) retain the copyright of this article.
This article is published under the terms of the Creative Commons Attribution License 4.0


