Full Length Research Paper
ABSTRACT
The water need of a religious pilgrimage town in South India would typically be much larger than a regular town where religious pilgrims and ritual activities do not add to the water burden of the municipality. To understand this added water burden, a city scale audit was carried out to estimate the water supply, demand and deficit at Guruvayoor, which is a pilgrimage town in South India. Guruvayoor is popularly known for the Sri Krishna Temple which is visited daily by an average of 10,000 devotees. For the entire municipality, 11,117 open wells, including 144 public wells within the municipal area. The study revealed that increased dependency on ground water sources without proper implementation of rainwater harvesting (RWH) facilities demonstrated a potential threat for the water security of the town. Increased water distribution by water tanker trucks, mostly operated by the unorganized private sector, imported 2.5 MLD of water from the outer bounds of the city to meet the commercial and institutional demand. The results of this investigation showed that urban water security will likely be subject to such external water suppliers, suggesting the need for further research to understand the implications of such a distributed water supply panel on urban water security.
Key words: Urban water security, Pilgrimage town, Guruvayoor, water audit, water demand, South India.
INTRODUCTION
Water is one of the essential resources for the existence of life. The requirement of water has essentially increased over a period of time, especially due to explosive population growth, urbanization, and industrialization. In the last century, water use has been growing at more than twice the rate of population increase. It is predicted that the water withdrawals will increase by 50% in developing countries and by 18% in developed countries, and as many as 1.8 billion people will be living in countries or regions with absolute water scarcity, with as much as two-thirds of the world’s population potentially under water-stress conditions (UN-Water, 2015; UNDP, 2006). Water scarcity is fast becoming urban India’s prime one woe (CWMI, 2018). Recent reports suggest that Indian cities are going to face acute water shortages by the year 2050 (WWF, 2020). With increasing population and decreasing per capita availability of water, optimum utilization and conservation of water have become a problem of vital importance in which the water balance plays a crucial role (Sudhishri, 2007). Thus, the development of a water management plan is the critical need of the hour for any urban area in the world. Furthermore, an effective city-wide water management policy is essential for sustainable urban development (KMC, 2015). In order to efficiently and effectively manage this water resource, it is essential that it be quantified through an accurate estimation of the water demand and supply. Fortunately, established water audit methodology can help in scientifically estimating water demand, supply and deficit, not only at an institution level but at the city-wide scale as well (Howley, 2005).
Water Audit’s emerged in the late 1980’s to overcome drought-related water availability problems, water shortages, leakages and losses of water from municipal systems. Water auditing is the practice that focuses on quantifying water usage. It provides the means to develop precision in schemes for water conservation, water use efficiency and water management (Gagnon, 1984). Water audits systematically review and identify opportunities to improve water use efficiency. They also help reduce the misuse and over-use of water, and help make effective water management plans by estimating present water demand, water supply and deficit. Limited attempts were reported previously to conduct water audit at a city scale (Kulkarni et al., 2014; KMC, 2015; Vogel, 2007; Nicholas et al., 2016). Many such water audits have been conducted globally, based on the IWA/AWWA method (Howley, 2005). However, this cannot be directly applied to the water audits in India. Most of the studies reported from India were limited in their scope to water supply system with a focus on estimating non-revenue water.
The present study conducted a city-scale water audit over a period of one year during 2017-2018 to estimate the demand and supply of water at a popular pilgrimage town in South India named Guruvayoor. Though the resident population of the town is about 70,000, pilgrimage tourism produces an annual floating population of 35 million, which has created major water stresses especially for commercial activities. Water forms the central element of religious tourism in india in many ways. Limited water availability, poor water quality or media portrayal of a water crisis can consequently do great harm to the image of tourism destinations (Hall, 2010). Religious tourism creates mass movements of pilgrims and devotees, as well as large congregations at pilgrim centers. Conducting a proper analysis of water requirements in pilgrim centers which receive a continuous large magnitude of visitations gives a clear orientation about how to manage the demand and supply, as well as avoiding the outbreaks of water borne diseases (Shinde, 2007). Analysis of enhanced water demand in areas where tourism exerts a pressure in temporal and spatial scale is of critical importance. Such analysis from both qualitative and quantitative perspectives can assess the current demand of the religious tourism sector, while also identifying future management challenges for this vital resource. Analysis of such regional models can exemplify rare information how water can be utilized efficiently in the development and management of complex destinations (Gössling et.al, 2012). As an outcome of this study, it provides a model for how a city scale water audit could be conducted at a religious tourism destination that will identify the threats to its urban water security.
METHODOLOGY
Study area
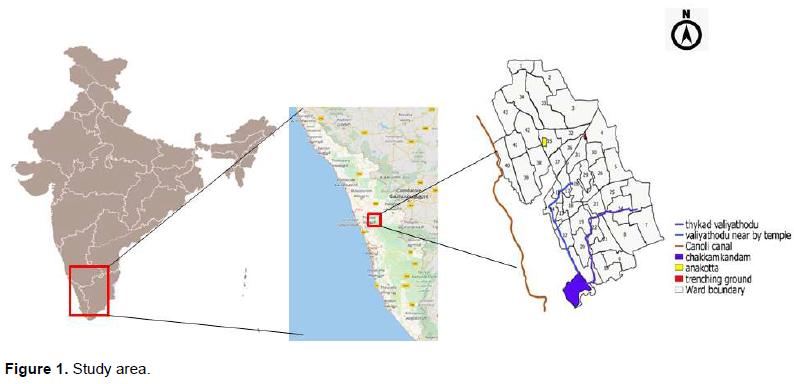
Guruvayoor municipality is situated in the central portion of the Indian state of Kerala, located in Southern Peninsular India between 10.61° N, 76.01° E and 10.58° N, 76.07° E (Figure 1). The municipality is divided into 43 wards with a total area of 29.69 km2. It is situated at a distance of approximately 4 km from the Arabian seashore and at an altitude above Mean Sea Level (MSL) between 3.35 to 7.34 M and receives an annual rainfall of 3155mm. Guruvayur is a temple city, famous for the Lord Sri Krishna temple, which is the fourth largest temple in India based on number of religious pilgrims and devotees visiting on a daily basis. Although Guruvayoor has a residential population of 70,012, religious tourism brings the floating population to around 35 million (Census, 2011).
Data sources and analysis
The water audit methodology followed in this study consisted of three phases: phase I- Data Collection, including identification of water sources and water demand; phase II - data processing and analysis; and phase III – developing possible recommendations. Figure 2 provides a diagrammatic framework for the methodology followed in the present study. Primary as well as secondary data were collected to estimate total water supply as well as demand in the town. A general household survey was conducted in Guruvayur Municipality to gauge the water scenario across the whole municipal area. Among 18,772 households, 2380 households were surveyed, that is, 12.7% of total households. The survey was conducted with the help of an android application called Open Data Kit, which can be installed on an android mobile phone. The locations of the households were geo-tagged. From the household survey, the frequency of Kerala Water Authority (KWA), which is the governmental authority responsible for public water distribution, was analyzed. The efficiency of the existing water distribution network was assessed spatially with the help of geographic information system (GIS) based analysis. The survey also identified and mapped existing urban water bodies, including ponds and wells, their water quality as well as the available water storage capacity in these water sources.

Estimation of water supply
Various water sources and the primary and secondary data collected for each of these sources as part of this study are provided in Table 1. The flow in the KWA distribution lines was verified using ultrasonic flow sensors (NIVUS Model NIC-CO01). To assess ground water availability, a total of 52 wells were sampled out of which 27 were private wells and 25 were public wells. The quality of water, whether potable or not, was done by comparing water quality parameters measured against IS 10500-2012 standards. The water level measured at each well was analyzed using GIS for spatial variations utilizing the Inverse Distance Weighing (IDW) method. In order to assess rainwater harvesting potential in the municipal area, analysis of rainfall data was done based on the data available during the period 2006-2016 at the nearest rain gauge station, which is located at Kunnamkulam. From the rainfall data, potential surface runoff which could be harvested was computed using the rational method as described by Modi (2008). The imported water supply into the town, in the form of tanker truck supply, as well as packaged drinking water, was estimated through semi-structured interviews with the water tanker dealers. A 24-h traffic survey was also carried out to estimate tanker supply into the town, as the data on the number of water supplying tanker trucks entering the city on a daily basis was unavailable in the municipal records.

Estimation of water demand
The total water consumption comprised domestic, commercial and agricultural use. Domestic demand included the water demand for the households in the Municipality. The commercial demand included the water demand of hotels, restaurants, lodges, wedding halls, theatres and other institutions like schools, colleges and railway stations. All major institutions existing in the study area were considered in arriving at the number of consumers to be included under the scope of this study. The overall water demands were calculated based on data collected from household and commercial surveys and from various departments.
Domestic water demand was found out by considering the ward-wise population of the municipality as per the 2011 census data and multiplying it by the per capita water demand obtained from the household water survey. In order to estimate commercial demand, the total number of hotels, restaurants, lodges, wedding halls, and schools in the municipality was calculated from data available at the Revenue Department of the Municipal Office. The daily demand of obtained from the data collected from the Hotel and Restaurants major establishments like hotels, restaurants, and lodges was Association, along with the results of a commercial survey that was also conducted. Data regarding the water demand of the railway station as well as the Guruvayoor temple were directly obtained from the concerned authorities.
The agricultural demand was estimated based on the optimum amount of water required for cultivation of various types of crops that are typically farmed in the study region. The water requirement of different crops and their growing period were taken as per the guidelines of Food and Agricultural Organization (FAO, 2006). The major crops seen in the Municipality were coconut, plantain, and other inter-crops. Data regarding various crops and their cultivated area were obtained from the Municipal office.
Estimation of water deficit
The supply and demand for water was used to estimate the deficit of water with respect to the location as well as the activity within Guruvayoor town.
RESULTS
Estimation of water supply
The primary survey results indicated that only 5% of the households have a Kerala Water Authority water connection. The municipal coverage of the KWA supply was limited; moreover, among those who did have a water connection, only a few had a regular water supply. The study estimated KWA supply to be 1.5 million liters per day (MLD) to meet the demand in Guruvayoor. There were 281 public taps in the municipality out of which only 224 were functioning.
The domestic demand in the town was mostly (89%) met from ground water. Guruvayur municipality had a total of 11,117 open wells including 144 public wells. The open well density of the municipality was 379 wells/km2 which was well above the Kerala State average of 200 wells per sq.km in the coastal region. The net annual groundwater availability in the Chavakkad block, of which Guruvayoor town was a part, was 36.5 MCM with stage of development of 66%. Figure 3 shows the variations in ground water levels in Guruvayoor during the study period and Figure 4 shows the spatial variation in the quality of ground water available for consumption at Guruvayoor. The bad or good demarcation of wells was based on the IS 10500-2012 water quality criteria. About 7% of wards in the municipality reported salinity in ground water.


Analysis of rainfall data showed that the total rainfall across the study area has been declining over the past few years. The average annual rainfall received by the Guruvayoor Municipality was 2355 mm. The number of rainy days varied between 94 and 161, with an average of 122 days. The number of rainy days did not show much fluctuation over the past 10 years. Estimation of runoff available for recharge using the rational method showed that 30 million liter of water are potentially available to be recharged into the aquifer in the region. However, as of now rainwater harvesting is not effectively implemented in the town. If rainwater harvesting was effectively implemented across the municipality, it is likely that the water stress in the Guruvayoor Municipality could be reduced to a good extent.
Twenty-three wards in the municipality depended on tanker trucks for supplying water; these water tanker trucks were majorly used to meet commercial and institutional demand. A total of 2.5 MLD was estimated for tanker truck water supply and 0.08 MLD for packaged drinking water (available either in 1 or 20 liter cans). The existence of packaged water was prevalent in the nearby areas of Guruvayoor temple due to the presence of the large floating population.
Estimation of water demand
(i) Domestic Water Demand: Figure 5 shows the spatial variation in domestic water demand at Guruvayoor. The total domestic water demand in the Municipality was estimated to be 12.5 MLD.
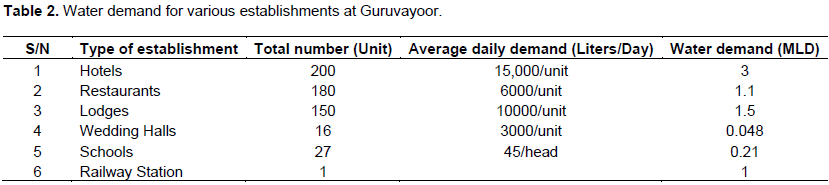
(ii) Commercial/ Institutional Water Demand: The total commercial/institutional water demand was estimated to be 7.2 MLD and the major portion of this demand was by the Hotels, restaurants, and lodges in and around the ward number 18 (Gurupavanapuri) where the Guruvayur temple is located. Table 2 shows water demand for various establishments in the town. Guruvayoor temple which has an average of 10,000 devotees visiting it daily was the major establishment with the highest water demand. As per the data collected from the Guruvayur Dewasom, the water is required for daily needs of the temple and Punnathur Aanakotta (an elephant park) which is situated in ward number 37 (Kotta South). The Punnathoor elephant park at Guruvayoor, which has 54 elephants, required 200,000 L of water daily and the Guruvayoor temple required 200,000 liters of water on an average. The total water demand of Guruvayoor temple therefore came to be 0.4 MLD.
(iii) Agricultural Water Demand: The study estimated that there was about 20.2 km2 of agricultural land within the Guruvayoor municipal area. Paddy (rice) cultivation was very popular in this region in the past. However, at present, there is no paddy cultivation within the municipal area, and thus this high-demand agricultural commodity generates no water demand in the study area. Table 3 shows the agricultural water demand for various crops as estimated at Guruvayoor.


DISCUSSION
The total water demand for the Municipality was found to be 21 MLD out of which 12.5 MLD was from domestic household demand alone. As seen from the data collected and the surveys conducted, the municipality has reduced the amount of area under agriculture. Moreover, the cultivation of water intensive crops such as paddy has essentially ended in the urban municipal space. This has resulted in the agricultural water demand being reduced significantly from historical levels to currently only 1.3 MLD. Commercial water demand has increased as agricultural lands have given way to the establishment of commercial and urban structures, resulting in increased water demand in this area, which was estimated to be 7.2 MLD.
Water supply
The collected data and the results of the surveys have demonstrated that the KWA supply of water is irregular and has limited coverage of the study area. In the net, KWA was only supplying 1.5 MLD, which is a mere 7% of the total demand. This limited and irregular supply was shown to have very limited coverage within the urban space; in addition, many of the pubic taps were found to be points of water misuse and had no accountability. In sum, the current water supply by the KWA has been insufficient to meet the water demand of the municipality. Domestic demand has been met mostly by the ground water supply, as 89% of households had access to either private or public wells. Our data showed that Wards 5 and 7 have suffered a significant drop in groundwater level of more than 1m. This appears mainly due to borewell extractions, which have prevailed in these wards, specifically for water commoditization. Water quality in each of the wells were tested according to standards for 11 parameters, including pH, TDS, EC, Alkalinity, Chloride, Hardness, Coliform, Iron, Nitrate, Sodium and Potassium. Our data showed that 36 out of 52 wells revealed water quality that was in good condition. Another issue that is of significance given the proximity of the sea as well as brackish backwaters, instances of salt water intrusion were also noted; instances were specifically found to prevail in ward 40 near the Canoli canal as well as near the Chakumkandam backwaters. The location of landfill sites also has resulted in contamination in Wards 30, 31, 36, which were found to be affected in the rainsy season by leachates from the nearby landfill sites. Crowded human habitation areas such as informal settlements, encampments, as well as formal housing colonies, revealed fecal coliform in their wells. The two fresh water drains Valiyathodu and Thykadu Valiyathodu, have both become sources of contamination , mostly resulting from the discharge of effluents by hotels, restaurants and lodges from the town. These discharges result in the transport of the polluted effluents all the way to the Chakkumkandam back water area. The surface water bodies in the municipality have also revealed high degrees of pollution, primarily due to direct disposal of wastes into these surface water bodies.
This widespread degradation in quality of ground water, as well as quantity of groundwater available, has resulted in the creation of increased demand for imported water within the town, mostly to meet the demand from commercial establishments. In fact the 2.5 MLD of tanker supply was predominantly directed at commercial establishments in and around ward 18, where the temple is situated. One of the major utilizers of water tanker supply was the Guruvayoor temple. The temple organization has its very own tanker trucks operating regularly in order to meet the daily water demand, which comes to 0.4 MLD. Twenty-three wards, of the fifty-two in the municiplaity depend on tanker water, especially during the summer season. These tanker trucks, which are all owned by private parties, source and collect water from different regions outside the municipality, including Kandanissery, Kunnamkulam, Chavakkad, Thiruvatra, Kottapuram, Mullakkal, Kechery, Kaiparamb, and Manathala. Given the scarcity of water as well as the poor quality in the study area, the price of water supplied by tanker lorries is highly variable, depending on the indiviual suppliers, further excacerbated during the summer season. This dependence on private water suppliers from outside the region is an emerging threat to urban water security for Guruvayoor.
Water demand
Out of all the wards, ward number 25 (Sub station) had the highest domestic water demand and this was due to the fact that it had the second highest population among all 31 wards and a high per capita demand as per the data obtained from the household survey. Even though ward number 18 (Gurupavanapuri) had the lowest population as the major area of the ward was occupied by Guruvayur temple and related commercial establishments, the per capita demand was high and the ward with lowest domestic water demand was ward number 32 (Kottapadi) as it had a comparatively low population and the least per capita demand among all the wards. Other wards having comparatively high domestic demand were ward number 38 (Thamarayur), 37 (Kotta South) and 31 (Choolpuram West). The total commercial/institutional demand was estimated to be 7.2 MLD and the major portion of this demand was contributed by the hotels, restaurants, and lodges in and around the ward number 18 (Gurupavanapuri) where the Guruvayur temple is located.
Water deficit
The water audit found that Guruvayoor town requires 21 MLD water supply to meet the total water demand. Out of this, direct estimates of KWA supply, along with imported water supply of both tanker- supplied and packaged water, which account for only 4.08 MLD. The agricultural demand of 1.3 MLD has been entirely met by ground water supply. The total domestic demand of 11MLD was also dependent on ground water, where 89% comes from groudwater through extraction from wells. The city as of now has a water deficit of about 5 MLD, which is mostly to meet its commercial demand. It is important that measures are taken by the municipality to target increasing KWA supply or importing water in authorized tank lorries under direct control of the municipality, which will minmize and reduce the risk of exploitation of the public by private water suppliers. Rejuvenation of 33 public ponds within the city could also be a potential alternative water source for Guruvayoor. These ponds at present are contaminated with waste or weed and cleaning them up could open up additional water sources for the municipality.
CONCLUSION
A city scale water audit was carried out at Guruvayoor, a pilgrimage town in the southern Indian state of Kerala. Sources of water supply with their quantity and water demand for various activities were estimated through primary and secondary data collection and analysis. The collected and analyzed data demonstrated that the city is under a severe water stress condition, with a deficit of almost 5 MLD of water in order to meet its total water demand. Most of this deficit was for meeting commercial demand spread across the wards around ward 18 where the temple is located. This study is first of its kind water audit for an Indian city known for religious tourism with a large floating population. The recommendations that followed from this audit include the following:
(i) Target the restoration of urban water bodies as alternative water sources
(ii) Promote rain water harvesting across the municipality as well as recharging of aquifers
(iii) Expand the public water distribution network, but reduce the prevalence of public taps
(iv) Establish routine monitoring of ground water quality & consumption rates and patterns
(v) Register all water supply tankers within the municipality and regulate and monitor movement and loads
(vi) Ensure, through policy and regulation, the quality price of water from tanker truck operator.
One of the limitations of this work was that the availability of rainwater and groundwater was not included while calculating total supply. Since ground water consumption was not metered, ground water contribution to the total available water supply had to be assumed based on the population and their usage pattern. This can be improved in follow up studies by including good estimates for these. Also, ward-wise consumption patterns of water from the KWA supply was unavailable; this will provide finer details and indepth understanding of water use in the municipality. Finally, data collection was one of the major challenges since it was an important part of this project. Accurate data regarding tanker supply were unavailable and therefore the estimation of imported water could be more than actually quantified.
This study focused on the conduct of a city-wide and city-scale water audit over a period of one year during 2017-2018. The objective was to estimate the demand and supply of water. The major finding was that imported water has become a major contributor to the urban water supply of Guruvayoor. An over- arching conclusion from this study is that if the right measures are not taken and some of these studies’ recommendations are not followed through, this can emerge as a threat to urban water security of the temple city. Finally, the dependency on ground water reserves are increasing but sufficient efforts on recharging ground water through RWH are not being implemented or taken up. All of these aspects need to be investigated further in order to fully understand their potential impact on the level and quality of religious tourism at Guruvayoor.
CONFLICT OF INTERESTS
The authors have not declared any conflict of interests.
ACKNOWLEDGMENTS
The authors thank Prof. P. K Santhakumari and Mr. Vinod for entrusting SCMS Water Institute with this project; and appreciate the cooperation of Councillors and officials of Guruvayoor Municipality, Kerala Water Authority, Central Ground Water Board (CGWB), Ground Water Department of Kerala State, Centre for Water Resource Development and Management (CWRDM), Calicut and Women Self-help Groups within Guruvayoor Municipality; Prof Pramod P. Thevannor (Vice Chairman, SCMS) for his support to take up this project; Principal,students and staff at SCMS School of Engineering and Technology for their commitment to serve through this project; Dr. V. K. Baby, IAS for his advice and mentorship during this study. Our utmost thanks are also due to Ms. Lakshmi Chandran for data collection and field studies.
REFERENCES
|
Census (2011). |
|
|
CWMI (2018). Composite Water Resources Management: Performance of States |
|
|
Food and Agriculture Organization (FAO) (2006). The State of Food and Agriculture. Food and Agriculture Organization of the United Nations .ISBN 978-92-5-105600-4. |
|
|
Gagnon GA (1984). The Role of Water Audits in Water Conservation. Journal of Water Resources Planning and Management 110(2):129-140. |
|
|
Gössling S, Peeters P, Hall CM, Ceron JP, Dubois G, Lehmann LV, Scott D (2012). Tourism and water use: Supply, demand, and security. An international review. Tourism Management 33(1):1-15. |
|
|
Hall CM (2010). Crisis events in tourism: subjects of crisis in tourism. Current Issues in Tourism 13(5):401-417. |
|
|
Howley AC (2005). American Water Works Association manual. |
|
|
Kochi Municipal Corporation (KMC) (2015). Kochi Water Policy. pp. 1-16. |
|
|
Kulkarni AA, Patil AA, Patil BB (2014). Water Audit: A Case Study of Water Supply Scheme of Shrivardhan. Journal of Computing Technologies 3(6):5-11. |
|
|
Modi PN (2008). Irrigation Water Resources and Water Power Engineering. Standard Book House Edition 7. ISBN-13:9788189401290. |
|
|
Nicholas P, Dimitrios F, Eirini B (2006). Estimating water losses and assessing network management intervention scenarios: the case study of the water utility of the city of Drama in Greece. Procedia Engineering 162:559-567. |
|
|
Shinde K (2007). Pilgrimage and the Environment: Challenges in a Pilgrimage Centre. Current Issues in Tourism 10(4):343-365. |
|
|
Sudhishri S, Dass A, Paikaray NK (2007). Water Balance Studies and Strategies for Combating Water Deficit in Upper Kolab Catchment of Orissa. Hydrology Journal 30:3-4. |
|
|
United Nations Development Programme (UNDP) (2006). Human development report, beyond scarcity: power, poverty and the global water crisis. United Nations Development Programme. ISBN 0-230-50058-7. |
|
|
UN-Water (2015). UN-Water factsheet on water security. United Nations Department of Economic and Social Affairs (UNDESA). |
|
|
Vogel C (2007). City of Rio Rancho-Water audit summary report, prepared for New Mexico office of the State Engineer Water Use and Conservation Bureau. |
|
|
WWF (2020). The Water Risk Filter |
|
Copyright © 2024 Author(s) retain the copyright of this article.
This article is published under the terms of the Creative Commons Attribution License 4.0


