Full Length Research Paper

ABSTRACT
Using a “mass incarceration” framework and county-level national data, this paper examines the relationship between incarceration, ex-offender reentry locations, and HIV rates in counties with different racial compositions. A series of “race-of-county” stratified regression models estimate HIV prevalence rates with incarceration and ex-offender reentry locations when taking into consideration residential segregation (that is, Black isolation and White isolation), region, high school graduation rates, sex ratios, unemployment rates, median income, healthcare professional shortages, percentage of residents without insurance, population density, and income inequality. As predicted, HIV rates are higher in counties with high incarceration rates or with ex-offender reentry facilities. A race-of-county stratified analysis, however, reveals nuanced patterns: In White counties and the highest-percentage Black counties, HIV rates increase as incarceration rates increase. In integrated counties, they do not. In the highest-percentage Black counties, the presence of reentry locations is associated with higher rates of HIV, but this is not true in White and integrated counties. In integrated counties, higher levels of Black isolation are associated with high HIV rates. In counties of all racial compositions, higher levels of White isolation are associated with lower rates of HIV. Implications of these results are discussed.
Key words: HIV, mass incarceration, residential segregation, racial disparities in HIV.
INTRODUCTION
Since the 1980s, driven by policies such as the “war on drugs,” the prison system has become a potent and often unseen organization that promotes and hardens social inequality (Wakefield and Uggen, 2010: 400). Between 1920 and 1970, the U.S. incarceration rate remained consistent at about 100 per 100,000 residents (Western and Pettit, 2009). Since 1970, the United States has quickly become a world leader in incarcerating its own people, reaching a rate of 762 per 100,000 by 2000 (Huling, 2002). By 2010, approximately 2.2 million people were incarcerated in the United States (Sakala, 2014). The growth of incarceration rates varies by social group, and the impact of incarceration also differs by race. For example, Black men represent roughly 6% of the U.S. population but half of the prison population (Golembeski and Fullilove, 2005)1. Moreover, the dropout rate for Black youth ages 16 to 24 in 2014 was 7.4% compared with Whites at 5.2% (U.S. Department of Education, 2016). Compared with the general public, people in prison have HIV prevalence rates that are 3 to 5 times higher (Tarver et al., 2016; Shrage, 2016). Specifically, as of 2010, the human immunodeficiency virus (HIV) prevalence rate for U.S. prisoners was 1,460 per 100,000 (Maruschak, 2012), more than 5 times higher than the 282 per 100,000 prevalence rate for the general population (CDC, 2013). Prisoners are at higher risk for contracting sexually transmitted infections (STIs) due to sexual relationships with partners who are also incarcerated, limited access to condoms, rape, and drug use. Thus, prisons serve as sites for the spread of STIs (Massoglia, 2008; Schnittker and John, 2007).
Nearly all of those sent to prison are eventually released (Massoglia et al., 2013). Annually, more than 700,000 offenders are released and join the 16 million plus former felons who live in various communities across the country (Massoglia et al., 2013). Of those who are released, about half will return to prison within three years (Pettit and Lyons, 2009). Thus, as the incarceration rate has increased, so has the number of formerly incarcerated offenders who reenter communities. When these ex-offenders are released, many not only are infected with undiagnosed STIs but have few resources to obtain treatment. The cycle of incarceration, release, and reentry exacerbates health inequality for ex-offenders, their families, and their communities (Solomon, 2006).
The burden of HIV is not borne equally across racial groups or communities, as African Americans have significantly higher prevalence rates than do Whites. African Americans are more than six times more likely than Whites to have HIV, at a prevalence rate of 1,009 per 100,000 compared with 149 per 100,000 among Whites (CDC, 2013). These disparities are likely linked to patterns of incarceration, residential segregation, and other community-level factors, such as poverty, median income, income inequality, and level of access to healthcare. Recent studies, for example, have documented the relationship between poverty and HIV prevalence rates (Buot et al., 2014). Moreover, dis-proportionately Black communities are more likely to be impoverished (LaVeist et al., 2011). Still, Black communities experience more disadvantages in HIV prevalence rates than poverty by itself can explain (Hahn et al., 1989; Buot et al., 2014). Are racial disparities in county prevalence rates of HIV also related to incarceration levels and ex-offender reentry locations, both of which are disproportionately present in communities with high concentrations of Black residents? To answer this question, this paper examines the relationship between incarceration, ex-offender reentry locations, and county-level HIV prevalence rates in counties with different racial compositions.
Incarceration, communities, and HIV
Prisons are social institutions that stratify by race and gender, and they play a major role in creating and maintaining social, economic, political, and health disparities (Alexander, 2010; Pettit and Western, 2004; Wakefield and Uggen, 2010). Due to the mass incarceration of Black males in particular, prisons reinforce social inequality that occurs beyond their walls. Thus, inequality research that attempts to understand the unequal distribution of resources across society needs to examine prisons (Grusky, 2001), as they potentially are gateways to elevated rates of HIV, especially in communities to which ex-offenders return. These communities are typically plagued with such problems as high poverty and concentrated disadvantage.
There are several ways by which the mass incarceration of African American men may be related to increased risk of HIV and other negative health outcomes (Johnson and Raphael, 2009; Moore and Elkavich, 2008; Schnittker et al., 2011). First, mass incarceration shifts sex ratios in the communities from which Black men depart (Thomas and Torrone, 2008). Second, individuals who have been incarcerated and have limited access to safe sex options are more likely to suffer from infectious and stress-related illnesses than their peers who have not been incarcerated (Massoglia, 2008). Third, when prisoners are released back into communities, they often concentrate in a few highly disadvantaged counties that lack stable housing, employment, mental and physical health services, all of which may lead to increased rates of STIs (Harding and Morenoff, 2014; Harding et al., 2013; Massoglia et al., 2013). And fourth, residential segregation is directly related to disparities in infectious diseases such as HIV because it facilitates transmission by crowding those ex-offenders who are infected into disadvantaged, segregated living spaces and segregated sex pools (Acevedo-Garcia, 2000).
Additional factors related to community rates of HIV
Socioenvironmental factors are also related to racial disparities in STIs. For example, community-level factors, such as unemployment rates, have increasingly become associated with health outcomes (Beltran et al., 2011; Diez Roux, 2007). Unemployment status is related to health outcomes because people without jobs typically lack health insurance (National Research Council, 2003). Moreover, individuals who lack access to quality health care are less likely to be tested and treated for STIs (Institute of Medicine, 2002). This may increase the concentration of infection within a community because individuals remain untreated and place uninfected potential sex partners in their communities at risk (Kaplan et al., 2009). Paradoxically, neighborhoods with health-care shortages may also have lower reported rates of STIs simply because fewer individuals are tested and identified (Gaskin et al., 2011).
The region of the country in which the county is located may also be associated with HIV rates, as STI rates vary regionally (Nguyen et al., 2008; Reif et al., 2006). Previous studies also suggest that socioenvironmental factors are major drivers of racial disparities in health outcomes (Williams and Collins 1995), as low socioeconomic status (measured in education and income) is related to higher rates of infectious disease in individuals (Aral et al., 2005) and communities (Du et al., 2009). In addition, sex ratio imbalances may be related to STIs (Adimora and Schoenbach, 2005; Adimora et al., 2009) because women may tolerate concurrent partner-ships when they feel they have few other options (Aral, 1996; Valentine, 2008). The literature on health disparities suggests that immigrants typically have better health outcomes than do native born citizens (LaVeist, 2005); nevertheless, when it comes to infectious diseases, some immigrants have higher levels than their native born counterparts (Abraido-Lanza et al., 2005). Finally, income inequality is also associated with negative health outcomes (Farley, 2006; National Research Council, 2003). Overall, where people live and the population densities of their communities influence their health (Williams and Collins, 2001), so the present research takes these socioenvironmental factors into account. In addition, it accounts for the role of incarceration, ex-offender reentry, and residential segregation. Using national data at the county level allows for testing hypotheses consistent with the mass incarceration framework.
DATA AND METHODS
This analysis included all U.S. counties for which HIV infection rates and racial composition have been released by the Centers for Disease Control and Prevention’s Division of HIV/AIDS Prevention (N = 2,310). Various county-level indicators were culled from different sources, including the Centers for Disease Control and Prevention (2009 STD Surveillance System and the Bridged-Race Population Estimates), AIDSVu (2013), the U.S. Census Bureau (Counties Data Files 2005-2007 and 2006-2010 American Community Surveys, and the Small Area Income and Poverty Estimates Program), and the Health Indicators Warehouse. The indicators were compiled into a single dataset in which county was the unit of analysis. Central indicators included rates of HIV infection per 100,000 residents, incarceration rates (that is, lockup rates), ex-offender reentry locations, and residential segregation (that is, Black and White isolation indices).
County-level data were selected for several reasons: (1) Although cities or neighborhoods are important units in metropolitan areas, in non-urban areas, residents may be more likely to see the county as a more important unit; (2) Access to healthcare and other relevant services is determined at the county level; and (3) Decisions about the provision of such services is often made at the county level (McLaughlin and Stokes, 2002). Moreover, in order to understand how these dynamics operate in the national context, it is preferable to look beyond metropolitan areas exclusively. Using county-level indicators enables a nationwide analysis. For analysis purposes, all counties, parishes and boroughs were included.
Operationalizations
All the following variables were assembled in one dataset with the county as the unit of analysis:
1. HIV prevalence rate is defined as “the number of persons living with HIV disease at a given time regardless of the time of infection, whether the person has received a diagnosis (aware of infection), or the stage of HIV disease” divided by the size of the population and standardized to 100,000 (that is, the number of reported HIV cases in the county per 100,000 residents) (CDC, 2014:2).
2. Reentry location refers to whether one or more Bureau of Prisons ex-offender reentry facilities (that is, halfway houses for ex-offenders) located in the county (coded 1 if yes and 0 otherwise).
3. Lockup rate refers to the number of county residents presently incarcerated in any correctional facility divided by the number of total residents in the county.
4. Racial isolation measures: Residential segregation can be examined using several different measures (Massey and Denton, 1988; U.S. Census Bureau, 2011). The dissimilarity index, although a commonly used measure, is not the most appropriate choice when examining infectious diseases, because it does not account for potential contact. Because individuals must almost always come into contact with each other in order to contract HIV, the most appropriate measure of residential segregation in this context is racial isolation (Acevedo-Garcia, 2000), which is measured using two variables:
5. Black isolation is the extent to which Blacks are likely to be in contact with other Blacks rather than Whites. High levels of Black isolation (greater than 60 on a scale from 0 to 100) have been shown to be related to community concentrations of disease, crime, and unemployment (Bobo and Zubrinsky-Charles 1996; Massey and Denton 1993; Meyer, 2000; Zubrinsky-Charles, 2003).
6. White isolation is the extent to which Whites are likely to be in contact with other Whites rather than Blacks. Research suggests that community benefits in health and other resources are related to increased levels of White isolation because the concentration of White privilege tends to enhance resources within the community (Beaulieu and Continelli, 2011; Henderson, 2015).
7. Race of county is a heuristic device used to categorize counties according to the percentage of Black residents. Following the work of Benjamins et al. (2004), for each county, the percentage Black residents was determined and coded to indicate whether it was in the bottom quartile (less than 1.2% Black residents, referred to as “White counties”), the middle two quartiles (1.2 to 16.3% Black residents, referred to as “integrated counties”), or the top quartile (more than 16.3% Black residents, referred to as “disproportionately Black counties” or “highest-percentage Black counties.”
8. Sex ratio indicates, for each county, the number of male residents per 100 female residents.
9. Unemployment rate is the number of unemployed residents in the county ages 16 years and older per 100 county residents ages 16 and older. Residents are classified as unemployed if they do not have a job, have actively looked for work in the prior four weeks, and are currently available for work.
10. Percentage immigrant is the percentage of residents in the country who were born outside the United States.
11. Median income is the dollar amount that divides the income distribution of a county into two equal groups, such that half of the population has a household income above that amount and half has a household income below that amount.
12. Shortage of healthcare professionals is a control variable because health-care shortages have been associated with higher levels of STIs (Kilmarx et al., 1997). A county has a shortage when medical professionals are over utilized or inaccessible (Taylor, 2004). Counties having a shortage of healthcare professionals were dummy variable coded 1, and others were coded 0.
13. Population density is the number of residents per square mile in the county.
14. Region was dummy variable coded to indicate whether the county was located in the South or some other region of the United States.
15. Percentage high school graduates measures, for each county, the percentage of residents 25 years old or older who have a high school diploma or the equivalent.
16. Income inequality (that is, Gini coefficient) is a measure of statistical dispersion that measures the inequality among values of household income. A value of 0 indicates perfect income equality such that everyone has exactly equal income, and a value of 100 indicates maximum inequality such that one family has all the income.
A list of the data sources for the variables used in the analysis can be found in Table A1 in Appendix A.
Hypotheses
This paper assesses the relationship between incarceration rates and reentry locations on HIV prevalence. It tests the following hypotheses concerning incarceration and race-based disparities in community prevalence rates of HIV:
Hypothesis 1: Net of other factors, as incarceration rates in counties increase, prevalence rates of HIV in counties increase. Given that ex-offenders are likely to cycle in and out of prison and other institutions of social control (such as halfway houses and jails), examining the impact of both incarceration and prisoner reentry locations on county prevalence rates of HIV is important.
Hypothesis 2: Net of other factors, counties with reentry locations have higher prevalence rates of HIV than counties without reentry locations.
Analysis
Stata 13.0 was used to carry out the data analysis and data management. The analysis is based on a series of ordinary least squares (OLS) regression models in which county rates of HIV is the dependent variable. The central independent variables are lockup rate and reentry location. In addition, the models take into consideration Black isolation, White isolation, percentage high school graduates rates, shortage of healthcare professionals, uninsured rates, sex ratios, unemployment rates, median income, percentage of immigrant residents, population density, and income inequality as predictors of HIV rates. The analysis also examines how these factors are related to HIV rates when stratified by racial composition of the county. The stratified analyses provide some assessment of how great the disparities in STIs are between White and Black counties, controlling for community health-related factors.
RESULTS
The effects of incarceration do not end upon release. More than 95% of incarcerated individuals eventually reenter the general community (Awofeso, 2010:27). When prisoners are released, they are often released into highly disadvantaged counties (Harding and Morenoff, 2014; Harding et al., 2013; Massoglia et al., 2013). Reentering ex-offenders return to counties that face employment challenges, lower income, less access to healthcare, lower levels of educational attainment, greater income inequality, higher population density, and greater levels of residential segregation. This helps create and maintain a cycle of incarceration-release-and incarceration (Federal Bureau of Prisons, 2013).
Table 1 presents the rates of HIV per 100,000 residents by whether the county contains a reentry location. The overall prevalence rate of HIV infection is 339.5 per 100,000 residents, but the prevalence rate is 524.9 per 100,000 residents in counties with reentry locations, contrasted to 227.2 per 100,000 in counties without reentry locations. The gap the in HIV rates between counties with and without reentry locations is thus 297.7 cases per 100,000.
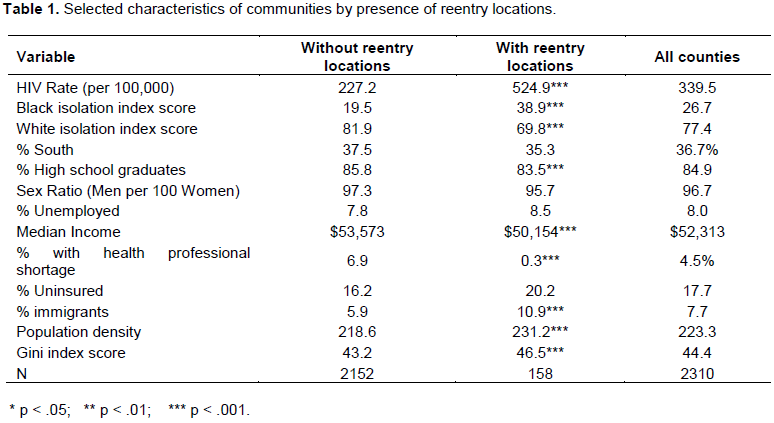
Table 1 also presents selected characteristics of counties and the average for “All Counties.” As this final column shows, the average Black isolation index score is 26.7, and the average White isolation index score is 77.4. Overall, 36.7% of counties are located in the South. The average percentage of high school graduates is 84.9. On average, there are 96.7 men per 100 women. The average unemployment rate is 8.0%. The overall median income is $52,313. The percentage immigrant is 7.7. It shows that 4.5% of counties have a health care professional shortage. The average population density is 223.3 people per square mile. The average Gini index score is 44.4.
A central concern of this analysis is whether HIV rates differ between counties that do and do not have reentry locations. It is therefore, appropriate to determine whether these counties differ on other characteristics that might be related to HIV rates. Columns 1 and 2 of Table 1 show that, for example, counties with reentry locations have higher Black isolation scores and lower White isolation scores than counties without reentry locations. Compared to their counterparts without reentry locations, counties with reentry locations have fewer shortages of healthcare professionals, higher percentages of high school graduates, greater male-to-female sex ratios, lower median incomes, higher percentages of immigrant residents, more dense populations, and greater income inequality. These factors are taken into consideration in the analysis.
Table 2 presents three OLS regression models predicting HIV rates based on lockup rates and reentry locations, the two central independent variables. Model 1 shows that as the lockup rate increases by 1, the HIV prevalence rate increases by 10.4 per 100,000 (p < .05). In addition, on average, in counties with reentry locations the HIV prevalence rate is higher than in counties without reentry locations. These patterns are fully consistent with Hypotheses 1 and 2. Lockup rates and reentry locations account for more than 15% of the variance in HIV rates.
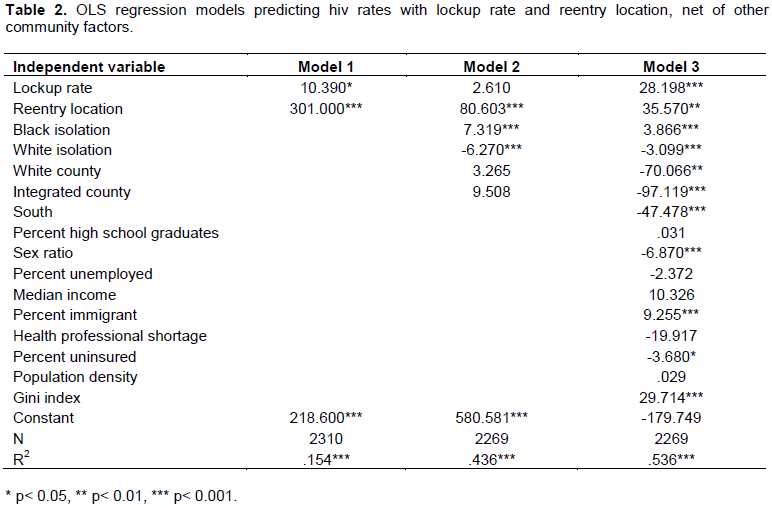
Model 2 (in Table 2) shows that when racial isolation and race of county are taken into account, the relationship between lockup rate and HIV prevalence rates is reduced to statistical non-significance. In other words, racial isolation and race of county explain the apparent link between lockup rates and HIV rates. By contrast, counties that house ex-offender reentry locations still have higher HIV prevalence rates than their counterparts without such facilities. This model also shows that as Black isolation increases, the HIV prevalence rate increases. In contrast, as White isolation increases, the HIV prevalence rate decreases. Like much previous literature, these results suggest that Black isolation, as an indicator of concentrated disadvantage, is associated with increasing rates of STIs. The present results also show, however, that White isolation is conversely associated with decreasing prevalence rates of HIV. Model 2 also suggests that, on average, prevalence rates of HIV do not appear to be significantly lower in White or integrated counties than in the highest-percentage Black counties.
Taking other factors into account, Model 3 (in Table 2) predicts HIV prevalence rates according to lockup rates and reentry locations when taking all other county factors into consideration. Net of reentry locations and all other variables, higher lockup rates are associated with higher HIV prevalence rates. On average, counties with reentry locations have HIV prevalence rates that are 35.6 cases higher than comparable counties without reentry locations. Model 3 also shows that the HIV prevalence rate increases as Black isolation increases. In contrast, as White isolation increases, the HIV prevalence rate decreases. These results reinforce the suggestion that Black isolation and White isolation operate in opposite fashions with respect to HIV prevalence rates. This model also shows that rates of HIV are significantly lower in integrated counties and White counties than in the highest-percentage Black counties. HIV prevalence rates also increase as the male-to-female sex ratio decreases, as the percentage of immigrants increases, as the percentage of uninsured residents decreases, and as income inequality increases. These patterns are fully consistent with Hypothesis 1 and 2. Combined, these factors account for 53.6% of the variance in HIV rates across counties; thus, Model 3 explains the greatest proportion of the variance in HIV prevalence rates, offers the best fit, and is to be preferred.
Additional analyses (not presented here) also suggest statistical interactions between racial composition of a county and several factors analyzed here. In particular, White isolation operates differently in White and integrated counties than it does in the highest-percentage Black counties. These differential patterns of association between racial isolation and HIV rates by racial composition of county call for an analysis stratified by race of county, as presented next.
Model 1 in Table 3 shows that higher lockup rates are associated with higher HIV rates. Yet, the presence of reentry locations in White counties is not related to HIV prevalence rates. Black isolation is not systematically related to HIV rates, but White isolation is associated with decreases in HIV rates. These results suggest that, in White counties, the percentage of county residents with a high school education, population density, and income inequality are all related to HIV prevalence rates.
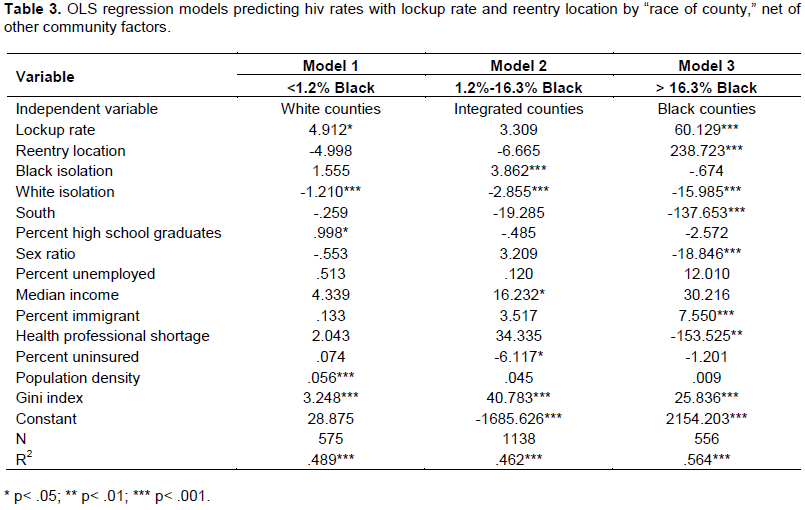
Model 2 shows that, in integrated counties, neither lockup rates nor reentry locations are associated with prevalence rates of HIV. However, Black isolation is associated with higher prevalence rates of HIV, and White isolation is associated with lower rates of HIV. In integrated counties, the relationships between median income, percentage of residents without insurance, and income inequality are significant. These results in Model 2 are not consistent with Hypotheses 1 and 2.
Model 3 presents results for the highest-percentage Black counties. It shows that both higher lockup rates and the presence of reentry locations are associated with higher HIV prevalence rates. Although Black isolation in the highest-percentage Black counties is not associated with higher rates of HIV, White isolation is associated with lower prevalence rates of HIV. Factors such as region,2 sex ratio, percentage immigrants, health professional shortages, and income inequality are related to HIV rates. These results in Model 3 are fully consistent with Hypotheses 1 and 2.
The stratified analysis shows that whether lockup rates and ex-offender reentry locations are associated with higher HIV rates is conditional on the racial composition of the county. In White counties and the highest-percentage Black counties, HIV rates increase as incarceration rates increase. In integrated counties, they do not. In the highest-percentage Black counties, the presence of reentry locations is associated with higher rates of HIV, but in White and integrated counties, this is not the case. In integrated counties, higher levels of Black isolation are associated with higher rates of HIV. In counties of all racial compositions, higher levels of White isolation are associated with lower rates of HIV.
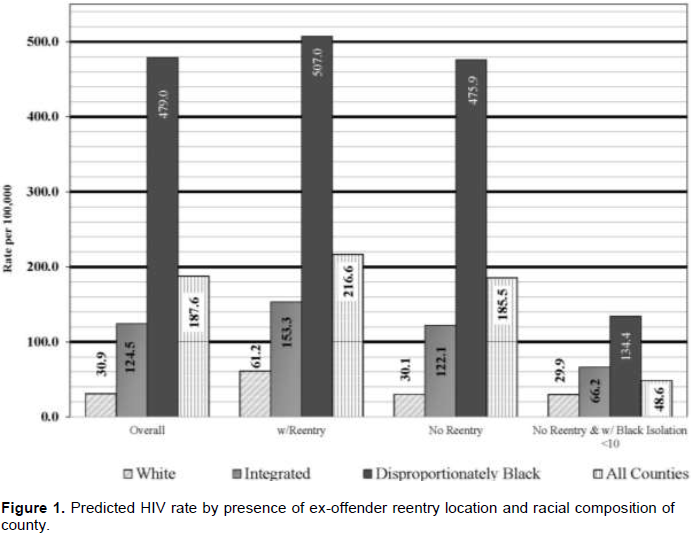
Figure 1 illustrates predicted HIV rates by racial composition of county, with and without reentry locations and with a Black isolation index of less than 10 in counties without reentry locations. This chart shows that the overall HIV rate prevalence would decline by more than 74% (from 187.6 to 48.6 per 100,000) if the Black isolation index were to be reduced to less than 10 in counties without reentry locations. It also shows that rates in the highest-percentage Black counties would decline by more than 344 cases (from 479.0 to 134.4 per 100,000). The HIV rates in White counties would not increase (decreasing from 30.9 to 29.9 per 100,000). In integrated counties HIV would fall by 58.3 cases (from 124.5 to 66.2 per 100,000). In this scenario, the gap between White counties and the highest-percentage Black counties would be reduced from 448.1 cases down to 104.5 cases.
DISCUSSION
This paper began with a focus on the link between policies such as the “war on drugs” and consequent mass incarceration, prisoner reentry locations, and STI disparities. Given that millions of formerly incarcerated individuals are disproportionately concentrated in disadvantaged communities, the paper examined whether incarceration rates and reentry locations are related to HIV rates in U.S. counties with various racial compositions. The results illustrate the combined power of mass incarceration, ex-offender reentry locations, and residential segregation in perpetuating disparities in HIV rates between White and disproportionately Black counties. In particular, the results point to a link between incarceration rates, ex-offender reentry locations, and HIV rates-especially in the highest-percentage Black counties-that is consistent with the central arguments of the mass incarceration framework.
Using nationwide county-level data, the paper tested two hypotheses: (1) As incarceration rates in counties increase, rates of HIV in counties increase and, and (2) Counties with reentry facilities have higher rates of HIV than counties without reentry facilities. Both bivariate and multivariate analyses provided support for these hypotheses. Generally, as incarceration rates increase, so do HIV rates. Also, counties that host ex-offender reentry locations have higher rates of HIV. Counties with reentry facilities have higher rates of HIV, in part, when higher proportions of their residents are exposed while incarcerated. These facilities also house ex-offenders who are at risk for engaging in unsafe sexual behaviors and illicit drug use, as well as for having limited access to health insurance and jobs.
When stratified by county racial composition, the analysis provides a more nuanced picture. It shows that the relationship between HIV prevalence rate and both incarceration rate and presence of ex-offender reentry locations is conditional on the racial composition of the county. White counties with reentry locations have higher rates of HIV, and their rates of HIV increase as their incarceration rates increase. In the highest-percentage Black counties, however, the presence of reentry locations is not systematically related to higher rates of HIV, but higher incarceration rates are. In integrated counties, neither reentry locations nor incarceration rates are associated with HIV rates.
This research also suggests that residential segregation in the form of racial isolation is related to county rates of HIV. In counties of all racial compositions, White isolation is associated with lower HIV rates. In integrated counties, however, Black isolation is associated with increased rates of HIV.
The analysis provides support for the idea that there are several pathways by which mass incarceration may affect the sexual health of racially isolated communities. It does shift sex ratios in the communities, which are related to HIV prevalence rates. Higher incarceration rates are also directly linked to higher HIV prevalence rates. Another clear pathway by which mass incarceration appears to be linked to higher HIV prevalence rates is through reentry locations. When prisoners are released back into communities, they often concentrate in a few highly disadvantaged communities where they are faced with instability in housing, employment, and mental health services, along with exposure to violence, which may lead to engaging in risky sexual behaviors and re-offending in order to make money. These factors help create and maintain cycles of incarceration-release-re-incarceration (Federal Bureau of Prisons, 2013).
Although reentry locations are intended to help released prisoners make the transition from incarceration to the community by providing a more structured environment, they may, however, lead to increased prevalence rates of HIV because they segregate ex-offenders and concentrate HIV within the localities to which they return. Ex-offenders living in reentry locations are free to engage in sexual relationships with community members. Yet, they often lack health insurance, face disruptions in their romantic relationships, and are more likely to engage in high-risk sexual behaviors, such as selling sex for drugs or money and having multiple partners without protection soon after being released (Morrow and the Project Start Study Group, 2009; Patterson, 2013).
A related pathway-residential segregation- has both direct and indirect effects on health disparities (Acevedo-Garcia, 2000; LaVeist, 2005; LaVeist et al., 2011). For example, residential segregation is directly related to disparities in infectious diseases because it facilitates transmission by crowding those who are infected into disadvantaged, segregated living spaces and segregated sex pools. This is true not only of ex-offenders who are disproportionately concentrated in such communities, but also other community residents; thus, residential segre-gation tends to concentrate and increase HIV infection prevalence rates within the community (Acevedo-Garcia, 2000). The increased infection prevalence rate in communities that are disadvantaged by residential segregation in turn heightens the disparity in HIV between those communities and the general population. Among the indirect effects of segregation are concentrated disadvantage and reduced access to health care, jobs, and education (Massey and Denton, 1993). Research suggests that when Black isolation is high, residents often lack access to resources that help sustain good health (Beaulieu and Continelli, 2011. Blacks in White counties, even those who are more isolated in virtually all-White counties, experience relatively low levels of Black isolation and are probably more likely to have greater access to community resources. They, like Whites in these counties, are shielded from the harshest impacts of concentrated disadvantage.
Racial isolation in integrated counties operates differently than in White counties. Isolation can range from very low to very high levels. In the context of an integrated county, Black isolation is linked to higher HIV rates. Highly isolated Black enclaves begin to look much like the highest-percentage Black counties in their experience of concentrated disadvantage.
Finally, in the highest-percentage Black counties, Black isolation does not demonstrate as much elasticity (that is, sensitivity to a change in other variables) as in integrated counties. This is probably due to the facts that Black isolation in such counties is already routinely high and not strongly linked to HIV rates. Rather, such counties appear to be much more strongly affected by high incarceration rates and the presence of reentry locations.
This research does have some limitations. First, it would be preferable to have individual-level or multi-level data at a lower level of aggregation that would still provide national coverage. Another limitation is the difficulty of examining causal mechanisms using this dataset. The county-level data allow for the examination of correlation but not causation. In addition, the current dataset cannot allow for the examination of homophobia, sexism, or other exogenous factors that may be related to racial disparities in STIs. It would be ideal to be able to examine such factors using multi-level analysis.
Still, this research extends the scholarly discussion of racial disparities in HIV by illustrating how powerfully incarceration rates, ex-offender reentry locations, and residential segregation are related to HIV prevalence rates, depending on racial segregation factors. More specifically, it suggests that racial isolation amplifies the link between incarceration and ex-offender reentry locations and between racial disparities in HIV rates in counties with the lowest and highest percentages of Black residents. In addition, it put forth mass incarceration, reentry locations, and sex ratios as new structural factors that helps explain disparities in HIV. A challenge for policymakers is to address these issues with effective strategies that reduce racial gaps. Eliminating such racial disparities should be a primary goal. Public health initiatives need to move beyond policies that focus exclusively on individual behaviors to incorporate community-level interventions that confront structural issues, as these factors are clearly related to community rates of HIV.
Finally, the results of this analysis suggest that structural factors like elevated incarceration rates, presence of ex-offender reentry locations, and racial isolation are related to county HIV rates. Such structural factors are intertwined and multifaceted, making it difficult to provide a singular strategy to eliminate racial disparities in HIV. This does not, however, mean that the cause is hopeless. For example, reducing rates of incarceration will have the effect of reducing prevalence rates of HIV, both in prisons and in the communities to which ex-offenders return. In addition, when people are in prison, increasing access to testing and treatment will reduce the spread of HIV. Policymakers could also consider the successful Syphilis Elimination Effort campaign, which effected dramatic drops in syphilis rates (CDC, 2006). A similar kind of effort should be extended to HIV, especially in racially segregated and dis-proportionately Black communities. As this analysis has shown, relegating ex-offenders to communities that already face concentrated disadvantage further exacerbates racial disparities in HIV. At a minimum, this practice should be called into question.
CONFLICTS OF INTERESTS
The author has not declared any conflicts of interest.
ACKNOWLEDGMENTS
The author extends her thanks to Assata Zerai, Ruby Mendenhall, Tim Liao, and the late Jorge Chapa for their substantial contributions to this paper. She also thanks Marina Adler, Kirsteen Anderson, Juan Battle, Cedric Herring, Michael Hughes, and Yan Xing for their comments and suggestions on various drafts. Finally, she is grateful to those who provided comments at colloquia at the University of Illinois at Urbana-Champaign and the University of Maryland Baltimore County. Parts of this paper have been presented at the Association of Black Sociologists and the Eastern Sociological Society annual conferences.
REFERENCES
|
Abraido-Lanza AF, Chao MT, Flórez KR (2005). "Do healthy behaviors decline with greater acculturation?: Implications for the Latino mortality paradox." Soc. Sci. Med. 61(6):1243-55. |
|
|
Acevedo-Garcia D (2000). Residential Segregation and the Epidemiology of Infectious Diseases. Soc. Sci. Med. 51(8):1143-61. |
|
|
Adimora AA, Schoenbach VJ (2005). Social context, sexual networks, and racial disparities in rates of sexually transmitted infections. J. Infect. Dis. 191:S115-S122. |
|
|
Adimora AA, Schoenbach VJ, Floris-Moore MA (2009). Ending the Epidemic of Heterosexual HIV Transmission among African Americans." Am. J. Prev. Med. 37(5):468-471. |
|
|
AIDSVu. Emory University, Rollins School of Public Health. |
|
|
Alexander M (2010). The New Jim Crow: Mass Incarceration in the Age of Colorblindness. New York: New Press. |
|
|
Awofeso N (2010). Prisons as social determinants of hepatitis C virus and tuberculosis infections. Public Health Reports 125 Suppl 4: 25. |
|
|
Beaulieu M, Continelli T (2011). Benefits of Segregation for White Communities: A Review of the Literature and Directions for Future Research. J. Afr. Am. Stud. 15(4):487-507. |
|
|
Beltran VM, Harrison KM, Hall HI, Dean HD (2011). Collection of social determinant of health measures in US National Surveillance Systems for HIV, Viral Hepatitis, STDs, and TB. Public Health Rep. 126 Suppl 3:41-53. |
|
|
Benjamins MR, Kirby JB, Bond Huie SA (2004). County Characteristics and Racial and Ethnic Disparities in the Use of Preventive Services. Prev. Med. 39(4):704-12. |
|
|
Bobo L, Zubrinsky CL (1996). Attitudes on residential integration: Perceived status differences, mere in-group preference, or racial prejudice?. Soc. Forces 74(3):883-909. |
|
|
Buot ML, Docena JP, Ratemo BK, Bittner MJ, Burlew JT, Nuritdinov AR, Robbins JR (2014). Beyond race and place: distal sociological determinants of HIV disparities. PloS 9(4):e91711. |
|
|
Centers for Disease Control and Prevention (CDC) (2006). The National Plan to Eliminate Syphilis from the United States. Atlanta, GA: US Department of Health and Human Services, CDC. |
|
|
Centers for Disease Control and Prevention (CDC) (2010). Sexually Transmitted Disease Surveillance, 2010. Atlanta: Centers for Disease Control and Prevention. |
|
|
Centers for Disease Control and Prevention (CDC) (2013). HIV Surveillance Report, Diagnosis of HIV infection in the United States and Dependent Areas, 2011. |
|
|
Centers for Disease Control and Prevention (CDC) (2014). Terms, Definitions, and Calculations Used in CDC HIV Surveillance Publications. Atlanta, GA: National Center for HIV/AIDS, Viral Hepatitis, STD, and TB Prevention, Division of HIV/AIDS Prevention. |
|
|
Diez Roux AV (2007). Neighborhoods and Health: Where Are We and Where Do We Go from Here?" Rev. Epidemiol. Sante Publique 55:13-21. |
|
|
Farley TA (2006). Sexually Transmitted Diseases in the Southeastern United States: Location, Race, and Social Context. Sex. Transm. Dis. 33(7 Suppl):S58-64. |
|
|
Federal Bureau of Prisons (2013). Completing the Transition. |
|
|
Gaskin DJ, Dinwiddie GY, Chan KS, McCleary R (2011). Residential segregation and disparities in health care services utilization. Med. Care Res. Rev. 69(2):158-75. |
|
|
Golembeski C, Fullilove R (2005). Criminal (in) justice in the city and its associated health consequences. Am. J. Public Health 98(9 Suppl):S185-90. |
|
|
Grusky DB (2001). The Past, Present, and Future of Social Inequality. Social stratification: Class, race, and gender in sociological perspective 1. |
|
|
Hahn RA, Onorato IM, Jones TS, Dougherty J (1989). Prevalence of HIV infection among intravenous drug users in the United States. Jama 261(18):2677-2684. |
|
|
Harding DJ, Morenoff JD, Herbert CW (2013). Home Is Hard to Find Neighborhoods, Institutions, and the Residential Trajectories of Returning Prisoners. Ann. Am. Acad. Pol. Soc. Sci. 647(40):214-236. |
|
|
Harding DJ, Morenoff JD (2014). Incarceration, prisoner reentry, and communities. Ann. Rev. Sociol. 40:411-429. |
|
|
Henderson L (2015). Racial Isolation and Chlamydia Rates in U.S. Counties. Race Soc. Probl. 7(2):111-122. |
|
|
Huling T (2002). Building a Prison Economy in Rural America. In: Invisible Punishment: The Collateral Consequences of Mass Imprisonment. Marc Mauer and Meda Chesney-Lind (Editors). New York: The New Press. pp. 197-213. |
|
|
Johnson RC, Raphael S (2009). The Effects of Male Incarceration Dynamics on Acquired Immune Deficiency Syndrome Infection Rates among African American Women and Men. J. Law Econ. 52:251-293. |
|
|
Kaplan MS, Crespo CJ, Huguet N, Marks G (2009). Ethnic/Racial Homogeneity and Sexually Transmitted Disease: A Study of 77 Chicago Community Areas. Sex. Transm. Dis. 36(2):108-111. |
|
|
Kilmarx PH, Zaidi AA, Thomas JC (1997). "Sociodemographic Factors and the Variation in Syphilis Rates among U.S. Counties, 1984 through 1993: An Ecological Analysis. Am. J. Public Health 87:1937-1943. |
|
|
LaVeist TA, Gaskin D, Trujillo AJ (2011). Segregated Space, Risky Places: The Effects of Racial Segregation on Health Inequalities. Washington, DC: Joint Center for Political and Economic Studies. |
|
|
LaVeist T (2005). Minority Populations and Health: An Introduction to Health Disparities in the United States. San Francisco: Jossey-Bass. |
|
|
Maruschak L (2012). HIV in Prison 2001-2010 Revisited. Bureau of Justice Statistics. |
|
|
Massoglia M, Firebaugh G, Warner C (2013). Racial variation in the effect of incarceration on neighborhood attainment. Am. Soc. Rev. 78(1):142-165. |
|
|
Massoglia M (2008). Incarceration as Exposure: The Prison, Infectious Disease, and Other Stress-Related Illnesses. J. Health Soc. Behav. 49(1):56-71. |
|
|
Massey DS, Denton NA (1988). The dimensions of residential segregation. Soc. Forces 67(2):281-315. |
|
|
Massey DS, Denton N (1993). American Apartheid: Segregation and the Making of the Underclass. Cambridge, MA: Harvard University Press. |
|
|
McLaughlin DK, Stokes CS (2002). Income Inequality and Mortality in US Counties: Does Minority Racial Concentration Matter? Am. J. Public Health 92(1): 99-104. |
|
|
Meyer SG (2000). As Long as They Don't Live Next Door: Segregation and Racial Conflict in American Neighborhoods. New York: Rowman & Littlefield. |
|
|
Moore LD, Elkavich A (2008). Who's Using and Who's Doing Time: Incarceration, the War on Drugs, and Public Health. Am. J. Public Health 98:782-786. |
|
|
National Center for Education Statistics (2016). Fast Facts Drop Out Rates. |
|
|
National Research Council (2003). The Future of the Public's Health in the 21st Century. Washington, DC: The National Academies Press. |
|
|
Nguyen TQ, Ford CA, Kaufman JS, Leone PA, Suchindran C, Miller WC (2008). Infrequent Chlamydial Testing Among Young Adults: Financial and Regional Differences. Sex. Transm. Dis. 35(8):725-30. |
|
|
Pettit B, Lyons CJ (2009). Incarceration and the Legitimate Labor Market: Examining Ageâ€Graded Effects on Employment and Wages. Law Soc. Rev. 43(4):725-756. |
|
|
Pettit B, Western B (2004). Mass imprisonment and the life course: Race and class inequality in US incarceration. Am. Soc. Rev. 69(2):151-169. |
|
|
Rand (2011). RAND Center for Population Health and Health Disparities (CPHHD) Data Core Series: Segregation Indices, 1990-2000 United States. ICPSR27863-v1. Ann Arbor, MI: Inter-university Consortium for Political and Social Research distributor, 2011-05-13. |
|
|
Reif S, Geonnotti KL, Whetten K (2006). HIV Infection and AIDS in the Deep South. Am. J. Public Health 96.6:970-973. |
|
|
Sakala L (2014). Breaking Down Mass Incarceration in the 2010 Census: State by State Incarceration Rates by Race/Ethnicity. Northampton, MA: Prison Policy Initiative. |
|
|
Schnittker J, Massoglia M, Uggen C (2011). Incarceration and the Health of the African American Community. Du Bois Review: Soc. Sci. Res. Race 8(1):133-141. |
|
|
Shrage L (2016). African Americans, HIV, and mass incarceration. Lancet 388(10049):e2-e3. |
|
|
Solomon AL (2006). Understanding the Challenges of Prisoner Reentry: Research Findings from the Urban Institute's Prisoner Reentry Portfolio. Washington, DC: Urban Institute. |
|
|
Tarver BA, Sewell J, Oussayef N (2016). State Laws Governing HIV Testing in Correctional Settings. J. Correct. Health Care 22(1):28-40. |
|
|
Taylor J (2004). The Fundamentals of Community Health Centers. Washington, DC: National Health Policy Forum. |
|
|
Thomas JC, Torrone EA (2008). Incarceration as forced Migration: Effects on Selected Community Health Outcomes. Am. J. Public Health 98Suppl 1:S181. |
|
|
United States Census Bureau, Housing and Household Economic Statistics Division. (2011). |
|
|
Wakefield S, Uggen C (2010). Incarceration and stratification. Ann. Rev. Sociol. 36:387-406. |
|
|
Western B, Pettit B (2010). Incarceration and Social Inequality. Daedalus 139:8-19. |
|
|
Williams DR, Collins C (1995). U.S. Socioeconomic and Racial Differences in Health: Patterns and Explanations. Ann. Rev. Sociol. 21:349-386. |
|
|
Williams DR, Collins C (2001). Racial Residential Segregation: A Fundamental Cause of Racial Disparities in Health. Public Health Reports 116:404-416. |
|
|
Zubrinsky-Charles C (2003). The Dynamics of Racial Residential Segregation. Ann. Rev. Sociol. 29:167-207. |
|
Copyright © 2024 Author(s) retain the copyright of this article.
This article is published under the terms of the Creative Commons Attribution License 4.0


