ABSTRACT
Approaches that bridge the technology and knowledge gaps between policy makers and local communities towards natural resource management are required. This study employed participatory Geographical Information System (PGIS) to assess and identify drivers of land use and land cover changes in Nguruman Sub-catchment. Data were collected following a focus group discussion (FGDs) during which a resource mapping exercise was also carried out. FDGs consisting of 12 members were used to establish changes that had taken place between 1994 and 2004, and between 2004 and 2014. The ten year interval was purposively chosen in order to cater for temporal sensitivity in resource changes by local communities. The participants listed the land use in their respective villages for the years 1994, 2004 and 2014. The land uses listed included forestland, irrigated and rainfed cropland, woodlands and water bodies. This was later presented graphically on manila papers for the respective years to showcase land use and land cover changes as perceived by the local communities. Using a digital camera, photographs of these maps were then taken. Features that acted as boundaries and were also found within the areas drawn were mapped using Global Positioning System (GPS). These features were used for geo-referencing of the mental maps in order to analyze natural resource changes as perceived by the local communities. Results from the PGIS were further transferred and analyzed by the GIS in order to determine the extent and magnitude of changes, based on the local knowledge. Results indicate that local communities have knowledge about the causes and consequences of land use and land cover changes occurring in their areas. Significant (p < 0.05) changes were observed in irrigated cropland areas. The study provides an effective basis to describe and explain the patterns of land use and land cover change including their root causes and consequences based on the community perspective. PGIS is a suitable tool to involve local communities in planning, evaluating, monitoring and managing their own natural resources.
Key words: Land use, community, PGIS, natural resources, Nguruman.
Land use and land cover changes (LULCC) is driven by various bio-physical (for example, temperature, rainfall, slope, drainage) and socio-economic conditions for example, the growth of population, industrialization, infrastructure and technological growth (Campbell et al., 2000). Understanding the fundamental types of the driving forces and how they interact is one of the basic requirements to identify the most important change directions (Veldkamp and Lambin, 2001).
The complexity of the processes that determine LULCC requires the use of multiple methods of analysis and a critical interpretation of the social data in order to understand the drivers and impacts of spatial and temporal changes. Local knowledge is undoubtedly crucial to understand the human interactions with the environment. Local people are closely connected to the land for survival; hence, they possess the cumulative knowledge of generations, concerning real experiences (Berkes et al., 2000).
The recognition of a local expert knowledge in order to inform and guide into environmentally related decisions is becoming increasingly important (Millenium Ecosystem Assessment, 2005). The local community knowledge is embedded in their ecosystems, to which they can adapt and respond with an ecological feedback. Nevertheless, the acquisition of such an extensive knowledge and experiences affects their view and interpretation of those complex social-ecological systems. But this acquired knowledge is particularly valuable to collect information and guide towards an environmental management. In particular, the application of the local knowledge to a watershed management plan showed to be an essential element for an effective catchment restoration (Palmer et al., 2005).
Additionally, the participation of local communities is crucial in the early planning stages of the watershed management (Bernhardt and Palmer, 2007). The inte-gration of the local people in order to identify their own needs is important because they enable an understanding of the underlying processes that will transform land use change. These include social and cultural, as well as economic and institutional processes, together with the responses of people to land use changes. Therefore, the interpretation of the local dynamics of resources access and use will be easier, providing better information for both policymakers and scientists (Troyer, 2002). Further, this enables planners to formulate policies to minimize the undesirable effects of future land use changes on catchments (Mustafa et al., 2005) and guide into an effective management of the natural resources. In the recent years, the separation between science and local knowledge has decreased, and researchers are attempting to understand the benefits that such an approach may bring to the research, government policy, and environmental and resource management (Briggs, 2005). Historically, modern knowledge systems have been criticized for marginalizing local knowledge either politically, socially or economically (Louis, 2007).
Conventional geographical information systems is currently a very popular mapping tool in geographic research. This system has many capabilities, including advanced geospatial analysis, computer mapping and digital display. It can be used to empower marginalized communities, but could conceivably alienate and isolate members who lack sufficient computer access (Chambers et al., 2004). In addition, GIS may not be compatible with local knowledge (McCall, 2004). It may also be inappropriate because of the cost of the technology, the need for specialized training, concerns over rights of information, access and use as well as the fundamental difficulties in understanding the Cartesian methods of spatial representation (Chambers et al., 2004).
Currently, emerging issues in Land use and management have prompted to the need to include local people in the decision making processes that may influence their lives. This need has brought about the evolution from GIS to the Participatory GIS (PGIS) concept as a tool for the social development and involvement. PGIS integrates participatory methodologies with geo-spatial technologies in order to better represent and empower marginalized communities and provide information to a wider range of people in various fields including: urban planning, landscape ecology, natural resources and conservation biology (Sieber, 2006).
Hence, Participatory GIS is a powerful tool for good governance, and this has led to an increased use of this initiative for the last 20 years throughout the world (IFAD, 2009). It is a useful means for communities to report land related information at present and future needs in order for the government to better understand the community and the environment (McCall, 2004). This exercise facilitates management of land and resources, and supports community advocacy on land related issues (Di Gessa, 2008). In a number of cases worldwide, communities have succeeded the demand for legal recognition resource rights through participatory mapping of land resource (McCall and Minang, 2005).
For instance; in Guyana, Amerindian people succeeded in claiming their ancestral land titles (Griffiths, 2002) as a result of participatory mapping of resources using PGIS). Moreover, the Ogiek, Sengwer and Yaiku indigenous communities in Kenya were able to initiate their own ancestral land and cultural rights, and natural land resource management projects after a participatory resource mapping exercise carried out in 2006 (Muchemi et al., 2009).
In addition, Baaru and Gachene (2016) used PGIS to empower locals in their natural resource assessment and in identifying the problems faced by the community in Kathekakai - Machakos District, Kenya. Participatory approaches have also been useful in mapping areas that should be preserved (Bojorquez-Tapia et al., 2003; Brown et al., 2004; Kathumo and Gachene, 2012). As observed by Nabwire and Nyabenge (2006) and Kathumo and Gachene (2012), spatial inventories of natural resources, claiming land use rights and perceived problems can be documented through participatory GIS mapping, to enhance equitable and sustainable natural resource management. Sambalino et al. (2015) demonstrated that one of the most important activities for managing human-elephant conflicts is to bring stakeholders into a forum to share information, build collaboration and advocate for new policies.
Ngurman lies at the heart of Maasailand, a vast stretch of land that unfolds across Kenya and Tanzania (Homewood et al., 2009). Its inhabitants are predominantly nomad or semi-nomad Maasai shepherds. However, new groups are entering the area at a growing rate. Between 1962 and 1989, the Maasai population in Kajiado and Narok changed from 78 and 79% to 57 and 47%, respectively (Coast, 2002). This trend has continued until the recent years (Sambalino et al., 2015). Despite being predominately rooted in shepherding, Maasai are also adapting to the shifting context e.g changing from traditional pastroral sytems to agropastoral livelihood, As increased connectivity to the globalized market economy has brought new needs to the community.
Simultaneously, land privatization and fragmentation, recurrent climate shocks, the disintegration of collective natural resources management systems, as well as increasing livestock and human populations, have made natural resources increasingly scarce (Sambalino et al., 2015). Coupled with an influx of people interested in non-pastoral activities, this is causing land fragmentation and the disruption of traditional grazing patterns (Homewood et al., 2009). In Kajiado North County… perennial fresh water sources are rare and vital. The most important surface water body in the target area is the Ewaso N’Giro River. The amount of water flowing in the river has drastically decreased in the last years, mostly due to unregulated abstraction and degradation of the upper catchment coupled with insufficient rainfall (Gichuki and Macharia, 2006). Unfortunately, no ecologically sound plans have been made to sustain this critical area. In March 2015, the Ewaso N’Giro dried before reaching Lake Natron.
Therefore, the purposes of this study were i)to analyze resource changes with the local communities using PGIS; ii) to identify sustainable land use and management strategies to enhance the natural resource preservation; iii) and to identify policy options for a sustainable community management of land resources that can lead to a reduced land degradation and Human-wildlife conflicts.
Land use and land cover change analysis
A combination of two approaches was applied: a consultation of expert knowledge, and opinions using Participatory approaches (PGIS) and focused group discussions (FGDs). To facilitate effective participation by local communities, participants were taken according to the tools to be used for the PGIS exercise. These included Geographical Position System (GPS), manila papers and symbology for the various land use and land cover types agreed upon. The objectives of the project and PGIS were discussed and roles assigned according to the various age groups and all sketching details explained to the participants.
Data were collected using the FGDs, consisting of 12 members. During the groups formation, a resource mapping exercise was also carried out.. Most of the studies on social economic dynamics as well as natural resources management employ FGDs (Odimegwu, 2000). Mapping involved sketching mental LULCC maps for 1994, 2004 and 2014: a period of 20 years divided in two periods with a 10-year interval was considered large enough to detect changes within locals. Mental maps graphically represent and conceptualise Local community perceptions and understanding of the LULCC that have taken place. The maps incorporate their knowledge and experience of their environment, accumulated over the years they have interacted with their environment. Further, Vernooy et al. (2000) observed that participatory mapping represent also graphically the community’s perception on how they look at and use their environment.
Key participants involved the elderly, who showcased the land use as it was in their original state and how it changed over the years to the current state. Two PGIS sessions were conducted, in Pakasse and Entasopia sub-locations. Once the maps were drawn, discussions were carried out focusing on the accuracy of the mental maps for Pakasse and Entasopia and modifications were made until there was consensus among the participants. Similar procedures were followed by Aynekulu et al. (2006). The main land uses inserted in the maps included cropland, forestland, bareland, open water, swamps and grasslands and settlements.
Field surveys with representatives of the local groups were conduct to undertake ground truthing exercise in order to georeference the mental maps using GPS. These maps were then digitized using ArcGIS10.2 in order to convert different land use classes as mapped by the locals into either points, lines or polygons to visually display the changes detected. The area covered by each LULCC was calculated using spatial analyst tool in ArcGIS 10.2. this was later subjected to excel to calculate the extent and magnitude of change for the periods 1994-2004, 2004-2014 and overall change from 1994 to 2014.
The comparison of the land use land cover statistics assisted in identifying the percentage change between 1994 and 2014.In achieving this, the first task was to develop a table showing the area under each land use category and the percentage change for each year (1994, 2004 and 2014) measured against each land use land cover type. Percentage change to determine the change in land use was calculated by dividing observed change by the original area multiplied by 100.
Chi-square goodness of fit was used to determine if there were significant changes in land use and land cover (Zar, 1996). Prevailing issues on land and water resources were discussed and suggestions on the strategies for mitigating the negative impacts emerging from land use change was discussed by the various groups.
Trends in Land use and land cover change in Pakasse and Entasopia
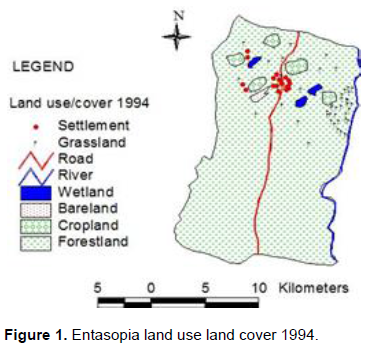
Significant land use changes were recorded for all land use categories in Entasopia (Figure 1 and Tables 1 and 2). The area of each land use and land cover category for the three time periods and their percentage changes for both Entasopia and Pakasse were analysed as shown in Tables 1 and 2 and Figures 2 to 6, respectively.

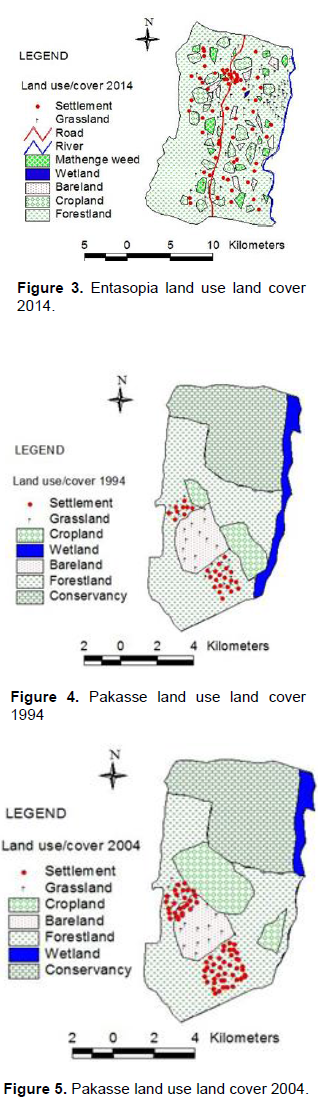

In Pakasse (Table 1) between 1994 and 2001, major changes were observed mainly in cropland and wetland. In the subsequent period, 2004 and 2014 major changes occurred in Grassland, Bareland and wetlands again. While forest cover decreased by 4.3% by 2004 it increased by 22.47% by 2014. The overall change in forest cover for the three time periods was a 17.17 increase. The area under cropland increased by 40.66% in 2004 and decreased by 63.73% in 2014. The overall change in cropland was however a decrease by 48.98%. Areas occupied by grassland and bareland increased throughout the three time periods with an overall increase of 1757.1 and 188.05% respectively. Area occupied by wetland decreased steadily throughout the study period recording an overall reduction of 97.86%.
There was an increase in settlements in 2004 by 14.22% and a reduction of 30.07% by 2014. There was however an overall reduction by 20.84% over the three periods under investigation. Results indicate that cropland increased at the expense of forestland. Similarly as forestland increased cropland reduced. Settlements also showed a similarly trend as cropland that is, settlements increased as croplands increased. This is an indication that irrigated cropping attracted a lot of settlements in Pakasse sub-location and when the irrigation water could not sustain cropping the inhabitants moved out to other potential areas leading to a reduction in settlement area.
In Ethiopia (Table 2), majorc hanges were observed in almost all the land use and land cover categories except for Forestland and Wetland and areas covered by the Mathenge bush, Prosopis juliflora. In 2004, results showed increases in Cropland, grassland, settlements and bareland by 138.60, 125.38, 74.28 and 122.91, respectively. However in 2014, the same increased by 214.62, 49.05, 256.55 and 565.42 respectively. Areas occupied by Forestland and Wetland decreased in 2004 by 15.14 and 62.5% and in 2014 decreased by 72.86 and 73.33%, respectively. Mathenge bush, P. juliflora showed decline in 2004 by 86.44% and in 2014 the area had increased by 565.4%.
To determine whether the observed land use land cover changes were significant, results of chi square goodness of fit test are shown in Tables 3 and 4 for both Entasopia and Pakasse sub-locations. For Pakasse (Table 3) the most significant changes (p<0.01) were observed in Forestland, grassland and bareland. The changes in cropland, wetland, and settlement were not significant. Even though wetlands indicated the highest percentage reduction this was not significant. In Entasopia (Table 4) significant changes (p<0.01) occurred for all land use and land cover changes except for areas occupied by wetland. Wetlands however showed the highest decline over the three time period with highest expansion recorded for grassland areas.

In the PGIS assisted analysis, the greatest land use change was observed in the conversion of Forestland to Cropland in Entasopia. Results showed that as cropland increased forestland decreased. This implies that there was more land being cleared for cropping. This study is supported by the decreasing trend in volume of wetland was also reported. The reduction in volume of wetland and river flows is attributable to water abstraction from the only source of wetlands for irrigation purposes in water scarce region. The decrease in volume of wetlands could also be attributed to clearing of vegetation. The original vegetation is slowly being overtaken by invasive species which has increase over the years. Mathenge (P. juliflora) is a very hardy bush originally from Central America. It was introduced in arid and semi-arid areas of the Horn of Africa in order to control erosion and contrast desertification. This plant has overtaken and replaced the original vegetation. The invasion of most parts of Pakasseby “Mathenge” weed is posing great challenge on the grazing land since 2014. The situation is aggravated by due to movement of herds from Tanzania to Shompole Market. Mathenge has covered almost all the grazing land leaving the people with no place to graze their livestock. The invasion of land by P. juliflora is perceived to expand as the crop is drought resistant.
Overall, water shortages are a major challenge in the Landscape, while measures to improve water availability are limited. Throughout the rest of the Landscape, water availability is severely limited, especially during the dry season. There is also tremendous increase of sprinkler irrigation in Entasopia and Nguruman sub-locations funded by African Development Bank under the project called Small Holder Horticulture Development Project (SHDP) which started in 2011 and is monitored by the Kenyan Ministry of Agriculture. Irrigation and domestic water for Nguruman sub-location comes from Oloibortoto Stream which drains into River Ewaso Ngiro. This stream also serves the entire Magadi soda company (TATA company). The locals perceive that in the next 10-20 years there will be more water scarcity resulting from increased droughts and water abstraction from the streams. This would also contribute to decline in cropping/farming and forests and increase the extent of bareland due to perceived abandonment of farming that could emerge from water scarcity.
However the trends in various land uses took a different trend in Pakasse Location as shown in. There were fluctuations reported in the extent of land use change with a reduction of forest land in 2004 and increasing by in 2014. These observations coincided with the same period cropland increased in 2004 and reduction in cropland in 2014 followed by increase in forestland. This is a clear indication that that there is a direct link between cropland and forestland. Increased as revealed by the PGIS study. Settlements showed similar trend with cropland, this implies that cropping attracted settlements. However bare land for the whole period of investigation this was similar to observations in Entasopia.
In Pakasse, the change in river courses was a major concern mention by locals especially for lower Pakasse stream and Ewaso Ngiro river. This is due to increased sedimentation carried to the streams that eventually blocks their courses. This has had impacts on the farming community causing them to move towards the upper part of pakasse to continue with irrigation farming using water from pakasse stream. Perhaps this could also explain the reason for fluctuating changes that occurred in forestland , cropland and settlement between 2004 and 2014 since the available supplies of water are not able to sustain irrigation forcing locals at one point to abandon farming leaving land fallow thus increasing the area of bareland and reverting to other livelihood options. This change in livelihood from farming to original pastoral livelihood could have contributed to some level of restoration of forested areas. Private conservancy which was unique land use observed in Pakasse maintained status quo. The latter implies that the type of land ownership has implications on land use change. The overall change observed in both sub-locations Pakasse sublocation clearly indicate a direct link between forestland, cropland, and settlement.
The findings of this study show that underlying drivers of LULCC are specific to a location as was revealed by other similar studies elsewhere (Geist and Lambin 2002; Leper et al., 2004). The key drivers of land use change in Entasopia and Pakasse fall into two categories mentioned by Framer et al. (2006) namely mega drivers and environmental factors. The mega driver in this case is crop agriculture while environmental factors include prevailing climatic e.g. rainfall and temperature and demographic factors that is, population increase (Tables 5 and 6). These findings are supported by Mbaaru and Gachene (2015). The prevailing climatic conditions have brought about changes in livelihood from pastoralism to agro-pastoralism. Unpredictable climatic conditions certainly have an impact on pasture production and sustainability for pastoral livelihoods. This explains the gradual change from pastoralism to agro-pastoral systems to meet basic livelihood requirements. The change to agro-pastoralism has also contributed to impact of water resources due to the practice of commercial agriculture using irrigation water from the streams and rivers in the already water scarce catchment.

In addition, increased irrigation farming is driven by both climatic factors and economic factors. There is an increasing demand for horticultural crops from the region and these have been identified as key determinants of land use change in the area. In both Entasopia and Pakasse, there has been a huge influx of immigrants mainly aiming at purchasing or leasing land for farming under irrigation. This has subsequently affected land cover especially clearing of forestland for settlement and farming.
PGIS practice as used in this study provided a good opportunity for addressing participatory problems. Compared to other similar studies (Mbau et al., 2013; Aynekulu et al., 2006) the approach can facilitate the bottom transmission of information thus influencing the process of decision making using bottom up approach including gender representation by involving both men and women sketching the mental maps. This application of PGIS attempts to reduce the implementation of imposed solutions that do not represent or reflect public concerns. Wang et al 2008 indicated that PGIS is designed to reflect the local peoples spatial knowledge that can be integrated with modern technologies to empower local communities.
CONCLUSION AND RECOMMENDATION
The PGIS study also revealed that the main driver of land use change in the study area is irrigated crop agriculture. This has led to increased pressure on wetland ecosystems due to increased water abstraction for the rivers leading to reduced river flows over the years. Similarly expansion in cropland has led to clearing of more land to support agriculture. This has also contributed to reduction in river flow due to erosion and increased sedimentation.
The methods involved, in this chapter is a clear indication that the locals have good knowledge of changes occurring on their environments. The PGIS and forum discussions revealed that the locals in both Pakasse and Entasopia have observed changes in weather pattern e.g. drastic reduction in rainfall amounts and changing patterns and on the contrary there has been an increase in temperature. PGIS-based approaches provide residents with an opportunity to discuss and map their priority land use issues and to identify land use hotspots in a way that is not typically possible in a general public meeting. The participatory method provides not only the most recent LULC data but also provides data that could be verified by direct observation, and the possibility of meeting the land users, and exploring the nature of LULCC change, and its drivers and consequences. The locals through the PGIS forums recommend that there is need for tree planting campaigns and advocacy on the importance of forests, need for rainwater harvesting technologies including dam constructions to reduce pressure on streams and rivers at large.
Nguruman offers a good example of livelihood diversification within the landscape. There is good potential for livelihood differentiation through agriculture, but its expansion is limited by the amount of water available and by conflicting land uses. Water abstraction is not only for irrigation and domestic use. Magadi Chemicals uses the water from the same stream to support its workers and its industrial processes. The demand will increase in the coming years, which calls for better management of the catchment and especially sustainable use of water resource Locals also perceived that in the next 10-20 years as the population increase grazing and forest land would reduce significantly. Most of the land would be used for settlement due to continuous population increase. Crop production would significantly increase because more people are changing from pastoralism to agro-pastoralism. The current change of livelihood has negative impacts on the natural resource base. This calls for a multi-stake holder forum in formulating sustainable natural resource management strategies in the study area to innovation and social change.
The current PGIS study has promoted community understanding of the implications of resource use changes thus facilitating their participation in strategy setting and ownership of their contribution to environmental degradation. PGIS can be used for enhancing community awareness on the implications of the changing scenarios of land use and land cover and hence facilitates planning. Such knowledge increases local community capacity to participate in implementing strategies proposed. PGIS can be used to campaign for sustainable use of land resources and convince local communities to participate and uptake strategies implemented. It offers communities the opportunity to learn about resource use change, participate in their conservation and own problems irrespective of their age and level of education.
Participatory resource mapping is an approach that can be adopted by local governments to make access of information and transparency in local governance a reality. Furthermore, the process of making the maps, the questions raised and features chosen to be included on the maps through direct interaction with the community provide vital information that can in incorporated in management of land and water resources.
The author has not declared any conflict of interests.
REFERENCES
|
Aynekulu E, Wubneh W, Birhane E, Begashaw N (2006). Monitoring and Evaluating Land Use/Land Cover change using participatory geographic information system (PGIS tools: A case study of Begasheka watershed, Tigray, Ethiopia. Electron. J. Infor. Dev. Countr. 25(3):1-10.
|
|
|
|
Baaru MW, Gachene CKK (2016). Community empowerment through participatory resource assessment at Kathekakai settlement scheme, Machakos County, Kenya. Int. J. Sociol. Anthropol. 8(2):15-22,
|
|
|
|
Berkes F, Colding J, Folke C (2000). Rediscovery of Traditional Ecological Knowledge and Adaptive Management. Ecol. Appl. 10(5):1251-1262.
Crossref
|
|
|
|
Bernhardt ES, Palmer MA (2007). Restoring streams in an urbanizing world. Freshwater Biol. 52:738–751
Crossref
|
|
|
|
Bojorquez-Tapia LA, Brower LP, Castilleja G (2003). Mapping expert knowledge: Redesigning the monarch butterfly biosphere reserve. Conserv. Biol. 17:367-379
Crossref
|
|
|
|
Briggs J (2005). The use of Indigenous Knowledge in development: Problems and challenges. Progress Dev. Stud. 5(2):99-114.
Crossref
|
|
|
|
Brown G, Smith C, Alessa L (2004). A comparison of perceptions of biological value with scientific assessment of biological importance. Appl. Geogr. 24:161-180
Crossref
|
|
|
|
Campbell DJ, Gichohi H, Mwangi A, Chege L (2000). Land Use Conflict in Kajiado District, Kenya. Land Use Pol. 17(4):337-348.
Crossref
|
|
|
|
Chambers KJ, Corbett J, Keller CP, Wood CJ (2004). Indigenous Knowledge, Mapping, and GIS: A Diffusion of Innovation Perspective. Cartographica 39(3):19-31.
Crossref
|
|
|
|
Coast E (2002). Maasai socioeconomic conditions: A cross-border comparison. Hum. Ecol. 30(1):79-105.
Crossref
|
|
|
|
Di Gessa S (2009). Participatory mapping as a tool for empowerment: Experiences and lesson learnt from ILC network. International Land Coalition.
|
|
|
|
Geist HJ, Lambin EF (2002). Proximate causes and underlying driving of tropical deforestation. BioScience 52(2):143-150.
Crossref
|
|
|
|
Gichuki NN, Macharia JM (2006). Socio-economic dimensions of conservation of wetlands in African dry lands: A case study of River Ewaso Ngiro basin in southern Kenya.
|
|
|
|
GIZ (2014). Managing Prosopis juliflora for better (agro-) pastoral Livelihoods in the Horn of Africa (pp. 1–159). Paper presented at the Regional Conference on Managing Prosopis juliflora for better agro-pastoral Livelihoods in the Horn of Africa, Addis Ababa.
|
|
|
|
Griffiths T (2002). Guyana: Empowerment of indigenous peoples through participatory mapping. World Rainforest Movement Bulletin No. 62.
|
|
|
|
Homewood K, Trench PC, Kristjanson P (2009). Staying Maasai? Pastoral livelihoods, diversification and the role of wildlife in development pp. 369-408.
Crossref
|
|
|
|
IFAD (2009). Good practices in participatory mapping. A review prepared for international fund for agriculture, Rome, Italy.
|
|
|
|
Kathumo V, Gachene CKK (2012). Participatory GIS in Conserving Lower Tana River Forest (LTRF) Complex in Coastal Kenya: Participatory GIS Case study. Proceedings of a national workshop on Conservation of Lower Tana River Forest Complex held at Kenya Agricultural Research Institute on April 13th 2012.
|
|
|
|
Lepers E (2004). A synthesis of information on rapid land-cover change for the period 1981-2000. In: BioScience 55:115-124.
Crossref
|
|
|
|
Louis RP (2007). Can you hear us now? Voices from the Margin: Using Indigenous Methodologies in Geographic Research. Geogr. Res. 42(2):130-139.
Crossref
|
|
|
|
Mbau JS (2013). Land use and land cover changes and their implications for human-wildlife conflicts in the semi-arid rangelands of southern Kenya. J. Geogr. Reg. Plann. 6(5):193-199.
Crossref
|
|
|
|
McCall M (2004) Can participatory GIS strengthen local level planning? Suggestions for better practice. 7th International Conference on GIS for developing countries. University Technology Malaysia.
|
|
|
|
McCall MK (2005). Surveying Social and Environmental Conditions in Communities: Using RRA and PRA ITC and Universidad Tolima.
|
|
|
|
McCall, Michael K (2003). Seeking good governance in participatory-GIS: review of processes and governance dimensions in applying GIS to participatory spatial planning. Habitat Int. 27(4):549-573.
Crossref
|
|
|
|
Muchemi J, Crawhall N, Pedone G, Koinante J, Kiptum Y, Kuria K (2009). Kenya case study: Participatory 3-Dimensional Modelling; Published in African Indegenous Peoples" Workshop on effective use of Information Communication Technology (ICTs) in Environmental Advocacy, IPACC/CTA, Cape Town, South Africa.
|
|
|
|
Mustafa YM, Amin MSM, Lee TS, Shariff ARM (2005). Evaluation of Land Development Impact on a Tropical Watershed Hydrology Using Remote Sensing and GIS. J. Spatial Hydrol. 5(2):16-30.
|
|
|
|
Nabwire BB, Nyabenge M (2006). Community resource mapping in sustainable natural resource management: A case study of SW Uganda. Electron. J. Infor. Syst. Dev. Countr. 25(4):1-8.
|
|
|
|
Odimegwu C (2000). Methodological issues in the use of focus group discussion as a data collection tool. J. Soc. Sci. 4(2-3):207-212.
|
|
|
|
Palmer MA, Bernhardt ES, Allan JD (2005). Standards for ecologically successful river restoration. J. Appl. Ecol. 42:208–217.
Crossref
|
|
|
|
Sambalino F, Hulshof M, Borgia C, Tolk L, Kleinendorst T (2015). South Rift Landscape, Kenya: A baseline study part for the Horn of Africa Climate Change Programme, The Netherlands and Kenya
|
|
|
|
Sieber R (2006). Public Participation Geographic Information Systems: A Literature Review and Framework. Ann. Assoc. Am. Geographers 96(3):491-507.
Crossref
|
|
|
|
Troyer ME (2002). A spatial approach for integrating and analysing indicators of ecological and human condition. Ecological Indicators. USDA-NRCS, (1986). Urban Hydrology for small watersheds. USDA-NRCS Technical Release 55.
|
|
|
|
Vernooy R, Espinoza N, France L (2000). Participative mapping, analysis and monitoring of natural resources in a watershed.
|
|
|
|
Wang X, Z Yu, Cinde RS, Forrester J (2008) Enhancing participation: Experiences of PGIS in Shanxi Province, China. Appl. Geogr. 28(2):96-109
Crossref
|
|
|
|
Zar JH (1996). Biostatistical Analysis. Third Edition. Prentice-Hall. New Jersey. USA.
|