Full Length Research Paper
ABSTRACT
The improvement for a trait of interest can be achieved by both direct and indirect
selection of characters that are more heritable and easy to select. The aim of this study was to determine the degree and nature of associations among seed yield and seed quality related characters. One hundred eight garden cress (Lepidium sativum L.) genotypes were evaluated for their yield and seed quality related traits using a Randomized Complete Block Design with two replications at Raare of Haramaya University Research Site (HRS) and Kulumsa farmer field (KFF), Ethiopia during Meher season in 2014/2015. Correlation and path coefficient analysis were carried out to study the character association and contribution, respectively, for fourteen agro-morphological and seed quality traits. Character association analysis among yield and yield contributing characters revealed that most genotypic correlation coefficients were higher than the respective phenotypic correlation coefficients. Both phenotypic and genotypic correlations revealed that the majority of examined traits had highly significant positive correlation except for oil content and oleoresin content. Genotypic path coefficient analysis of harvest index, biomass per plant and grain yield per plant had exerted positive direct effect on grain yield per plot. Hence, the improvement in grain yield is efficient, if the selection is based on biomass per plant, grain yield per plant and harvest index at both locations.
Key words: Genotypic correlation, oil content, oleoresin content, phenotypic correlation, selection.
INTRODUCTION
Garden cress (Lepidium sativum L.), belongs to Brassicaceae Family, is a fast growing annual plant which is cultivated in the temperate and subtropical cold areas throughout the world for its food and medicine (Gokavi et al., 2004). It is also an aromatic plant which contains considerable amount of essential oil (Nigist and Sebsebe, 2009) and edible fatty oil rich in its medicinal properties. In addition to its medicinal value, garden cress is used in the form of vegetable (sprout) in North Africa, West and Central Asia and United Kingdom. The breeding program of garden cress relies on improvement of grain yield, oil content of the seeds, resistance to frost, disease and pests (Temesgen et al., 2013a,b; Sabaghnia et al ., 2015). The productivity of garden cress is very low; only 600 to 700 kg/ha in India (Sabaghnia et al., 2015) and 1691 to 3415 kg/ha in Ethiopia (Temesgen et al., 2013a). Hence, it requires the attention of plant breeders to evaluate different genotypes across diverse agro-ecological regions in order to obtain high yielding genotypes. Grain yield is the result of a number of complex morphological and physiological processes that interact with each other and with the environment at different growing stages (Semahegn, 2011). The improvement of landraces for grain yield is not only dependent on the nature and extent of genetic variability, heritability and genetic advance in the base population but also on the association of yield and yield-related traits with desirable biochemical composition (Said, 2012; Temesgen et al., 2013a; Sabaghnia et al., 2015). Since sufficient variability is available in the Ethiopian garden cress (Said, 2012; Temesgen et al., 2013a,b), initiating a robust breeding program with this economically important but under-utilized crop will substantially contribute to its genetic improvement, cultivation and utilization.
Genetic evaluation of large number of garden cress genotypes related to yield and seed quality related traits such as oil and oleoresin contents is of paramount importance. Measurement of simple correlation coefficient helps to identify the relative contribution of component characters towards yield (Panse, 1957). Simple correlation coefficients are not always effective in determining the real relationships among traits. Path coefficients show direct influence of independent variable upon dependent variable. It specifies the cause and effect relationship and measures the relative importance of each variable; therefore, path coefficient would provide a more meaningful interpretation of such association (Dewey and Lu, 1959; Mondal et al., 2011; Malek et al., 2014). It is, therefore, worthwhile to consider a large number of garden cress genotypes to make observations at several locations
So far, the study of interrelationships among yield and yield related components characterized with small number of accessions and/or in non-ideal environment of single location (Temesgen et al., 2013a; Said, 2012) make characterization inefficient demanding a large number of genotypes tested in two suitable apparent locations enable the genotypes to discharge its full potential. Therefore, the present study was undertaken to determine the degree and nature of associations among seed yield and seed quality related characters.
MATERIALS AND METHODS
Experimental procedure and data collection
The field experiment was carried out at two locations, namely Haramaya University Agricultural Research Site at Raare (HUARS) and Kulumsa farmer field (KFF) which is 3.4 km East of Kulumsa Agricultural Research Center, Ethiopia, in 2014/2015 growing season. One hundred eight garden cress accessions collected from different agro-ecological regions of Ethiopia were examined. The experiment was conducted in the Randomized Complete Block Design with two replications. Each experimental plot consisted of two 135 cm long rows with inter-row and between plant spacing of 20 and 15 cm, respectively. Fertilizers were applied at the rate of 18 kg/ha N and 46 kg/ha P2O5 and all necessary cultural practices were undertaken as recommended for the crop. On plant basis, data were recorded from five randomly selected competitive plants of each genotype characters namely plant height (PH), number of primary branches per plant (PB), number of secondary branches per plant (SB), grain yield per plant (GYPP), and biomass yield per plant (BYPP). On plot basis, traits such as days to flowering initiation (FI), days to 50% flowering (FL), days to maturity (DM), thousand seed weight (TSW), grain yield per plot (GYPlt), harvest index (HI), and biomass yield per plot (BMPlt) were recorded. The agronomic characters were taken after harvesting the plants. The oil content of the seed was determined at Holetta Highland Oil Crops Laboratory in Ethiopia (Guenther, 2007) while the oleoresin content was investigated at Wondo Genet Natural Product Laboratory, Ethiopia (Daniel et al., 2008).
Data analysis
Correlation coefficients
The correlation coefficients were calculated to determine the degree of association of characters with yield and among themselves. Phenotypic and genotypic correlations were computed by using the standard procedure suggested by Johnson et al. (1955), Singh and Chaudhary (1985) and Dabholkar (1992) using the following formula:
rgxy = [Covgxy/( (s2gxx s2gy )]
rpxy=[Covpxy/( (s2pxxs2py )].
where rpxy = phenotypic correlation coefficient between characters x and y, Covpxy = phenotypic covariance between characters x and y, s2px = phenotypic variance for character x and s2py = phenotypic variance for character y, rgxy = genotypic correlation coefficient between characters x and y, Covgxy = genotypic covariance between characters x and y, s2gx= genotypic variance for character x and s2gy = genotypic variance for character y. The coefficients of correlation were tested using ‘r’ tabulated value at n - 2 degrees of freedom, at 5 and 1% probability levels, where n is the number of treatments (genotypes) as described by Robertson (1959).
Path analysis
Path analysis was used for exhibiting the direct and indirect effects on seed yield according to the method suggested by Dewey and Lu (1959) using phenotypic as well as genotypic correlation coefficients as:
rij = pij + Æ©rikpkj
where rij = mutual association between the independent character i (yield-related trait) and dependent character, j (grain yield) as measured by the genotypic correlation coefficients, Pij = components of direct effects of the independent character (i) on the dependent character (j) as measured by the path coefficients, and ∑rikpkj = summation of components of indirect effects of a given independent character (i) on a given dependent character (j) via all other independent characters (k), where: I = any trait in the model, and r = correlation coefficient between any trait i and the dependent variable.
Data processing was done by MS Excel 2007. The contribution of the remaining unknown characters was measured as the residual effect as demonstrated by Singh and Chaudhary (1985). SPAR2.0 (IASRI, 2005) and META-R version 5 (Alvarado et al., 2015) statistical packages were used for analysis.
RESULTS AND DISCUSSION
Phenotypic and genotypic correlations
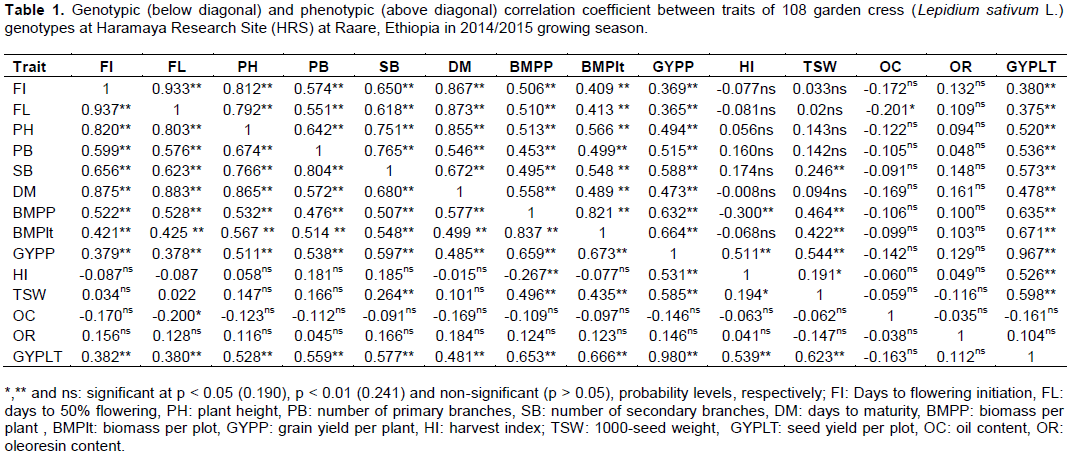
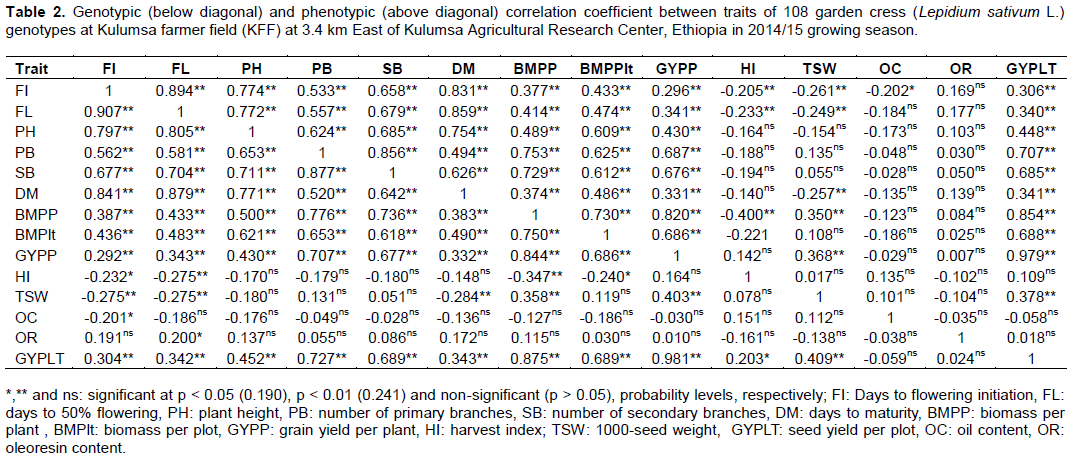
Estimates of genotypic and phenotypic correlation coefficients at Haramaya and Kulumsa environments are shown in Tables 1 and 2, respectively. The analysis of correlations in each location showed that genotypic correlation coefficients were generally higher than their corresponding phenotypic correlations indicating strong hereditary association among the traits due to genetic factors such as linkage and/or pleiotropic effect enabling consistent performance across wide range of environments as described by Waitt and Levin (1998). Similar findings were observed by Tahira et al. (2011) and Hasan et al. (2015) on the study of Brassica. Grain yield is a very complex character which is governed by polygenes and the result of numerous simple characters presumably showing considerable variations from one environment to another (Singh et al., 2014). The correlation between the traits may be due to linkage or pleiotropy (Allard, 1999) or environment (Aastveit and Aastveit, 1993). Similarly, a narrow difference between phenotypic and genotypic correlation coefficient was obtained for almost all the pairs of characters studied showing that masking or modifying effects of the environment was little demonstrating that the presence of an inherent association among these characters. Similar results were reported in barley (Azeb et al., 2016).
Correlations of grain yield with other traits
It was observed that majority of the phenotypic and genotypic correlation coefficients between examined traits were highly significant (p < 0.001) at both environments. Grain yield per plot showed highly and positively significant correlations with days to flowering initiation, days to 50% flowering, plant height, number of primary branches, number of secondary branches and biomass per plant. It was also positively and significantly correlated (p < 0.001) with biomass per plot, grain yield per plant and thousand seed weight at both environments. However, phenotypic correlation was not significant for harvest index due to higher biomass per plant at Haramaya and Kulumsa environments, respectively (Tables 1 and 2). Similar findings were reported for rapeseed where significantly positive association were found between grain yield per plot and days to flowering initiation and days to 50% flowering and number of primary branches (Gangapur et al., 2009; Temesgen et al., 2013a; Tesfaye et al., 2013; Halder et al., 2016).
At HRS, the highest and significant genotypic and phenotypic correlations between grain yield per plot and grain yield per plant were 0.980 and 0.967, respectively. Similarly, at KFF, positive and highly significant genotypic and phenotypic correlations were recorded for the same traits with the respective values of 0.981 and 0.979. In addition, genotypic and phenotypic correlations between grain yield and the following traits were positive and significant, respectively for number of primary branches (0.727 and 0.707), number of secondary branches (0.689 and 0.685), biomass per plot (0.689 and 0.688), and biomass per plant (0.875 and 0.854) at KFF (Table 2). Hasan et al. (2015) also reported that plant height, number of primary branches and grain yield per plant had positive and strong correlation with grain yield per plot in Brassica juncea. Along with these, at KFF, biomass per plant again showed positive and significant genotypic and phenotypic correlations, respectively with number of primary branches (0.776 and 0.753), number of secondary branches (0.736 and 0.729), and grain yield per plants (0.844 and 0.820) (Table 2). Similarly, in Indian mustard, significant genetic and phenotypic correlations were obtained between grain yield and grain yield per plant, number of primary and secondary branches per plant, biomass per plant, and thousand seed weight (Gangapur et al., 2009).
On the contrary, grain yield per plot exhibited a non-significant with oleoresin content with oil content. The findings were similar for both genotypic and phenotypic correlations at both environments. In contrary, Temesgen et al. (2013a) reported that oil content had significant positive correlation to grain yield probably due to the influence of the environment. Non-significant values of correlation coefficient were observed between oleoresin contents and most of the studied characters in both environments except for thousand seed weight and oil content indicating independence of traits in both environments.
Correlation among yield contributing traits
Significant genotypic and phenotypic correlations were observed respectively between days to maturity and days to 50% flowering (0.883 and 0.873), plant height and days to maturity (0.865 and 0.855), and biomass per plant and biomass per plot (0.837, 0.821) at HRS. Significantly, high and positive genotypic and phenotypic
correlations were obtained between number of primary branches and number of secondary branches (0.804 and 0.765, respectively) (Table 1). Similarly, at KFF, highly significant genotypic and phenotypic correlations were recorded, respectively between flowering initiation and days to 50% flowering (0.907 and 0.894), grain yield per plant and biomass per plant (0.844 and 0.820), days to 50% flowering and days to maturity (0.879 and 0.859), days to maturity and days to flowering initiation (0.841 and 0.831) and plant height and days to 50% flowering (0.805 and 0.772). Similar findings were reported by Temesgen et al. (2013a) and Islam and Haque (2015). These results are in agreement with the reports of Hasan et al. (2015) where plant height significantly and positively correlated with thousand seed weight, grain yield per plant and grain yield per plot while thousand seed weight was negatively correlated with grain yield per plant at genotypic level. They also reported that days to flowering has strong and significant positive phenotypic and genotypic correlation with days to maturity and number of primary branches in B. juncea.
It was also observed that oil content showed significant and negative correlation with flowering initiation, days to 50% flowering at KFF unlike at HRS. Even though, oil and oleoresin contents showed non-significant correlation with most traits at both locations (Tables 1 and 2). These results are in agreement with an earlier study (Beemnet et al., 2013) which reported on coriander accessions that essential oil and oil contents were non-significantly correlated with the majority of yield and yield related components such as plant height, thousand seed weight, days to maturity and grain yield per plant. Tesfaye et al. (2013) also reported days to flowering, days to maturity, plant height, number of primary and secondary branches biomass per plot non-significantly correlated with harvest index in their study of Brassica carinata. On the other hand, Temesgen et al. (2013a) in their study of 49 Ethiopian garden cress genotypes reported that majority of the examined traits showed significant and positive correlation with oil content. The negative correlation indicated that it would not be possible to improve both traits simultaneously depending on the linkage intensity or the degree of compromise between the two traits (Dabholkar, 1992). The oil and oleoresin contents will be disregarded in selection for grain yield improvement programs (Ariyo et al. 1987; Henry and Krishna, 1990).At both locations, five agro-morphological traits (namely, grain yield per plant, shoot biomass per plant, shoot biomass per plot, number primary branches per plant and number of secondary branches per plant) are significantly correlated among themselves. Hence, selection in the performance of one of the traits will result in the improvement of the other traits. However, such traits need further study on their direct and indirect effect on the grain yield per plot by path coefficient analysis to remark as selection criteria for grain yield improvement programs.
Genotypic path analysis
In the present study, grain yield per plot (GYPLt) was the dependent variable while other evaluated traits were considered as independent variables. Direct and indirect effects of these components were determined on grain yield and their contributions in each of the two environments are shown in Table 3. The path coefficient analysis at genotypic level revealed at HRS and KFF, respectively that biomass per plant (1.143 and 0.996) had the highest positive direct effect on yield followed by harvest index (0.694 and 0.274) and grain yield per plant (0.171 and 0.134). Similarly, harvest index and grain yield per plant had highly significant and positive correlations with grain yield in each location at genotypic level, indicating the need for direct selection for these traits in order to improve grain yield of garden cress. At HRS, the highly significant direct correlation of grain yield with days to flowering initiation (0.126), with plant height (0.274) and with number of secondary branches (0.182) (Table 3) shows the usefulness of selecting of these traits for grain yield improvement. Similar findings were reported by Temesgen et al. (2013a) on their study with the Ethiopian garden cress. However, Hasan et al. (2015) indicated that plant height had negative direct effect while grain yield per plant had strong positive and direct effect on grain yield of Brassica napus at genotypic level indicating correlation of traits varied depending on the environment and nature of the crop.
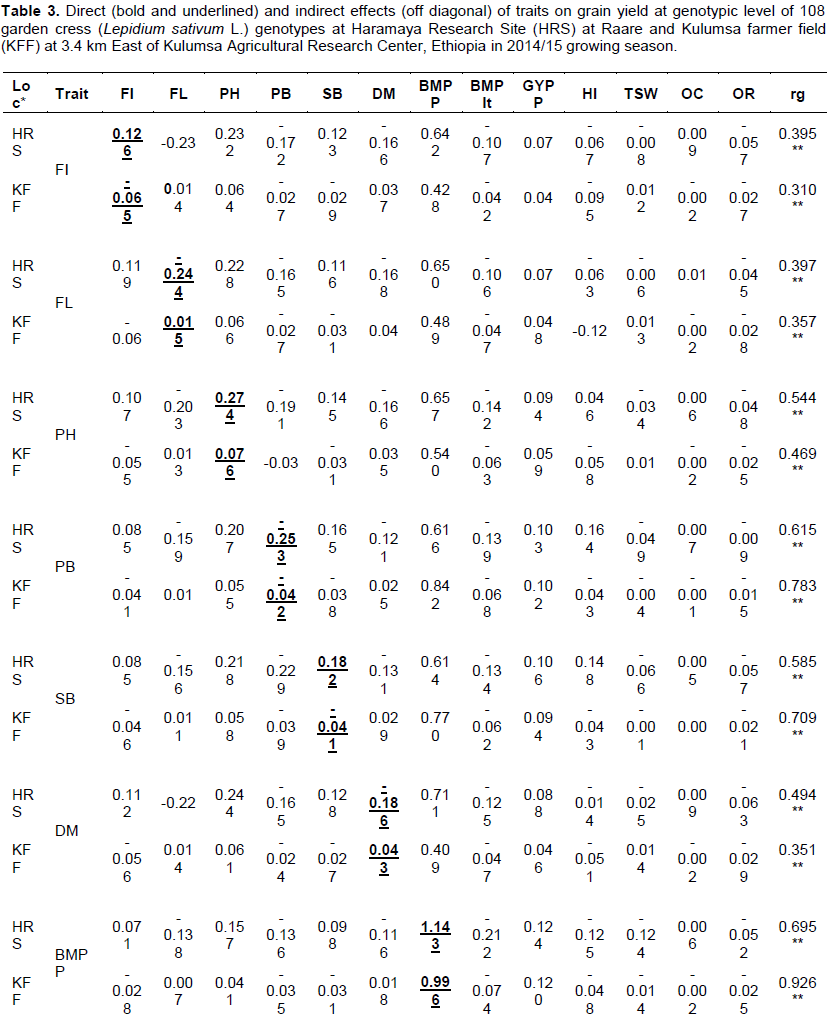
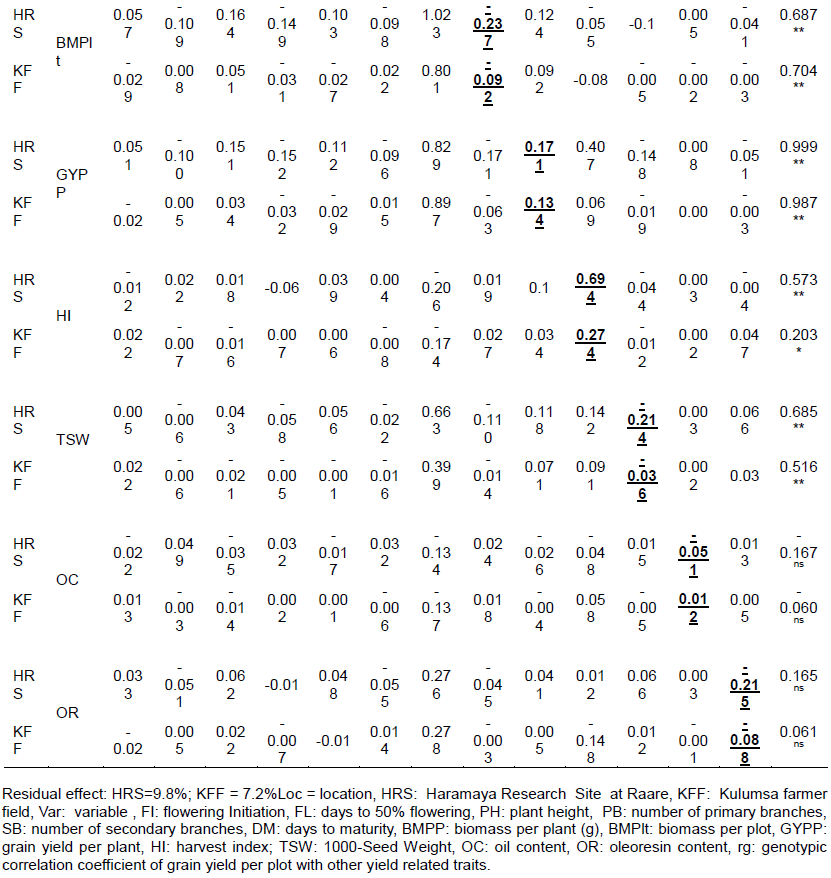
It was observed that plant height, days to maturity and oil content exhibited positive and relatively low direct effect on yield at KFF (Table 3). These traits except for oil content had highly significant positive correlation with grain yield in an earlier study (Temesgen et al., 2013a). On the contrary, the number of primary branches, biomass per plot, thousand seed weight, and oleoresin content were negative and low direct effect for grain yield in both locations. Days to 50% flowering and days to maturity at HRS and days to flowering initiation and number of secondary branches at KFF had negative and low direct effect to grain yield but positive and significant correlation with grain yield except for oleoresin content which was non-significant (Table 3). These implied that almost all of these traits might probably contribute for grain yield through indirect effects requiring indirect selection. Halder et al. (2016) demonstrated similar high positive direct effect of plant height, thousand seed weight, and days to 50% flowering on grain yield/ha. These results are also in agreement with Marjanovic Jeromela et al. (2008) and Halder et al. (2016) who reported that plant height exerted the highest positive significant direct effect on grain yield. In the study of rapeseed, Uddin et al. (2013) and Ara et al. (2013) also reported significant direct effect from primary branches per plant and number of secondary branches per plant on grain yield.
Traits such as days to flowering initiation, days to 50% flowering, plant height, number of primary and secondary branches, days to maturity, biomass per plot, grain yield per plant and thousand seed weight exerted indirect effects on grain yield via biomass per plant in both environments (Table 3). This demonstrated that the relationship between these traits and grain yield in the two environments were predominantly due to indirect effects. Harvest index showed relatively higher negative indirect effect to grain yield through biomass per plant. According to Temesgen et al. (2013a), all investigated traits showed direct effects to grain yield except for days to 50% flowering and plant height which revealed indirect effect. This was probably due to the type of genotypes used in the study and environmental factors that could also substantially contributed for the deviation of the result.
Generally, the direct and indirect impact of traits in path analysis in each location depicted considerable variation. This was presumably due to significant differential performance across location which resulted in substantial changes in the direction and magnitude of genotypic correlations (Table 3). Accordingly, the grain yield per plot of garden cress can be increased by selecting genotypes having higher biomass per plant, harvest index and grain yield per plant at both environments and higher plant height and number of secondary branches at HRS. This is in agreement with earlier work on lentil by Hegazy et al. (2012). As shown in Table 3, most traits at both locations exerted their indirect effect to increased grain yield through biomass per plant. Similar findings were reported from B. juncea (Hasan et al., 2015).
Path coefficient analysis revealed that biomass per plant, harvest index, and grain yield per plant had high positive direct effects on yield at both environments and plant height, flowering initiation and number of secondary branches showed direct and significant contributions to grain yield at HRS unlike at KFF. A higher positive indirect contribution by most of the yield components via biomass per plant was responsible for highly significant genotypic and phenotypic correlation coefficients. It could be said that biomass per plant, harvest index, and grain yield per plant were consistent and the most important traits affecting the yield per plot of garden cress. Thus, due attention must be given to these traits in the selection program. Along with these, days to flowering initiation, days to 50% flowering, plant height, number of primary and secondary branches, days to maturity, biomass per plot, and thousand seed weight contributed indirectly to grain yield at both locations. Therefore, including these traits directly or indirectly in the selection criteria is important towards developing high grain yielding garden cress genotypes.
In the present study, residual effect at HRS and KFF were 0.098 and 0.072, respectively (Table 3). This means, characters in the path analysis expressed in grain yield contributing traits by 90.2% at HRS and 93.8% at KFF, while the remaining needs additional characterization for the future breeding program.
CONCLUSIONS
The genotypic correlation coefficient was generally higher than the corresponding phenotypic correlation coefficient. Genotypic and phenotypic correlations between grain yield and majority of investigated traits were highly significant at each location except oil and oleoresin contents. Plant height, days to flowering initiation and number of secondary branches had high direct contribution to the grain yield at HRS unlike at KFF. Genotypic path coefficient analysis revealed that biomass per plant, grain yield per plant, and harvest index had relatively higher positive direct effect on grain yield in each location. In general, this study has clearly indicated the need for focusing on biomass per plant, grain yield per plant, and harvest index traits towards improving grain yield of garden cress.
CONFLICT OF INTERESTS
The authors have not declared any conflict of interests.
REFERENCES
|
Aastveit AH, Aastveit K (1993). Effects on genotype environment interactions on genetic correlation. Theoretical and Applied Genetics 86:1007-1013. |
|
|
Allard RW (1999). Principles of Plant Breeding. 2ndedition, John Willey and Sons, Inc., New York. |
|
|
Alvarado G, Lopez M, Vargas M, Pacheco A, Rondriqrez F, Burgueho J, Cross J (2015). META-R (Multi Environment Trial Analysis with R) for windows version 5 CIMMYT, Mexico. |
|
|
Ara S, Afroz S, Noman MS, Bhuiyan SR, Zia IK (2013). Variability, correlation and path analysis in F2 progenies of inter-varietal crosses of Brassica rapa. Journal of Environmental Sciences and Natural Resources 6(1):217-220. |
|
|
Ariyo OJ, Aken'ova ME, Fatokun CA (1987). Plant character correlation and path analysis of pod yield in okra (Abelmoschusesculentus). Euphytica 36:677-686. |
|
|
Azeb H, Sentayehu A, Mandefro N, Ermias A (2016). Correlation and path coefficient analysis of yield and yield associated traits in barley (Hordeum vulgare L.) germplasm. Advances in Crop Sciences Technology 4(2):1-9. |
|
|
Beemnet M, Alemaw G, Tesfaye B (2013). Correlation studies and path coefficient analysis for seed yield and yield components in Ethiopian coriander accessions. African Crop Science Journal 21(1):51-59. |
|
|
Dabholkar AR (1992) Elements of biometrical genetics. Concept Publishing Company, New Delhi, India. |
|
|
Daniel B, Solomon A, Wossen K (2008) Laboratory manual for plant product analysis. Ethiopia. Technical Manual 1(23):3-10. |
|
|
Dewey DR, Lu KH (1959). A correlation and path coefficient of components of crested wheat grass seed production. Agronomy Journal 51:515-518. |
|
|
Gangapur D, Prakash BG, Salimath PM, Ravikumar RL, Rao SL (2009). Correlation and path analysis in Indian mustard (Brassica juncea L. Czernand Coss). Karnataka Journal of Agricultural Sciences 22(5):971-977. |
|
|
Gokavi SS, Malleshi NG, Guo M (2004). Chemical composition of garden cress (Lepidium sativum L.) seeds and its fractions and use of bran as a functional ingredient. Plant Foods for Human Nutrition 59:105-111. |
|
|
Guenther E (2007). The Essential Oils - Vol 1: History, Origin in Plants, Production, Analysis. Jepson Press. |
|
|
Halder T, Bhuiyan SR, Islam, MS, Hossain J (2016). Analysis of relationship between yield and some yield contributing characters in few advanced lines of rapeseed (Brassica rapa) by using correlation and path analysis. International Journal of the Bioflux Society 8(1):36-44. |
|
|
Hasan EU, Bibi MH, Mahmood T, Tanveer M, Kalyar A, Salim J (2015). Genetic evaluation and characterization for yield and related traits in mustard (Brassica juncea). Research Journal of Agriculture and Environmental Management 4(2):082-087. |
|
|
Hegazy RE, Selim T El-Emam EA (2012). Correlation and path coefficient analyses of yield and some yield components in lentil. Egypt Journal of Plant Breeding 16 (3):147-159. |
|
|
Henry A, Krishnna GV (1990). Correlation and path coefficient analysis in pigeon pea. Madras African Journal 77(9-12):443-446. |
|
|
Indian Agricultural Statistics Research Institute (IASRI) (2005). Statistical Package for Agricultural Research (Windows Version) SPAR 2.0. IASRI, Library Avenue, New Delhi |
|
|
Islam MS, Haque MM (2015). Estimation of genotypic and phenotypic coefficients variation of yield and its contributing characters of Brassica rapa L. American-Eurasian Journal of Agriculture and Environmental Sciences 15(10):2029-2034. |
|
|
Johnson HW, Robinson HF, Comstock RE (1955). Estimation of genetic and environmental variability in soybean. Agronomy Journal 47:314-318. |
|
|
Malek MA, Rafii Y, Afroz M, Sharmin S, Nath UK, Mondal MMA (2014). Morphological characterization and assessment of genetic variability, character association and divergence in soybean mutants. The Scientific World Journal 2014:1-12. |
|
|
Marjanovic-Jeromela A, Marinkovic R, Mijic A, Zdunic Z, Ivanovska S, Jankulovska M (2008). Correlation and path analysis of quantitative traits in winter rapeseed (Brassica napus L.). Agriculture Conspectus Sciences 73(1):13-18. |
|
|
Mondal MA, Hakim MA, Juraimi AS, Azad M (2011). Contribution of morpho-physiological attributes in determining yield of mung bean. African Journal of Biotechnology 10:12897-12904. |
|
|
Nigist A, Sebsebe D (2009). Aromatic Plants of Ethiopia. 1st Ed. Shaama Books, Addis Ababa, Ethiopia. |
|
|
Panse VG (1957). Genetics of quantitative characters in relation to plant breeding. Indian Journal of Genetics 17:318-328. |
|
|
Robertson A (1959). The sampling variance of the genetic correlation coefficient. Biometrics 15:469-485. |
|
|
Sabaghnia N, Ahadnezhad A, Janmohammdi M (2015). Genetic variation in garden cress (Lepidium sativum L.) germplasm as assessed by some morphological traits. Genetic Resources and Crop Evolution 62:733-745. |
|
|
Said M (2012). Genetic diversity study of Lepidium sativum L. populations from Ethiopia using morphological characters and ISSR markers. MSc. Thesis, Addis Ababa University. |
|
|
Semahegn Y (2011). Genetic variability, correlation and path analysis studies in Ethiopian mustard (Brassica carinata A. Brun) genotypes. International Journal of Plant Breeding and Genetics 5(4):328-338. |
|
|
Singh JL, Prasad C, Madakemohekar AH. Bornare SS (2014). Genetic variability and character association in diverse genotypes of barley (Hordeum vulgare L.). The Bioscan (Supplement on Genetics and Plant Breeding) 9(2):759-761. |
|
|
Singh RK, Chaudhary BD (1985). Biometrical methods in quantitative genetic analysis. Revised, Kalyani Publishers, Ludhiana, New Delhi, India. |
|
|
Tahira T, Mahmood MS, Tahir U, Saleem M, Hussain MS (2011). The estimation of heritability, association and selection criteria for yield components in mustard (Brassica juncea). Pakistan Journal of Agricultural Sciences 48(4):251-254. |
|
|
Temesgen B, Mebeaselassie A, Million E (2013a). Genetic variability and association among yield, yield related traits and oil content in Ethiopian garden cress (Lepidium sativum L.) genotypes. Journal of Plant Breeding and Crop Sciences 5:141-149. |
|
|
Temesgen B, Mebeaselassie A, Million E (2013b). Genetic divergence analysis of garden cress (Lepidium sativum L.). Journals of Plant Breeding and Crop Sciences 5:770-774. |
|
|
Tesfaye W, Adugna W, Tsige G (2013). Correlation and path coefficient analysis among yield component traits (Brassica Carinata A. Brun) in Ethiopian mustard at Adet, Northwestern, Ethiopia. International Journal of Cereals and Oilseeds 1(1):01-16. |
|
|
Uddin MS, Bhuiyan SR, Mahmud F, Kabir K (2013). Study on correlation and path coefficient in F2 progenies of rapeseed. Academic Journal Plant Sciences 6(1):13-18. |
|
|
Waitt DE, Levin DA (1998). Genetic and phenotypic correlations in plants: a botanical test of Cheverud's conjecture. Heredity 80:310-319. |
|
Copyright © 2024 Author(s) retain the copyright of this article.
This article is published under the terms of the Creative Commons Attribution License 4.0


