Full Length Research Paper
ABSTRACT
Genetic dissimilarity can be used to identify promising genotypes for cultivation in specific conditions. Thus, the objective of this work is to study the genetic dissimilarity among 35 genotypes of Coffea arabica in the Cerrado, under irrigation, using phenological data and multivariate statistics. Plant height, stem diameter, canopy diameter, number of orthotropic branch nodes, length of orthotropic branch internodes, length of primary plagiotropic branches, and average plagiotropic branch internode length were evaluated at 6, 12, 18 and 24 months after planting. Data were analyzed using Hierarchical Agglomerative Cluster Analysis and Principal Component Analysis. Three clusters were formed for each evaluation (6, 12, 18 and 24 months). At 6 months, the most distant group consisted of Yellow Catucaí 2SL, Araponga MG 1, Sacramento MG 1, 23 II, Yellow Catucaí 20/15 pit 479, Sarchimor MG 8840, IBC-Palma 2, and New Acauã genotypes. At 12 months, the most distant group consisted of Yellow Catucaí 2SL, Asa Branca, Sacramento MG 1, and Sarchimor MG 8840. At 18 months, the most distant group consisted of Yellow Catucaí 2SL, Tupi IAC 1669-33, 23 II, Red Obatã IAC 1969-20, Sacramento MG 1, and Sarchimor MG 8840. At 24 months, Yellow Catucaí 2SL was distinct from the other 34 genotypes. Phenological variables strongly contributed to genetic dissimilarity (>75%) and there was a positive correlation for most variables.
Key words: Environment, Coffea arabica L., phenology, multivariate analysis, genetic, dissimilarity.
INTRODUCTION
Coffee production has contributed significantly to economic and social development in Brazil and is of great importance to Brazilian agribusiness. Brazil has been the world's largest producer and exporter of coffee for over 150 years (Paiva et al., 2010). National productivity in 2018 was 1903.2 kg per hectare. In 2019, 1509.6 kg per hectare was estimated (CONAB, 2019).
The Brazilian coffee industry has undergone significant changes as crop has moved into the Cerrado areas, particularly in its production system (Oliveira et al., 2010). The Cerrado produces excellent quality coffee due to its two well-defined seasons: rainy summer and dry winter (Fernandes et al., 2012). In addition, controlled water stress can be used to standardize the flowering and ripening of fruits in the Cerrado (Guerra et al., 2005).
Brazil has 131 registered cultivars of Coffea arabica L. However, not all are able to adapt to different growing conditions and reach their productive potential. Botelho et al. (2010) point out that genotype with superior behavior in a certain environment may not behave satisfactorily under other conditions. Thus, it is necessary to improve and select genotypes to ensure that they express desired traits. The development of new cultivars is achieved through genetic improvement processes (Paiva et al., 2010), which require genetic variability in the population (Ivoglo et al., 2008). Evaluating progenies in several locations is an important step in the final phase of a plant breeding program. With this information, the interaction between genotype and environment can be determined. Additionally, when interactions exist, subsidies can be provided to encourage cultivation at specific sites (Pinto et al., 2012). By characterizing genetic divergence, efficiency in the selection of parents in breeding programs can be increased (Silva et al., 2013). In this process, hundreds to thousands of individuals are evaluated to identify superior and divergent genotypes for certain characteristics in order to design by recombination (Silva et al., 2016). The dissimilarity analysis is used to quantify genetic variability and the relative contribution of the variables to the genetic dissimilarity, allowing for the identification of promising combinations (Torres et al., 2015).
The genetic dissimilarity allows one to identify promising genotypes for breeding programs and to recommend for cultivation. Giles et al. (2019) verified genetic divergence among 34 genotypes of Coffea sp. and conclude that phenotypic variations occurred predominantly due to genetic causes. Thus, the objective was to study the genetic dissimilarity among 35 genotypes of C. arabica in the Cerrado, under drip irrigation, using phenological data and multivariate statistics.
MATERIALS AND METHODS
The experiment was conducted at the Ceres Campus of the Federal Institute Goiano, GO. The Ceres Campus is located in the center of Goiás in the São Patrício Valley (UTM: E = 649,582.00 m and N= 8,302,194.00 m), and is characterized by having flat relief, very deep eutroferric red nitosol, clay texture, and an altitude of 556 m. The climate, according to the classification of Köppen, is Aw type (tropical climate with wet and dry seasons- Tropical Seasonal, dry winter), with an average annual temperature of 25.4ºC (average minimum: 19.3°C; average maximum: 31.5°C). The annual precipitation is approximately 1700 mm.
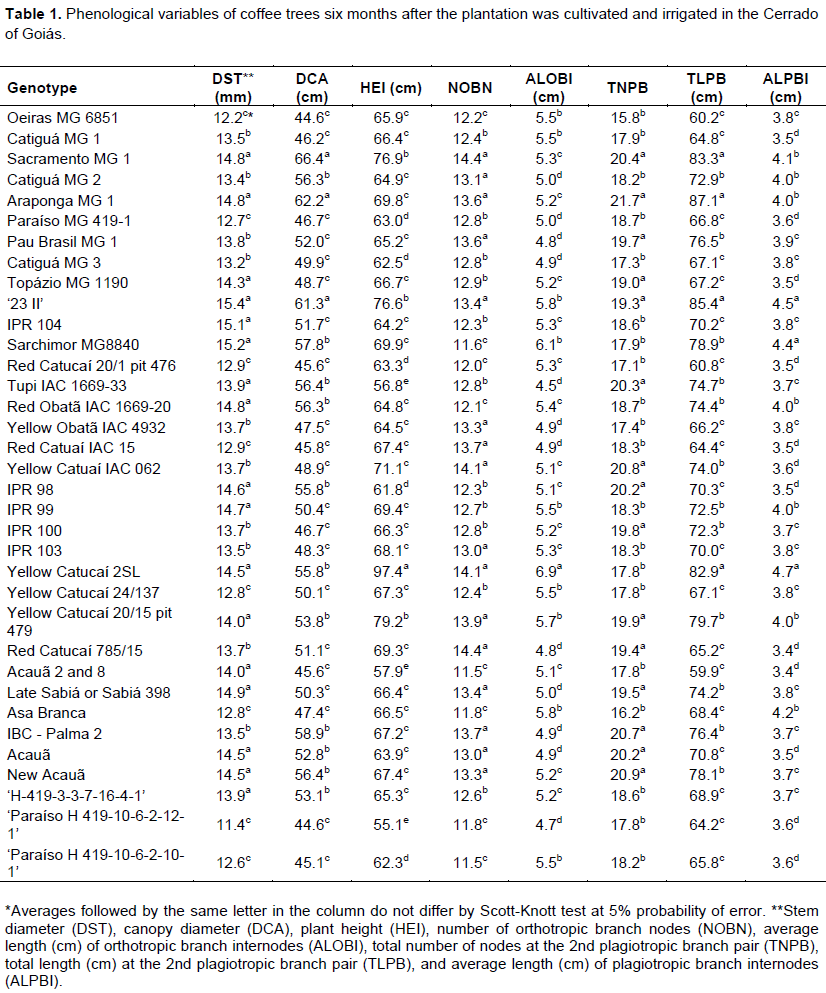
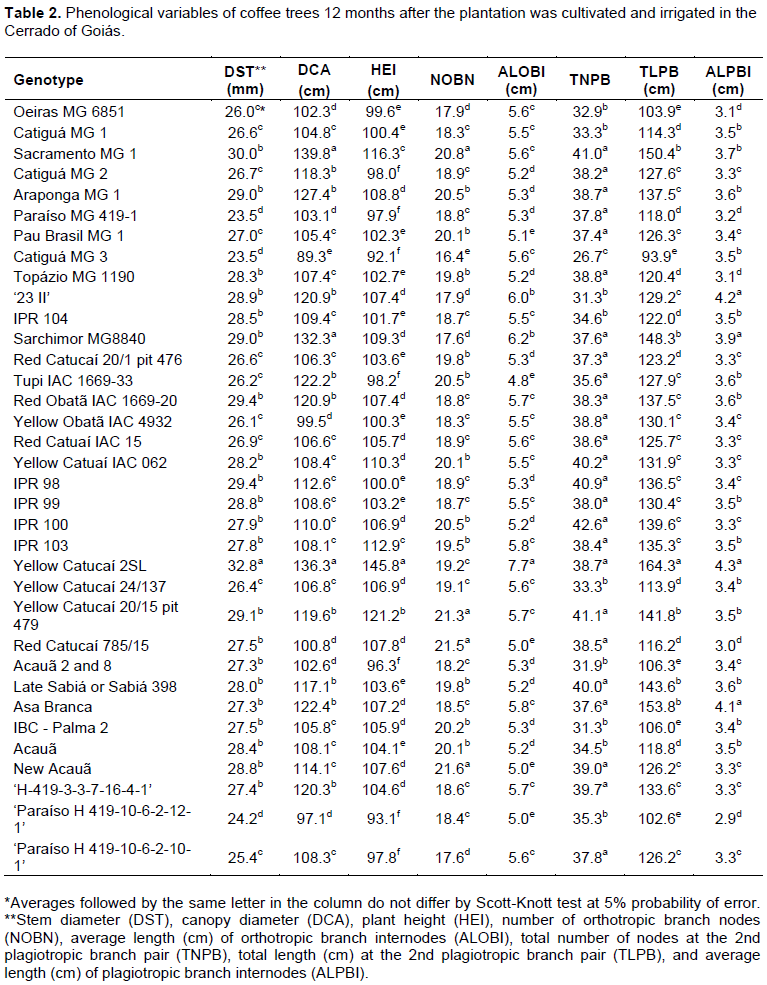
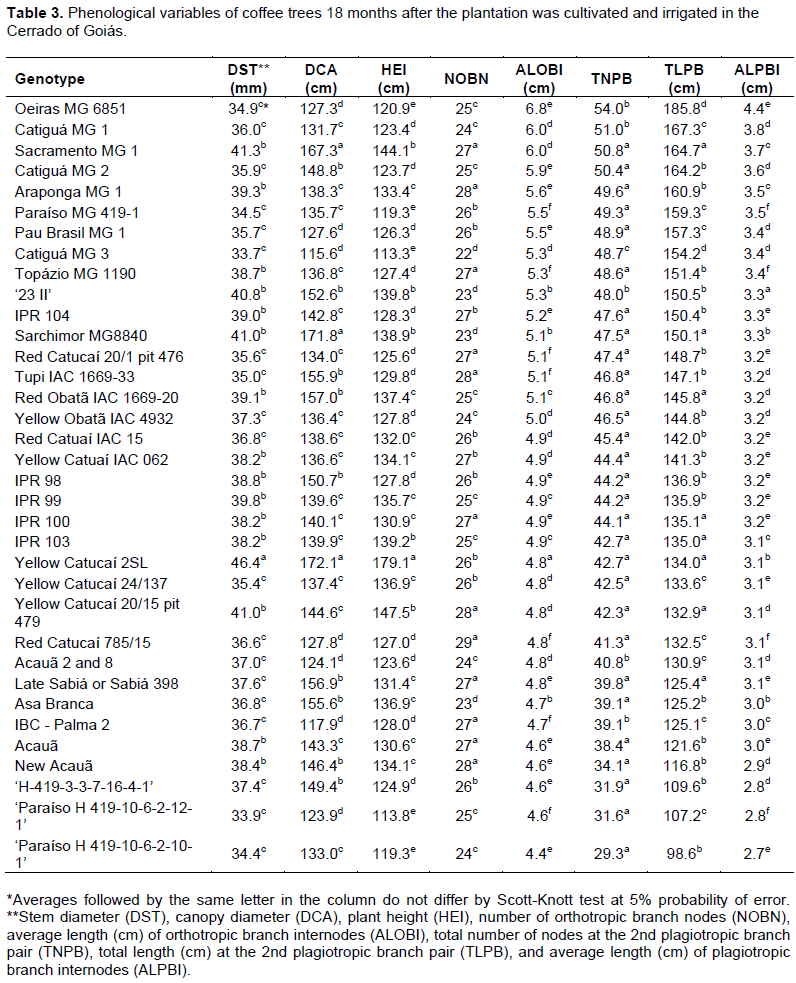
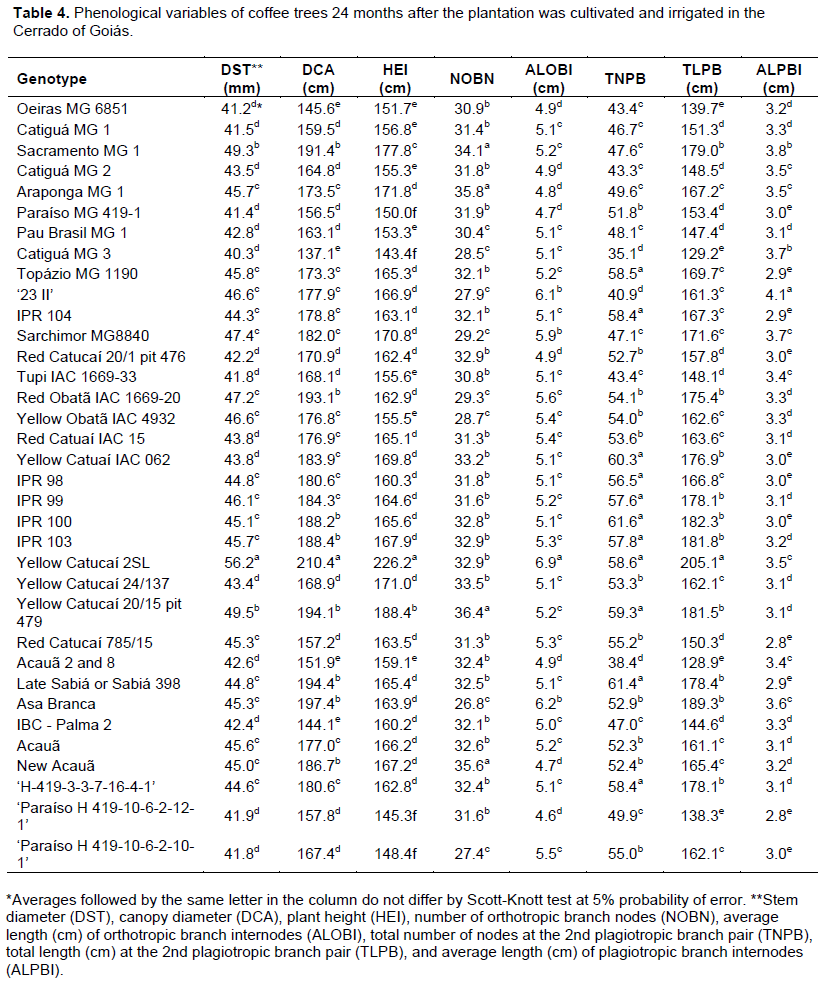
The experiment was conducted on April 8, 2015 in a randomized complete block design. The experiment consisted of 35 treatments, 31 cultivars and 4 progenies (Table 1) with four replication and 10 plants that were placed 3.50 × 0.75 m apart. The eight central plants were considered for analysis. During the experiment, recommended management practices as fertilization, phytosanitary management and irrigation for the crop were followed. In the dry season, drip irrigation occurred on Mondays, Wednesdays, and Fridays to account for the need for the crop (Kc) and evapotranspiration in a class A tank. Fertilization was performed based on soil analysis results and recommendations of the 5th approximation of the Soil Fertility Commission of the State of Minas Gerais (Guimarães et al., 1999). At 6, 12, 18 and 24 months after planting, stem diameter (DST), canopy diameter (DCA), plant height (HEI), number of orthotropic branch nodes (NOBN), average length (cm) of orthotropic branch internodes (ALOBI), total number of nodes at the 2nd plagiotropic branch pair (TNPB), total length (cm) at the 2nd plagiotropic branch pair (TLPB), and average length (cm) of plagiotropic branch internodes (ALPBI) were measured.
Data were analyzed using Analysis of Variance, F, and the Scott-Knott test at 0.05 of means for phenological parameters. Hierarchical Agglomerative Cluster (HAC) was used to examine dissimilarity by measuring average Euclidian distance. Additionally, Ward’s agglomeration method was used to obtain dendrograms and the Pearson’s method (n) for Principal Component Analysis (PCA) was used to obtain the correlation matrix and distance Biplot. Statistical analyses of genetic data were performed using the software XLSTAT 2014.5.03. The number of groups in the dendrogram was determined by the automatic truncation function, which attempts to create homogeneous groups (XLSTAT-MX, 2005).
RESULTS AND DISCUSSION
Coffee genotypes showed differences in phonological variables at 6, 12, 18, and 24 months after planting (Tables 1 to 4). Evaluations that occurred at 6 and 18 months after planting coincided with the end of the dry season, while evaluations that occurred 12 and 24 months after planting coincided with the end of the wet season. Temporal variability was observed in genotype behavior, as the growth of each material to diverse edaphoclimatic conditions differed among evaluations.
Meireles et al. (2009) state that various phenological phases of C. arabica are affected by environmental conditions, especially by photoperiodic variation and meteorological conditions (rainfall distribution and air temperature). In this experiment, the evaluations at 6 and 18 months after planting, in month October, of season rainy beginning and the photoperiod increasing, peaking in December. At 12 and 24 months after planting, month of April, the end of the rainy season and the photoperiod with short days, with minimum in June. Genetic diversity was observed between genotypes in the adaptability and interaction of the genotypes with the environment, so multivariate techniques were used to evaluate genetic divergence.
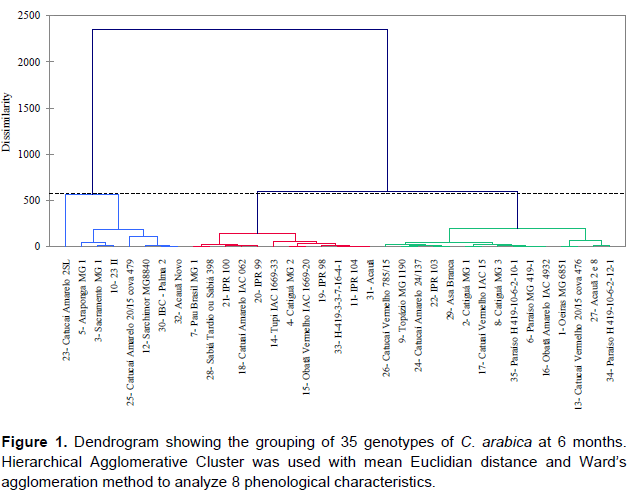
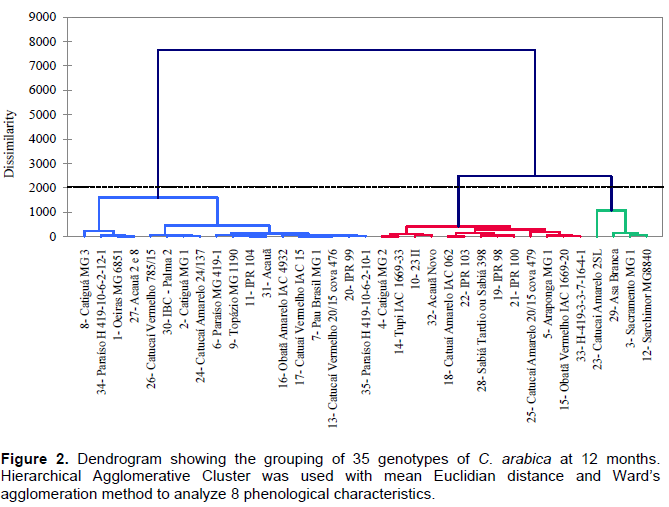
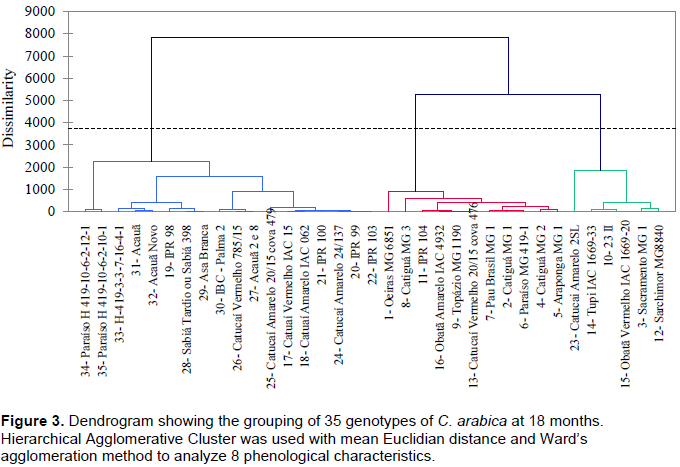
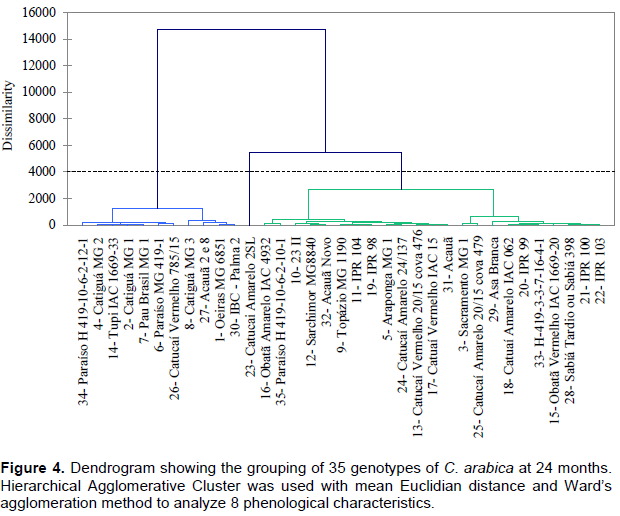
The 35 genotypes were clustered into three groups at each evaluation using Hierarchical agglomerative cluster analysis (Figures 1 to 4). Differences in genotypes were observed among groups for each evaluation. At 6 months, the most distant group consisted of Yellow Catucaí 2SL, Araponga MG 1, Sacramento MG 1, 23 II, Yellow Catucaí 20/15 pit 479, Sarchimor MG 8840, IBC-Palma 2, and New Acauã. At 12 months, the most distant group consisted of Yellow Catucaí 2SL, Asa Branca, Sacramento MG 1, and Sarchimor MG 8840. At 18 months, the most distant group consisted of Yellow Catucaí 2SL, Tupi IAC 1669-33, 23 II, Red Obatã IAC 1969-20, Sacramento MG 1, and Sarchimor MG 8840. At 24 months, Yellow Catucai 2SL was distinct from the other genotypes.
Genotype divergence in each group within and among evaluations may be associated with the interaction of the genotypes with the environment, as the environment may increase or decrease the genotype expression.
Fernandes et al. (2012) reported that coffee tree growth was highest in the hottest and rainy months, which would be October to April in this experiment, period in which we obtained better results of growth of the studied genotypes. In addition, longer days occur during this time, providing greater energy availability in the form of solar radiation and temperature (Camargo and Camargo, 2001). The number of groups formed by Ward's agglomerative method shows that there is wide variability among the evaluated genotypes. Guedes et al. (2013) verified genetic divergence among coffee trees of the Maragogipe germplasm in the Alto Paranaíba region of the State of Minas Gerais, using the Tocher method. This shows that the genetic divergence among coffee plants is mainly due to genetics, as recommended by Giles et al. (2019).
The cultivars Sacramento MG 1, Sarchimor MG8840, and Yellow Catucaí 2SL showed similar phenological traits and were included in the same group until 24 months, when Yellow Catucaí 2SL formed a new group.
This result may be attributed to the fact that this genotype had the highest averages for phenology traits (DST = 56.2 mm, DCA = 210.4 cm, HEI = 226.2 cm, ALOBI = 6.9 cm, TNPB = 58, 6, and TLPB = 205.1 cm) compared to the other genotypes. High phenology averages for Yellow Catucaí 2SL may be due to that fact that this cultivar is a hybrid (Icatu × Catuaí) and is highly adaptable, which is a known characteristic of 'Catuaí' (Botelho et al., 2010). However, densification between plants could have caused superior development of this cultivar. Pereira et al. (2011) found that the spacing between lines and between plants influenced the growth and architecture of Coffea arabica trees. However, this genotype-environment interaction is unique to this cultivar, since the other cultivars did not show the same pattern of development.
Three groups were identified at 6 months (Figure 1). Yellow Catucaí 2SL, Araponga MG 1, Sacramento MG 1, 23 II, Yellow Catucaí 20/15 pit 479, Sarchimor MG8840, IBC-Palma 2, and New Acauã formed the first group, which had the highest averages for most analyzed variables (DST, DCA, NOBN, TNPB, and TLPB). The second group consisted of the genotypes 7, 28, 21, 18, 20, 14, 4, 15, 19, 33, 11, and 31, which had the highest averages of phenological development for DST, NOBN, and TNPB. The third group, whichconsisted of treatments 26, 9, 24, 22, 29, 2, 17, 8, 35, 6, 16, 1, 13, 27, and 34, had the smallest number of significant variables, with DCA and TLPB showing homogeneity. At this stage of growth, the phenological variables that showed significant differences for most genotypes were DST, NOBN, and TNPB (Table 1).
The dendrogram for the evaluation at 12 months shows three groups that were divided into subgroups (Figure 2). The first group comprised 8, 34, 1, 27, 26, 30, 2, 24, 6, 9, 11, 31, 16, 17, 7, 13, 20, and 35 and had the smallest
averages for most variables, particularly HEI and TLPB. The second group had the highest average for TNPB and the lowest for HEI and consisted of treatments 4, 14, 10, 32, 18, 22, 28, 19, 21, 25, 5, 15, and 33. The third group was formed by Yellow Catucaí 2SL, Asa Branca, Sacramento MG1, and Sarchimor MG8840 cultivars. This group had the highest averages for most of the analyzed variables, especially DST, DCA, TNPB, TLPB, and ALPBI (Table 2).
The dendrogram of the 18-month evaluation had three groups (Figure 3). The first group had the lowest averages for ALOBI and ALPBI, but the TNPB variable had higher averages. This group consisted of genotypes 34, 35, 33, 31, 32, 19, 28, 29, 30, 26, 27, 25, 17, 18, 21, 24, 20, and 22. The second group consisted of genotypes 1, 8, 11, 16, 9, 13, 7, 2, 6, 4, and 5 and presented highest average for TNPB, whereas this group had the lowest averages for HEI, ALOBI, and ALPBI. The third group consisted of Yellow Catucaí 2SL, Tupi IAC 1669-33, 23 II, Red Obatã IAC 1669-20, Sacramento MG 1, and Sarchimor MG8840 and had the highest average values ​​for DCA, TNPB, and TLPB but the lowest averages for ALOBI. This group formed two subgroups when regrouped, one of which consisted of Yellow Catucaí 2SL, probably because it had high average values ​​for DST, DCA, HEI, ALOBI, TNPB, and TLPB (Table 3).
The first group formed in the 24th month dendrogram consisted of the treatments 34, 4, 14, 2, 7, 6, 26, 8, 27, 1, and 30 (Figure 4). This group had the lowest averages, particularly for DST, DCA, HEI, and TLPB. The second group consisted entirely of the genotype Yellow Catucaí 2SL. The third group consisted of the treatments 16, 35, 10, 12, 32, 9, 11, 19, 5, 24, 13, 17, 31, 3, 25, 29, 18, 20, 33, 15, 28, 21, and 22 and had the lowest averages for HEI and ALPBI, with only TNPB having a greater amount of significant averages (Table 4).
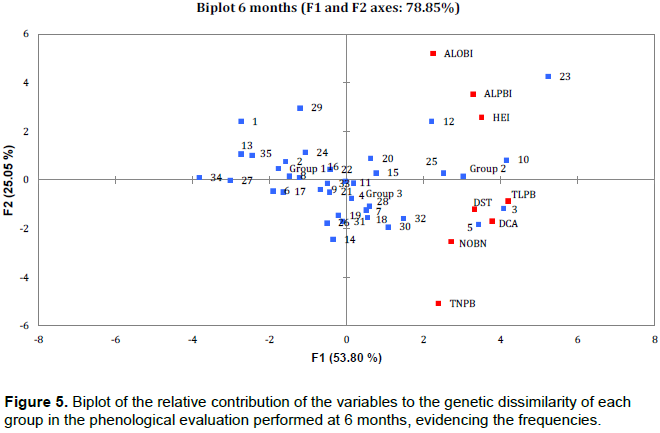
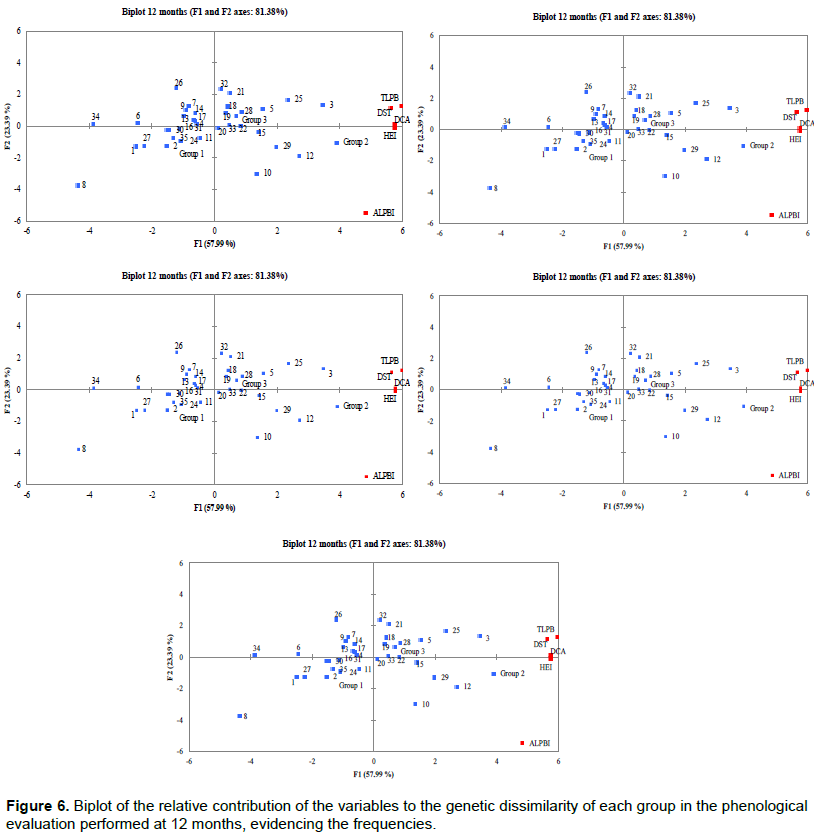
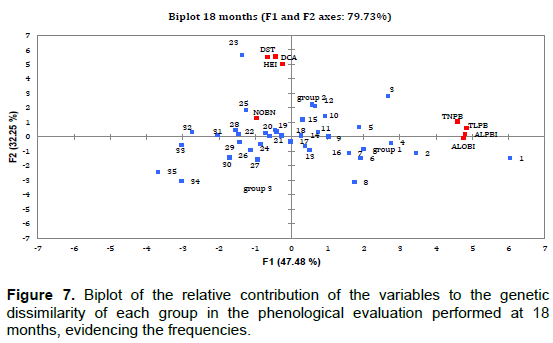
PCA results showed that the relative contribution of phenological variables to genetic dissimilarity (frequency) was 78.85% at 6 months (Figure 5), with the F1 component contributing 53.80% and the F2 component contributing 25.05%. For the second evaluation period (12 months), a frequency of 81.38% was observed (Figure 6) with F1 contributing 57.99% and F2 contributing 23.39%. At 18 and 24 months, the relative contribution was 79.73% (F1 = 47.48% and F2 = 32.25%) and 81.97% (F1 = 47.48% and F2 = 32.25%), respectively (Figures 7 and 8). Thus, variability in the contribution of phenological variables was observed mainly at 18 and 24 months. This could be due to a decrease in photo-assimilated reserves, causing a decrease in the growth rate of the plants, as they were in the process of filling the grains, which is considered to be a substantial photo-assimilates drain (Arantes et al., 2006).
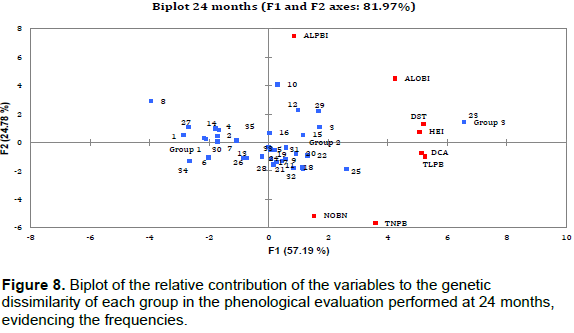
The PCA shows that there was a large contribution of the phenological variables to genetic dissimilarity (>75%) in the four evaluation periods. Rodrigues et al. (2013) verified that evaluation methods of productivity, stability, and adaptability, the harmonic mean of the genetic values, the relative performance of the genetic values, and the harmonic mean of the relative performance of the predicted must be part of the selection criteria for recommendation of genotypes of coffee for commercial plantations.
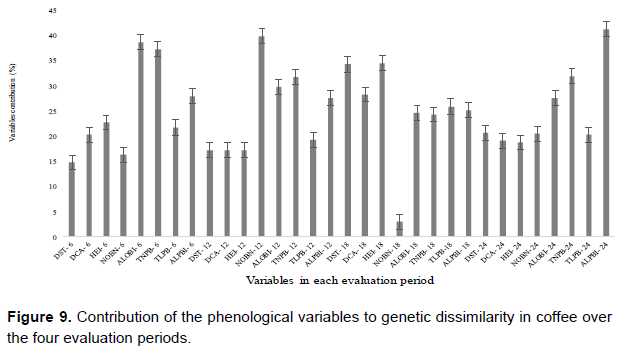
However, phenological patterns can vary within the same plant species if evaluated in different ecosystems, and variation can occur between populations, individuals, and years (Mantovani et al., 2003). Moreover, several factors can influence these phenological variations, such as exposure to light, leaf damage, water stress, or flower abortion. Thus, the influence of these factors on coffee phenology should be considered when examining a particular genotype in different regions and conditions. By analyzing the contribution rate of phenological variables over four evaluation periods (Figure 9), a contribution percentage equal to or greater than 25%was observed for: ALOBI, TNPB, and ALPBI at 6 months; NOBN, ALOBI, TNPB, and ALPBI at 12 months; DST, DCA, HEI, TLPB, and ALPBI at 18 months; and ALOBI, TNPB, and ALPBI at 24 months. ALPBI contributed throughout the four evaluation periods. Moreover, the greatest number of variables contributing ≥25% was observed for the 18 month evaluation, showing that this may be the best stage of development to evaluate genotypes and examine genetic divergence under edaphoclimatic conditions.
CONCLUSION
Genetic dissimilarity was evidenced between the 35 genotypes of C. arabica in the Cerrado, under drip irrigation, using phenological data and multivariate statistics. At 24 months after planting, the genotype Yellow Catucaí 2SL shows great dissimilarity. There was a large percentage of the contribution of phenological variables to genetic dissimilarity (> 75%), in the four evaluations.
CONFLICT OF INTERESTS
The authors have not declared any conflict of interests.
REFERENCES
|
Arantes KR, Arantes SACM, Faria MA, Rezende FC (2006). Desenvolvimento do cafeeiro (Coffea arabica L.) podado sob irrigação. Revista de Ciências Agro-Ambientais 4:75-66. |
|
|
Botelho CE, Rezende JC, Carvalho GR, Carvalho AM, Andrade VT, Barbosa CR (2010). Adaptabilidade e estabilidade fenotípica de cultivares de café arábica em Minas Gerais. Pesquisa Agropecuária Brasileira 45:1404-1411. |
|
|
Camargo AP, Camargo MBP (2001) Definição e esquematização das fases fenológicas do cafeeiro arábica nas condições tropicais do Brasil. Bragantia 60:65-68. |
|
|
CONAB- Companhia Nacional de Abastecimento. Acompanhamento da safra brasileira: café. v.5 - safra (2019) - n.2 - Segundo levantamento, maio 2019. Disponível em: |
|
|
Fernandes ALT, Partelli FL, Bonomo R, Golynski A (2012). A moderna cafeicultura dos cerrados brasileiros. Pesquisa Agropecuária Tropical 42:231-240. |
|
|
Guedes JM, Vilela DJM, Rezende JC, Silva FL, Botelho CE, Carvalho SP (2013). Divergência genética entre cafeeiros do germoplasma Maragogipe. Bragantia 72:127-132. |
|
|
Giles JAD, Ferreira AD, Partelli FL, Aoyama EM, Ramalho JC, Ferreira A, Falqueto AR (2019). Divergence and genetic parameters between coffea sp. genotypes based in foliar morpho-anatomical traits. Scientia Horticulturae 245:231-236. |
|
|
Guerra AF, Rocha OC, Rodrigues GC, Sanzonowicz C, Sampaio JBR, Silva HC, Araújo MC (2005). Irrigação do Cafeeiro no Cerrado: estratégia de manejo de água para uniformização de florada. Embrapa Cerrados - Comunicado técnico n 122, 4p. |
|
|
Guimarães PTG, Garcia AWR, Alvarez VVH, Prezotti LC, Viana AS, Miguel AE, Malavolta E, Corrêa JB, Lopes AS, Nogueira FD, Monteiro AVC Cafeeiro. In: Ribeiro AC, Guimarães, PTG, Alvarez VVH (1999). Recomendações para o uso de corretivos e fertilizantes em Minas Gerais, 5ª Aproximação. Comissão de Fertilidade do Solo do Estado de Minas Gerais. pp. 289-302. |
|
|
Ivoglo MG, Fazuoli LC, Oliveira ACB, Gallo PB, Mistro JC, Silvarolla MB, Toma-Braghini M (2008). Divergência genética entre progênies de café robusta. Bragantia 67:823-831. |
|
|
Mantovani M, Ruschel AR, Reis MS, Puchalski A, Nodari RO (2003). Fenologia reprodutiva de espécies arbóreas em uma formação secundária da floresta atlântica. Revista Árvore 27:451-458. |
|
|
Meireles EJL, Camargo MBP, Pezzopane JRM, Thomaziello RA, Fahl JI, Bardin L, Santos JCF, Japiassú LB, Garcia AWR, Miguel AE, Ferreira RA (2009). Fenologia do Cafeeiro: condições agrometeorológicas e balanço hídrico do ano agrícola 2004-2005. Brasília, DF: Embrapa Informação Tecnológica. |
|
|
Oliveira EL, Faria MA, Reis RP, Silva MLO (2010). Manejo e viabilidade econômica da irrigação por gotejamento na cultura do cafeeiro Acaiá considerando seis safras. Revista Engenharia Agrícola 30:887-896. |
|
|
Paiva RN, Carvalho CHS, Mendes ANG, Almeida SR, Matiello JB, Ferreira RA (2010). Comportamento agronômico de progênies de cafeeiro (Coffea arabica L.) em Varginha-MG. Coffee Science 5:49-58. |
|
|
Pereira SP, Bartholo GF, Baliza DP, Sobreira FM, Guimarães RJ (2011). Crescimento, produtividade e bienalidade do cafeeiro em função do espaçamento de cultivo. Pesquisa Agropecuária Brasileira 46:152-160. |
|
|
Pinto MF, Carvalho GR, Botelho CE, Gonçalves FMA, Rezende JC, Ferreira AD (2012). Eficiência na seleção de progênies de cafeeiro avaliadas em Minas Gerais. Bragantia 71:1-7. |
|
|
Rodrigues WP, Vieira HD, Barbosa DHSG, Souza FGR, Candido LS (2013). Adaptability and genotypic stability of Coffea arabica genotypes based on REML/BLUP analysis in Rio de Janeiro State, Brazil. Genetics and Molecular Research 12:2391-2399 |
|
|
Silva DFG, Coelho CJ, Romanek C, Gardingo JR, Silva AR, Graczyki BL, Oliveira EAT, Matiello RR (2016). Dissimilaridade genética e definição de grupos de recombinação em progênies de meios-irmãos de milho-verde. Bragantia 75:401-410. |
|
|
Silva FL, Baffa DCF, Oliveira ACB, Pereira AA Bonomo VS (2013) Integração de dados quantitativos e multicategóricos na determinação da divergência genética entre acessos de cafeeiro. Bragantia 72:224-229. |
|
|
Torres FE, David GV, Teodoro PE, Ribeiro LP, Correa CG, Luz Júnior RA (2015). Desempenho agronômico e dissimilaridade genética entre genótipos de soja. Revista de Ciências Agrárias 38:111-117. |
|
|
XLSTAT 7.0 (2005). Addinsoft. Paris, France, 2005. |
|
Copyright © 2024 Author(s) retain the copyright of this article.
This article is published under the terms of the Creative Commons Attribution License 4.0


