Full Length Research Paper
ABSTRACT
Tetrapleura tetraptera and Aframomum citratum fruits are used as spices and in the traditional pharmacopeia in Cameroon. They are mostly combined and preheated for many purposes while cooking. The effects of roasting on the phenolic content of spices, phenolic profile of a beverage made with the mix of roasted spices and its hypoglycaemic activity on diabetes complications were investigated. Aqueous extract (infusion: 100°C; 1/5 g/ml) was prepared, and the total polyphenols and flavonoids contents before and after heat treatment were quantified. Four formulations of T. tetraptera/A. citratum (95/5; 90/10; 85/15; 80/20) were assessed and the in vitro glucose adsorption capacity of the extracts was studied to retain the most effective formulation (AEF). Phenolic and derivatives compounds of AEF were analysed using HPLC-DAD methodology. The AEF hypoglycaemic activity (250 mg/kg bw) and the various complications of hyperglycaemia after Streptozotocin induction (55 mg/kg) were examined on rats. Significant (p<0.05) improvements in phytochemical content were noticed for T. tetraptera and AEF extracts after heat treatment. Among the phenolic compounds identified, flavone, protocatechic, chlorogenic, p-Coumaric acids, and naringin showed the highest concentrations. Significantly, the effect of AEF is the same as the administration of AEF-Glibenclamide (Glibenclamide) and Acarbose after 4 h when assessing the anti-hyperglycaemic test. The influence of Glibenclamide (the reference drug) is significantly improved by AEF, and this synergy has the best anti-hyperglycaemic, hypoglycaemic, hypotriglyceridaemic potential and boosts catalase, superoxide dismutase activities while reducing Malondialdehyde (liver, pancreas, haemolysates) and hydroperoxide (liver, plasma, and kidney) contents compared with the use of single AEF.
Key words: Tetrapleura tetraptera, Aframomum citratum, anti-diabetic, hyperglycaemia, roasting, pharmacopeia, hypoglycaemia, infusion, HPLC-DAD, Streptozotocin
Abbreviation: Bw, Body weight; Dw, dry weight; AEF, Aqueous Extract of Tetrapleura tetraptera/Aframomum citratum formulation 95/5); AES, Aqueous Extract of Salvia Officinalis; ALT, Alanine Aminotransferase; AST, Aspartate Aminotransferase; DAD, Diode Array Detector; HPLC, High Performance Liquid Chromatography; IU, International Units; MDA, Malondialdehyde; RH, Relative humidity; ROOH, Hydroperoxides; ROS, Reactive Oxygen Species; rpm, revolutions per minute; SS, Starch Solution; SOD, Superoxide Dismutase; STZ, Streptozotocin; T2D, type 2 diabetes; TFL, Total Flavonoid; TPP, Total Polyphenol; TAC, Total Antioxidant Capacity; NC, Normal control; PC: Positive control; w/w, weight/weight.
INTRODUCTION
The fruits of Tetrapleura tetraptera and Aframomum citratum were identified (Sneyd, 2013) as being among the most commonly used and available spices in Cameroonian cities. Non-timber forest products, they have multiple folkloric and ethnobotanical uses (anti-cancer, anti-inflammatory, anti-malarial, anti-convulsive, anti-diabetic, etc…) in many Central and West African countries (Kemigisha et al., 2018; Djiazet et al., 2016; Amadi et al., 2016). T. tetrapterais from the West African rainforest (Ogbunugafor et al., 2017)and belongs to the class of Magnoliopsida, Fabaceae family while A. citratum is part of the Angiosperms, family of Zingiberaceae (Amadi et al., 2016).
Used as spices, A. citratum and T. tetraptera fruits undergo heat treatment most of the time before cooking. Indeed, they are hard-shelled fruits and thus generally roasted for many purposes (to facilitate the grinding and release of aroma or to enhance a particular stew colour). Mixed together they are roasted prior to use when cooking popular recipes in Cameroon like “MbongoTchobo” (black stew) from the Littoral Region, and “Nkwui” from the west Region. However, processed foods have been considered to have lower nutritional value than their fresh commodities for a long time due to the loss of nutrients as vitamins. Concerning phenolic compounds, the results are contradicting in most studies. A few researchers have reported an increase in the phenolic content, while others observed a decrease. Indeed, Rohn et al. (2007)reported the thermal degradation of onion quercetinglucoside under roasting conditions (180°C), while Nikousaleh and Prakash (2016)noted that clove (Syzygium aromaticum Linn) exhibited a powerful antioxidant activity which increases under heat treatment and is positively correlated with antioxidant components.
All previous studies (Bella et al., 2012; Atawodi et al., 2014; Amadi et al., 2016) on the biological activities of each individual spice extracts were performed with fresh or sun-dried materials (fruits, stems, barks). As the spices are heated during the cooking process, information on the antidiabetic activity of preheated spices is still unknown. In the context of applied nutrition, if we want to use those plant extracts for therapeutic purposes, processing steps which can enhance the release of bioactive compounds and improve the variable biological activities should be applied. For domestic food consumption, obtaining plant extracts by infusion would be the fastest and most effective way, which also has the advantage of presenting the most important extraction yields that are positively correlated with the content of bioactive compounds following a very short extraction time (Khaoula et al., 2018). Studying the synergic effects of the two plant species extracts used to handle many inflammatory diseases diabetes in domestic food consumption can cast light on their potentialities after the process that they undergo.
The aim of the study is to study the effect of heat treatment on the phytochemical characteristics of the two spices given above, define the phenolic profile of a beverage made with a mixture of the two spices and study its biological activity (hypoglycaemic) on diabetes complications. According to the heat treatment applied, a preliminary study was done in order to determine the optimum conditions of polyphenol extraction. Various formulations were assessed to choose the one with the best in vitro glucose trapping activity. Salvia officinalis infusion (Mediterranean spice with an anti-diabetic potential that is recognised worldwide), Glibenclamide and Acarbose were used as references to compare the various effects on Streptozotocin (STZ)-induced diabetic rats.
MATERIALS AND METHODS
Plant samples
T. tetraptera and A. citratum fruits are from Boanda (12°0'42.6960''E) and Ngato (15°2'50.8215''E) localities in the Central and Eastern regions in Cameroon, respectively. Each specimen was identified by Dr FongnzossieEvariste, botanist at the Higher Teacher's Training School for Technical Education (Douala University, Cameroon); voucher specimens (N°31610/NHC, N°37795/NHC respectively) were deposit in National Herbarium for further references. Salvia officinalis leaves were purchased, vacuum bagged in the market, ground and stored at 4°C for further analysis.
Chemicals and standards
All chemicals and standards (for HPLC analysis) were of analytical grade, with at least 98% purity, and were used without further purification. Reference standards and the other chemicalsused were from Sigma-Aldrich (Merck Darmstadt, Germany). Acarbose and Glibenclamide were pharmaceutical grade and obtained with a certificate of analysis.
Heat treatment and preliminary studies
Roasting temperature and time of the mixture (95/5: T. tetraptera/A. citratum) were chosen according to previous tests on polyphenol extraction optimisation. Initially, roasting temperature and time were selected by preliminary experiments on the basis of single factor multiple levels. Spices were heated at temperatures between 100 and 240°C for 15 min to study the effect of roasting temperature; while roasting times between 5 and 30 min at 140°C (the roasting temperature with the highest total polyphenols content) were applied to study the effect of roasting time on total polyphenols contents. The optimal conditions were reached at a roasting temperature of 150°C, roasting time of 12.62 min and brewing time of 11.91 min. Dried spices were sliced into small equal pieces(around 1 cm2) and roasted using a home coffee roaster Machine(Vingloo, 1200 w; 110/220 V). After heat treatment, the spices were cooled at room temperature before crushing. The powder was vacuum packed and stored at 4°C.
Preparation of sample extracts and standards
The plant aqueous extracts were obtained according to Yazdani et al. (2012)’s extraction procedure with slight modifications. The fruits were dried for 3 days at 40°C. They were sliced into small pieces before grinding using IKA Universal Mill M 20. The spices powder was sieved and particles with diameter less than 3.5 mm were used for aqueous extraction. Ground spices and hot water (100°C) were gently mixed at a ratio of 1:5. Extraction was performed for 11.91 min (brewing time). The mixture was centrifuged (5000 rpm/10 min, 4°C) and the supernatant was collected and filtered (Whatman No1). For phytochemical analysis, the supernatant was used and for the in vivo anti-diabetic activity of the beverage, the supernatant was freeze-dried before use.
Concerning the HPLC analysis, the supernatant obtained previously was treated twice with an equal volume of n-hexane in a separating funnel. The aqueous phase was collected and freeze-dried. For phytochemical compound identification, one gram of the dried aqueous sample was diluted into 5mL of de-ionised water and the solution was degassed in an ultrasonic bath (Fisher Scientific ultrasonic bath, Elma Germany) prior to use. It was filtered through a 0.45µm membrane filter (Millipore) directly into a 2ml HPLC vial. Stock solutions of standards were prepared in the HPLC mobile phase at a concentration range of 0.025-0.2 mg/ml and were handled as previously described.
Phytochemical analysis and in vitro antidiabetic activity (Glucose adsorption capacity of spice formulations extracts)
The total polyphenols content (TPP) was assessed using the Folin-Ciocalteau colorimetric method, with slight modifications (Moukette et al., 2015); it was calculated from the Gallic Acid standard curve (0–1000μg/ml) and expressed as mg GAE/g dw (mg Gallic Acid Equivalent/g dry weight). The total flavonoids content (TFL) was also quantified according to Alara et al. (2017), with slight modifications from a Catechin standard curve (0-1000 μg/ml) and expressed as mg CE/g dw (mg Catechin Equivalent/g dry weight).
Four formulations were made with T. tetraptera and A. citratumin the following proportions: 95/5, 90/10, 85/15 and 80/10 (w/w). For the in vitro antidiabetic activity (Devi and Das, 2015), 1 ml of glucose solution (12.5, 25, 37.5 and 50%) was mixed with 1 mL of the beverage (5, 10, 15 and 20 mg/ml). The control consisted of 1 ml of glucose and 1 mL of distilled water. The resulting mixture was centrifuged (4800 rpm/20min) and incubated (37°C for 1h). The glucose content was determined in the supernatant using the glucose oxidase peroxidase diagnostic kit (Chronolab, USA).
High performance liquid chromatography (HPLC) analysis
The spice extract phenolic compounds were obtained as described earlier and the phenolic compounds identification was performed according to Najafian et al. (2016) procedure, with modifications. The phenolic compounds were fractionated by an Agilent 1100 series HPLC (Palo Alto, CA) system equipped with a photodiode array detector (HPLC-DAD) and a multiple wavelength detector, an online degasser, a cooler autosampler, a quatpump, a column heater and a PoroshellZorbax 6 XDB-C18 column (4.6 × 250 mm × 5 μm diameter particles, Agilent) thermostated at 40°C.The eluates were detected at 210, 250, 280 and 320 nm. Gradient elution was performed to achieve maximum separation and sensitivity. Elution was performed by varying the proportion of acetonitrile solvent to 0.1% formic acid in deionized water as follows: water containing 0.1% formic acid/acetonitrile with 0.1% formic acid (90:10) at 0 min; acetonitrile containing 0.1% formic acid/water with 0.1% formic acid (20:80) at 16 min; acetonitrile containing 0.1% formic acid/water with 0.1% formic acid (25:75) at 19-22 min; acetonitrile containing 0.1% formic acid/water with 0.1% formic acid (30:70) at 26 min; acetonitrile containing 0.1% formic acid/water with 0.1% formic acid (100:0) at 27-29 min and finally acetonitrile containing 0.1% formic acid/water with 0.1% formic acid (10:90) at 30-35; this was done for a total running time of 35 min and an injection volume of 10 µl using an autosampler.
For the method optimisation, several conditions, columns, solvents, times and mobile phases were used to obtain the optimum separation of each standard in the extracts. To check the selectivity, a diode array detector (DAD) was used to identify the standard and verify the peak purity during the analytical run of the extracts. The retention time of the standard was used to identify the analytical chromatographic profile comparison of the UV spectra was carried out. The linearity of the detector response for the prepared standards was assessed by means of linear regression regarding the amount of each standard and the area of the corresponding peak on the chromatogram. Method sensitivity was assessed by determining the limit of detection (LOD) and the limit of quantification (LOQ) for each compound. LOD and LOQ were calculated based on the standard deviation of the responses and the slope using three independent analytical curves. A standard additional method was utilised to assess recovery behaviour (accuracy). The addition of known amounts of organic acids, polyphenols to the spice samples tested for two concentrations levels were used and replicated three times. Average recovery was calculated by comparing mean values of replicates with theoretical concentrations of each replicate.
Experimental animals
Male Wistar albino rats (204-302g) were housed in standard environmental conditions at the animal house of Nutrition and Nutritional Biochemistry laboratory in Yaounde I University, Cameroon (T: 25 ± 6°C; RH: 55-65 % and 12h light/dark cycle), fed with a market standard food and water ad libitum. This study was conducted according to the "Guide for the Care and Use of Laboratory Animals, Eighth Edition" which is universally recognised and applied by the Research Ethic Committee (REC) of Yaounde I University.
Diabetes induction and diagnosis
Diabetes was induced according to Akbarzadeh et al. (2007) method with slight modifications by the intraperitoneal administration of STZ (Sigma Aldrich Chemical 98% purity, USA). After STZ administration (2ml/kg at a dose of 55mg/kg), animals received a solution of glucose (20%) 2h after food. The diagnosis was carried out 24h after fasting by measuring glycaemia. Diabetes was diagnosed after recording glycaemia above or equal to 200mg/dL (Chang et al., 2000). After diabetes was confirmed, the rats were divided into groups (Table 1) to assess the beverage activity.
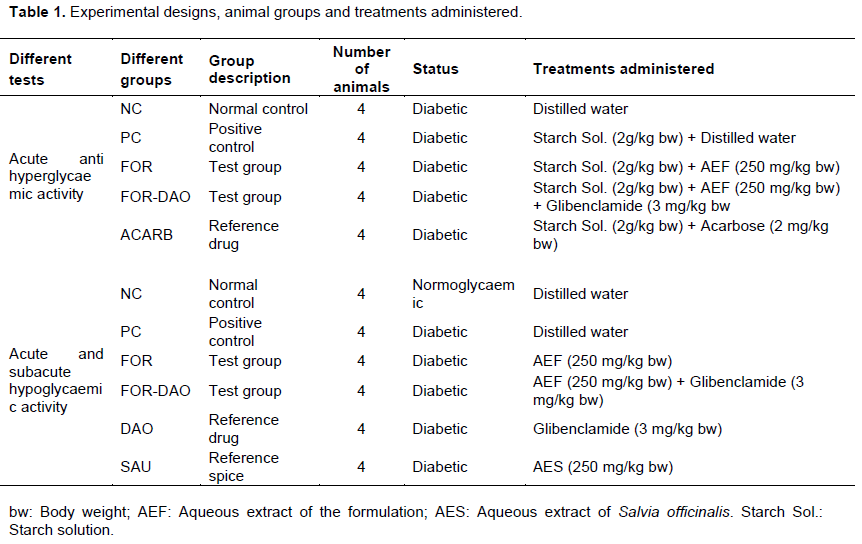
Acute anti-hyperglycaemic activity of the beverage (AEF) on diabetic rats
The test was performed for a period of 4h, one week after the beginning of the experiment (Hussain et al., 2012). Twenty diabetic rats were fasted 12h before they were divided according to glycaemia (Table 1). Initial glycaemia was measured before the administration of AEF (250 mg/kg bw) and reference drugs. Starch solution was administered 30min later. Glycaemia was taken 30 min, 1h 30 min, 2h 30 min and 3h 30 min after the administration of the starch solution by slight bleeding from the distal tip of the tail.
Acute and subacute hypoglycaemic effects of AEF on diabetic rats
The subacute hypoglycaemic effects of AEF were evaluated over a period of 14 days on a total of 20 diabetic rats and 4 normoglycaemic rats following the experimental design described in Table 1. The body weights of the rats were recorded during the assay using a digital scale. The administration volume of each treatment was 5ml/kg. During acute tests, glycaemia was measured in the morning, during fasting, just prior to the administration of the different treatments, 30 min, 2h and 5h later. As part of the subacute tests, glycaemia was confirmed by fasting on days 3, 7, 10 and 14 after the beginning of the test.
The percentage of glycaemia reduction was calculated for the anti-hyperglycaemic and hypoglycaemic activities using the formula:
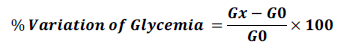
Where G0 is the initial value of glycaemia and Gx is the measured blood glucose at a given time
The preparation of hemolysates of erythrocytes and organ homogenates
After testing, glycaemia was confirmed in rats fasted for 12h. The blood was left to stand for 4h at room temperature and then centrifuged (1500 rpm/10 min, 4°C). The collected plasma was stored at -20°C. Hemolysates (Menon et al., 2016)and organ homogenates (Fossati and Prencipe, 1982)were obtained and stored.
Relevant biochemical assays
The following biochemical parameters related to diabetes complications were measured: Total cholesterol and serum triglycerides (the oxidase method using a commercial kit: Biolabo SA, Maizy, France); hepatic glycogen (Sullivan et al., 2014); liver, kidney and plasma transaminase (ALT and AST) activities (Schumann et al., 2002); total protein contents (Lowry et al., 1951); total homogenate antioxidant capacity by the Phosphomolybdenum method (Prietoet al., 1999); catalase and superoxide dismutase (SOD) activities (Nelson and Kiesow, 1972; Misraand Fridovich, 1972 cited by Junli et al., 2009); Hydroperoxide (Jiang et al., 1992)and Malondialdehyde (Yagi, 1976)contents.
Statistical analysis
All of the measurements were performed in three replicates. Statistical analyses were performed using statistical packages for Social sciences (SPSS, version 21.0) and MINITAB (LLC, version 19) software. The results were expressed as Mean ± SD; student’s t-test, one way ANOVA followed by the Tukey's posthoc comparison test were used to determine the values of p. Significant differences were noted when p<0.05.
RESULTS AND DISCUSSION
Effects of roasting on total polyphenols and total flavonoids contents
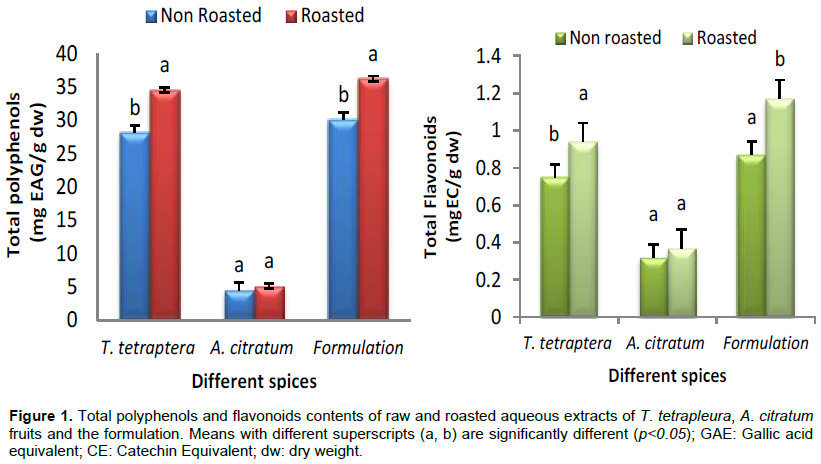
The TPP and TFL of the different spices are recorded in Figure 1. For both species and the mixture, the heat treatment increased the amounts of TPP and TFL. However, changes were significant (p<0.05) for T. tetraptera and the mixture. It should also be noticed that the two spices contain significant amounts of polyphenols and flavonoids. Mixing A. citratum and T. tetraptera significantly (p˂0.05) improved the TPP and TFL contents. The percentage differences between TPP and TFL on raw and roasted T. tetraptera fruits were higher on average than those observed in A. citratum fruits, meaning that the extraction yield of the phytochemical characteristics at that temperature was the most important in the species. We can notice also that the release of phenolic compounds was more important in the formulation.The registered results can be explained by the degradation of complex phenolic tannins and also the enzymatic or non-enzymatic oxidation process leads to supplementary content of phenolic compounds (İzli, 2017).
In vitroglucose adsorption capacity
The glucose adsorption capacities of the plant extracts are presented in Figure 2. The extracts are significantly (p<0.05) binding glucose at any concentration and the binding activity is proportional to the extract and glucose concentrations and inversely proportional to the fraction of A. citratumin the formulation. Formulation 95/5 (T. tetraptera/A. citratum) has a significantly greater activity for a given glucose and extracts concentration and was therefore chosen for the in vivo test.
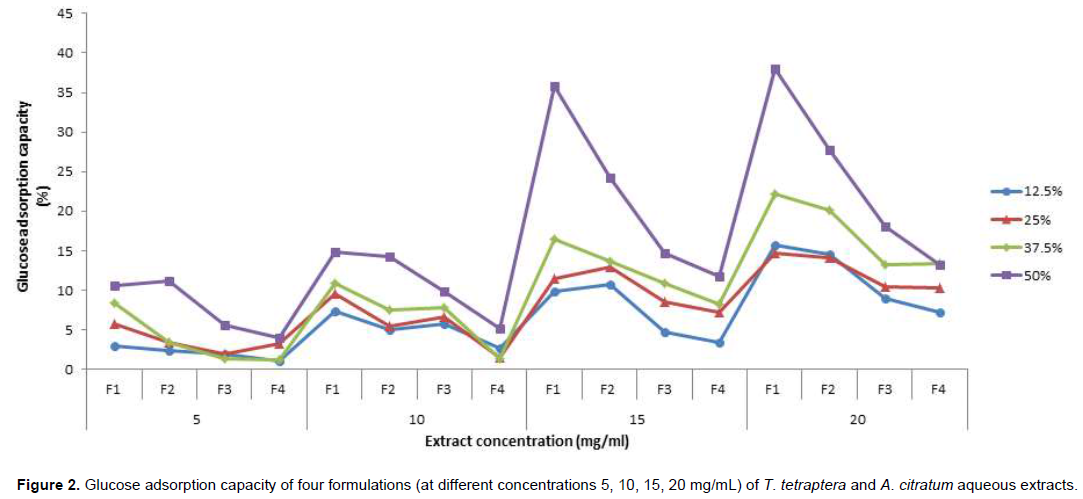
The result obtained can be attributed to their dietary fibre contents because fibres have the ability to adsorb glucose (Ahmed et al., 2011). Indeed, T. tetraptera contains raw fibre that can exceed 40% (Mboto et al., 2013). One of the mechanisms by which fibres help to reduce glucose is by binding free glucose, inducing the drop in glucose concentration (Ahmed et al., 2011). This reduction can also be attributed to their physicochemical composition (alkaloids, flavonoids, phenols, tannins, triterpenes, anthraquinones, saponins, peptides, glycopeptides, inorganic ions, guanidines, steroids), as reported by Irondi et al. (2016). Most of those compounds are involved in the bioavailability of glucose (Govindappa, 2015)by various in vivo (blocking K+ channels of pancreatic β-cells by the stimulation of AMPc; inhibition of kidney glucose reabsorption; stimulation of insulin secretion by the β-cells of the islets and/or inhibition of insulin degradation process; regeneration of pancreatic β-cells; stimulation of gluconeogenesis and glycolysis in liver; prevention of pathological conversion of starch in glucose; and inhibition of β-galactosidase and α-glucosidase) and in vitro (adsorption) pathways according to Bhutkar et al. (2017). The binding capacity reduces with an increase in the A. citratum portion in the formulation, as the total polyphenol composition of T. tetraptera extracts is more than 5 times greater than that of A. citratum.
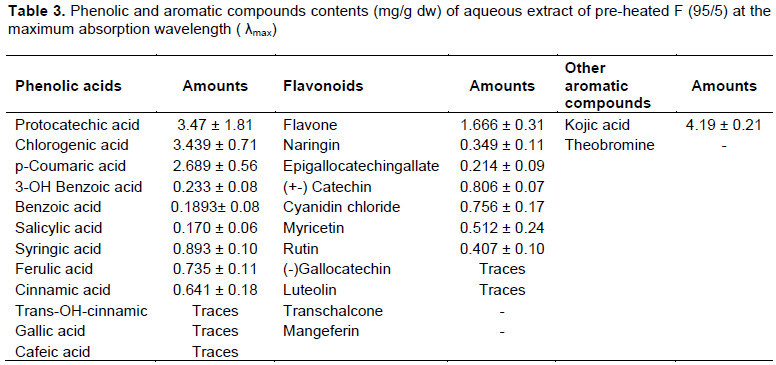
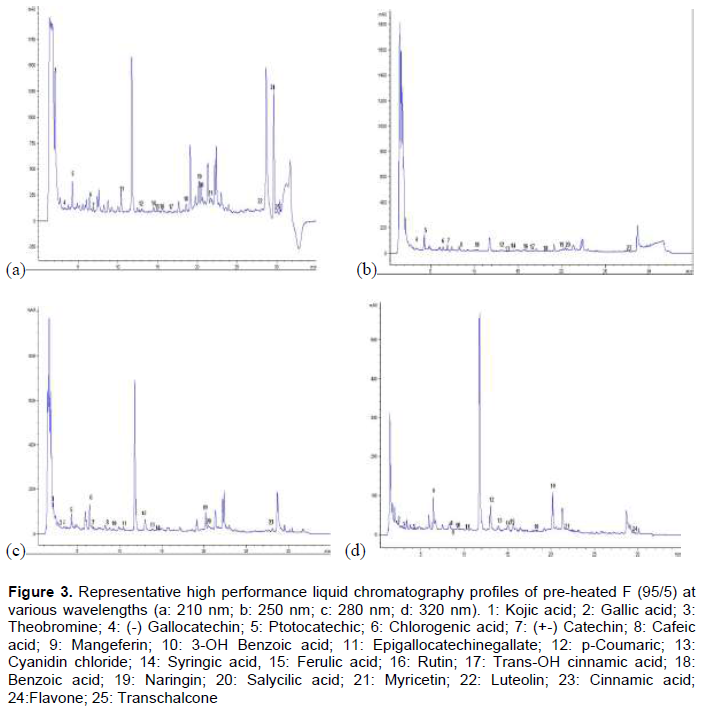
Identification and quantification of phenolic and heterocyclic compounds on F (95/5) extracts
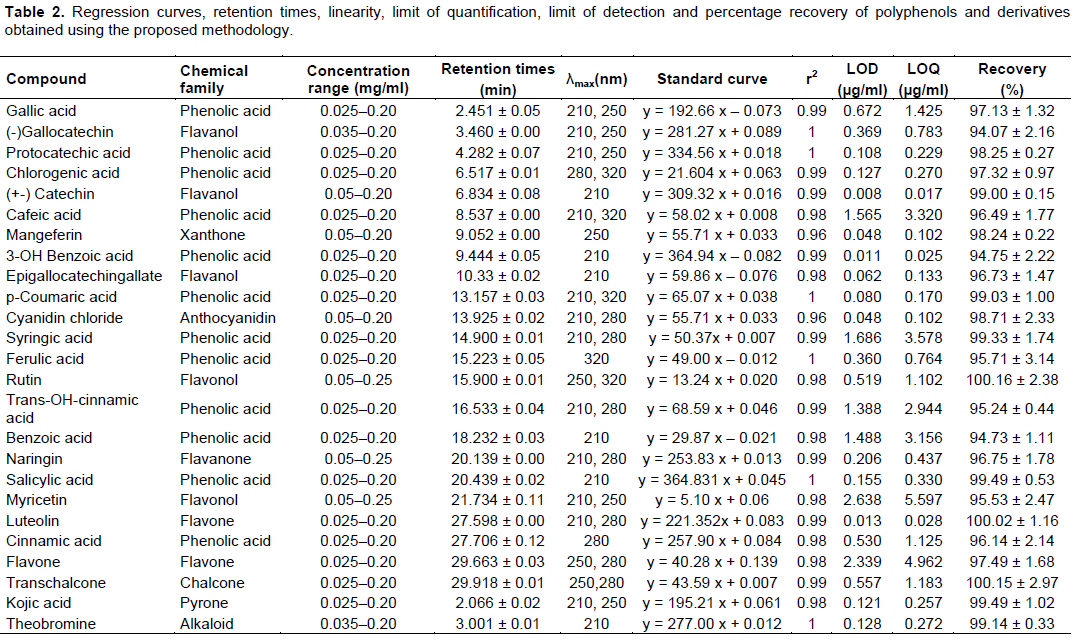
The analysis showed the presence of many phenolic and aromatic compounds with potential biological activities in the beverage. The chromatographic parameters of the method used for quantification are shown in Table 2. In total, 12 phenolic acids, ten flavonoids, one alkaloid (Theobromine), and one pyranone (Kojic acid) were identified and quantified (Table 3). All tested substances are well known antioxidants. Among the phenolic compounds: Flavone (1666.2 µg/g dw), Naringin (349.7 µg/g dw), Protocatechic acid (347.8 µg/g dw), chlorogenic acid (343.9 µg/g dw) and p-Coumaric acid (268.9 µg/g dw) showed the highest concentrations for both detection wavelengths (Figure 3). However, Luteolin, Mangeferin, and Trans-OH Cinnamic acid were determined at trace levels (Table 3).
All of these compounds have already been detected in aqueous, methanol and ethanol extracts of T. tetraptera (Sokamte et al., 2019; Odubanjo et al., 2018; Amadi et al., 2016), but the amounts recorded are lower than the quantities already published for aqueous extracts. Among the phenolic and aromatic compounds identified and quantified for the plant species, the presence of Kojic acid, Cyanidin chloride, Myricetin, Salicylic acid, Mangeferin, Naringin and Protocatechic acid has not yet been reported for the two plant species. Experimentally, the relatively high polyphenols content (flavonoids) contributes to the control of oxidative stress (Ghorbani and Esmaeilizadeh, 2017). Several phenolic and derivative compounds identified by HPLC explain the observed AEF activities, and Glibenclamide reinforces the antioxidant system by limiting the metabolic damage caused by diabetes (Kusano and Ferrari, 2008). Indeed, Catechin, Epicatechin, Gallocatechin, Epigallocatechin and their derivatives positively affect inflammatory diseases, such as Type 2 diabetes. They can modulate inflammation by decreasing the expression of IL-6 and MCP-1 and increasing the production of the anti-inflammatory compounds, adipokine and adiponectin (Aryaeian et al., 2017). Rutin is involved in the activation of liver enzymes associatedwith gluconeogenesis and lipid metabolic processes and also decreases the levels of fasting blood glucose, creatinine, blood urea nitrogen, urine protein and the intensity of oxidative stress significantly. Rutin has also been reported to significantly improve body weight, reduce HbA1c and pro-inflammatory cytokines (IL-6 and TNF-alpha), and restore the depleted liver antioxidant status and serum lipid profile in STZ-induced diabetic rats (Vinayagam and Xu, 2015). Cyanidin chloride has been demonstrated to inhibit intestinal α-glucosidase and pancreatic α-amylase, which is one of the therapeutic approaches for treatment of T2D according to the same authors. Naringin is effective at protecting against the development of metabolic syndrome as it changes the expression of hepatic genes involved in lipid metabolism and gluconeogenesis via their up-regulation (Vinayagam and Xu, 2015). Concerning phenolic acids (Caffeic, Chlorogenic, Protocatechuic, p-Coumaric, Cinnamic, Gallic, Syringic, Ferulic, Salicylic) and Kojic acid, an anti-diabetic activity has been reported (Vinayagam and Xu, 2015; Amadi et al., 2016; Saeedi et al., 2019).
Chlorogenic acid has a glucose absorption inhibitory effect and modulates oxidative stress, while p-Coumaric acid has a glucose lowering effect in STZ-induced diabetic rats (Shairibha et al., 2014)and modulates glucose and lipid metabolism via 5’-adenosine monophosphate-activated protein (AMPK) activation in L6 skeletal muscle cells (Vinayagam and Xu, 2015). It was also found to be highly effective in managing the complications associated with diabetes mellitus, such as insulin maintenance, protein metabolism and carbohydrate-metabolising enzymes. Ferulic acid is reported to decrease blood glucose levels, glucose-6-phosphatase and phosphoenol pyruvate carboxykinase activities and to increase glycogen and insulin by reducing oxidative stress and the inflammation pathway. Syringic acid has the potential to secrete insulin from existing islet β-cells alloxan-induced diabetic rats. Treatment with Gallic acid on db/db mice and fructose-administered rats facilitated glucose homeostasis, improved insulin sensitivity, reduced obesity, reduced elevated blood pressure and decreased cholesterol levels, as well as inducing adipogenesis in 3T3-L1 adipocytes (Variya et al., 2019). A strong body of evidence supports the biological activity in vitro of Protocatechuic acid as an antioxidant and insulin-mimetic molecule in different biological models (Ormazabal et al., 2018).
For the method optimisation, the validation parameters (linearity, accuracy, sensibility) are presented on Table 2. The correlation coefficients of all the calibration curves were greater than 0.98. The results obtained show percentages of recovery between 94.07 and 100.16%. The recovery values are considered acceptable (González-González et al., 2019)according to Commission Decision (2002/657/EC). LOD values were calculated between 0.008 and 2.638 µg/ml and the LOQ values were found in the range from 0.017-5.597µg/ml.
AEF Anti-hyperglycaemic activity
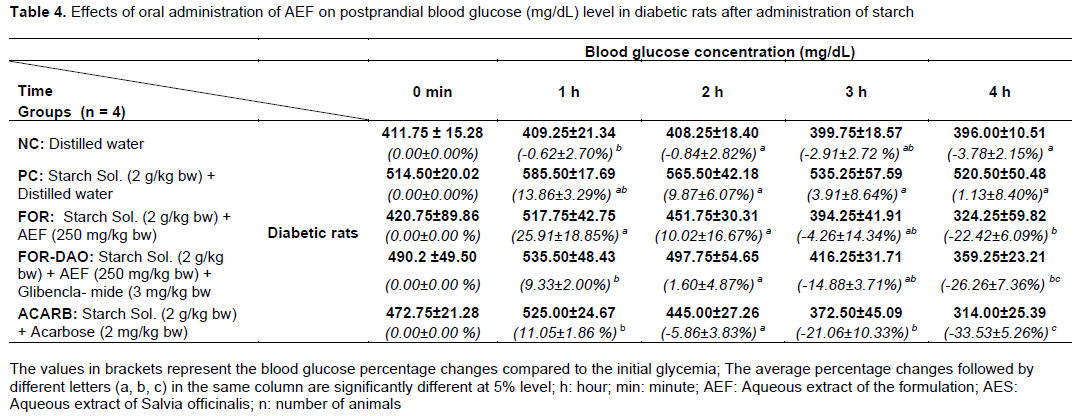
There was an increase in glycaemia (Table 4) following the administration of starch in all groups except the Normal Control group and the glycaemic peaks were observed after 1h. AEF showed an anti-hyperglycaemic effect after 2h and the drop of the glycaemia is more pronounced after 4h compared to the Positive Control group. The effect of AEFis statistically identical to that of AEF-Glibenclamide after 4h while the influence of AEF-Glibenclamide remains identical to that of Acarbose. The above results on the in vitro hypoglycaemic activity of the plant extracts were verified by those obtained via the in vivo study of the hypoglycaemic activity of AEF in diabetic rats. Indeed, AEF demonstrated a hypoglycaemic action identical to that of AEF- Glibenclamide, which was previously reported (Atawodi et al., 2014). In that report, the diabetic groups treated with either the methanolic extract of T. tetraptera leaf or Glibenclamide showed significant percentage change (p<0.05) in the fasting blood sugar level (30.15 and 47.56%, respectively) compared to the diabetic (0.59%) and normal controls (2.30%) between Day 0 and Day 7. Similarities have been noted with Trigonellafoenum-graecum (Leguminosae) seed powder commonly known as Shanbalileh, a natural Persian herb. The seed powder significantly decreases the hyperglycaemic peak and/or the area under the glucose tolerance curve according to Alarcon-Aguilara et al. (1998); Cited by Shojaee et al. (2015).
AEF acute and subacute hypoglycaemic activities
During the acute test, no change in glycaemia was observed in the Positive control group (Table 5); however, AEF decreased blood glucose from the 30th min until the 5th h. AEF was more effective than AEF-Glibenclamide during the first 2h and less effective after 5h. In fact, glycaemia reductions followed this order: AEF-Glibenclamide>Glibenclamide ≥ AEF ≥ AES > NC ≥ PC after 5h. AEF had a similar performance with that of Glibenclamide and AES.
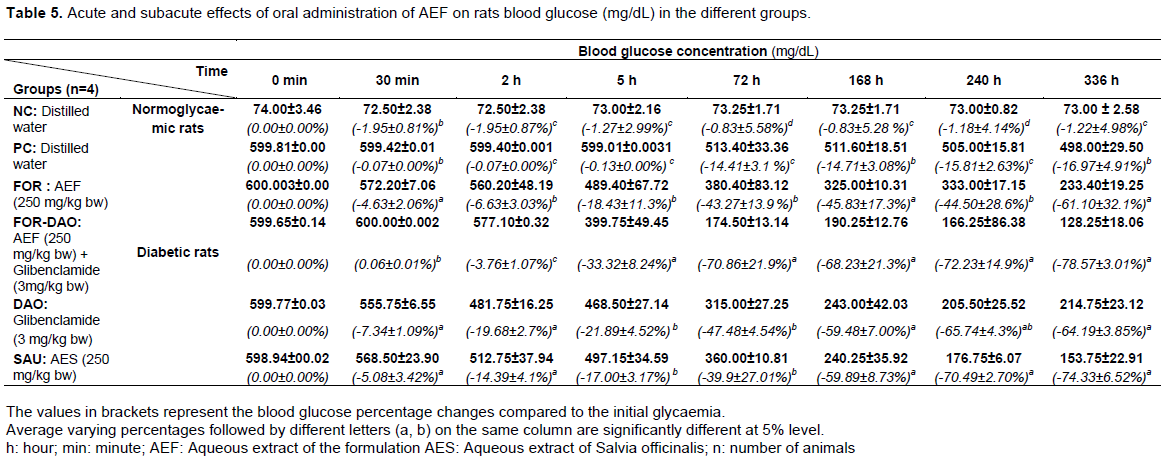
Concerning subacute test, AEF reduces glycaemia and the reduction is increased from the 3rd day to the end. This decrease is similar to that observed in the groups receiving AES, AEF-Glibenclamide, Glibenclamide and below that of the PC group. However, the efficiency of AEF is lower than that of AES, AEF- Glibenclamide and Glibenclamide for the first three days. AEF increased the Glibenclamide efficiency with a significant blood glucose reduction. The hypoglycaemic tests confirm that the action of Glibenclamide is improved by the addition of AEF in the short and long term. However, the action of AEF is identical in the long term to that of AES whose hypoglycaemic properties have already been established (Hamidpour et al., 2014). Concerning another medicinal plant, Karami et al. (2016) report the therapeutic effect of hydro-alcoholic and aqueous extrcat (200mg/kg bw) of berberis vulgaris fruits on diabetic rats. The results reveal the significant reduction of blood glucose level after 30 days of trial. The presence of Berberine (an alkaloid with antidiabetic effects) in this plant extract can easily explain the results noted. Indeed, according to the authors, Berberine can act like metformin in reducing serum glucose level by aldolase reductase inhibition, glycolysis induction, and prevention of insulin resistance through enhancing of insulin receptor expression. The mechanisms by which the synergic effect of A. citratum and T. tetraptera aqueous extracts lower the blood glucose levels are still unknown, but we think that it is in relation with their phytochemical content. However, according to Raju et al. (2001) cited by Shojaee et al. (2015), the role of phytochemicals on insulin secretion modulation, simulation of insulin action can be considered as the resulting therapeutic action.
Effects of AEF on body weight (bw)
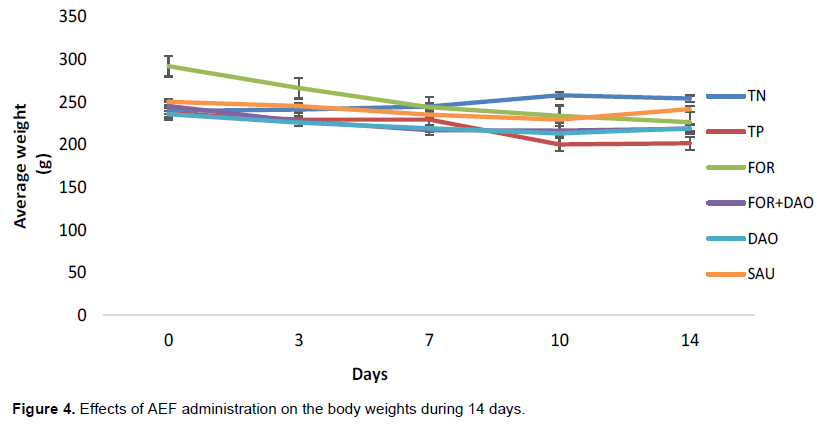
There is a significant difference between the percentage variations of body weights within the groups for each time interval; however at this interval, the normoglycemic group possesses the positive and the highest percentages (Figure 4). After two weeks of AEF administration, the percentage variations of groups FOR, FOR+DAO, DAO body weights are not significantly different while the diabetic group receiving AES recorded the best bodyweight improvement. The results obtained are similar to those published bv Shojaee et al. (2015) who tested the effects of Galega officinalis and Trigobnellafoenum-graecum powder on diabetic mice. After 4 and 30 days of powder administration there was a significant decrease of body weights on diabetic mice whatever the dose administered. Different results were obtained by Hafezi et al. (2015) using Satureja Knuzestanica Jamzad extract on diabetic rats. The authors reported that both doses (100 and 300 mg/kg) could increase the body weight of male rat significantly (p < 0.05); and in positive control and excipient groups, these decreases were not significant (p > 0.05). Weight is a good indicator of health and efficiency of metabolic homeostasis, according to Jangir and Jain (2017). The results showed that despite a similar food disponibility in the six groups of animals, and consequently the same energy proportion, the diabetic rats experienced a significant decrease in body weight (bw).Omanri et al. (2011) demonstrated a loss of bw in diabetic Wistar rats given 45 mg / kg of STZ. The injection of STZ causes the onset of the diabetic syndrome characterized by polyphagia, polyuria, polydipsia and glycosuria, a fall in the bw coupled with a metabolic disorder affecting blood sugar, triglyceridemia and cholesterolemia. The weight reducing effect of our beverage can be also explained by the loss of body fats, according to Palit et al. (1999) cited by Shojaee et al. (2015).
Effects of AEF on the carbohydrate metabolism
The lowest glycogen levels were recorded in the Positive control group compared to Normal control (Table 6). The treatments led to an increase in liver glycogen and no significant difference was observed between between the diabetic rats groups. However, AEF records the most important glucose storage (7.45g/L). This observation was also made for other anti-diabetic plants. Couturier et al. (2011)noticed it in diabetic rats treated with cinnamon extracts (Cinnamomum verum). The synergistic effects of AEF (inhibition of α-amylase and α-glucosidase) and Glibenclamide (stimulating insulin secretion by the pancreatic resistant β-cells) on glucose metabolism explain these observations. Polyphenols contained in plant extracts were described as inhibitors of the activity of these enzymes, including flavonoids, tannins and terpenoids (Mai et al., 2007). It is believed that the result is related to the chemical composition of AEF [presence of (-)Gallocatechin, (+-)Catechin, Epigallocatechin, Rutin, Flavone, Transchalcone, Luteolin, Myricetin, Naringin, and Cyanidin chloride], and the reverse effect of Glibenclamide on glycogen metabolism.
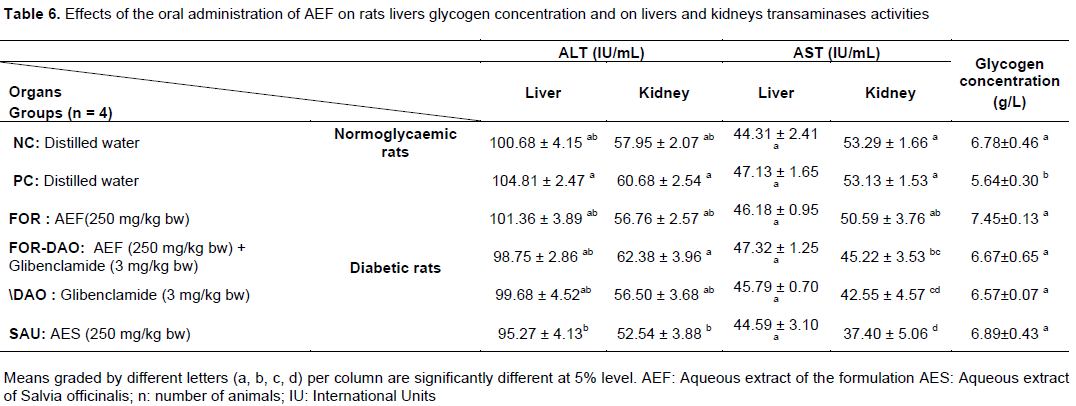
Concerning the liver and kidney transaminases (ALT, AST) activities, AEF allowed as well as Glibenclamide, and AEF-Glibenclamide the inhibition of gluconeogenesis by reducing and/or keeping constant the expression of these transaminases in all organs (Table 6). It is reported that their activity is proportional to the degree of liver damage and their increase in the bloodstream (Visweswara et al., 2013). The levels observed in both diabetic rat groups are due to the alleviation of damage caused by STZ. In other words, AEF, Glibenclamide, AEF-Glibenclamide and AES inhibit gluconeogenesis by reducing the expression of these transaminases. However, this inhibition is higher in both organs using AES and the effect of AEF-Glibenclamide is more effective than that of AEF alone. The results obtained with AEF are similar to those already mentioned (Atawodi et al., 2014; Kuate et al., 2015)and demonstrate that AEF reduces the adverse effects of diabetes, causing significant reduction of blood glucose, the expression of kidney, liver transaminases and enhancing the stimulation of glycogen synthesis.
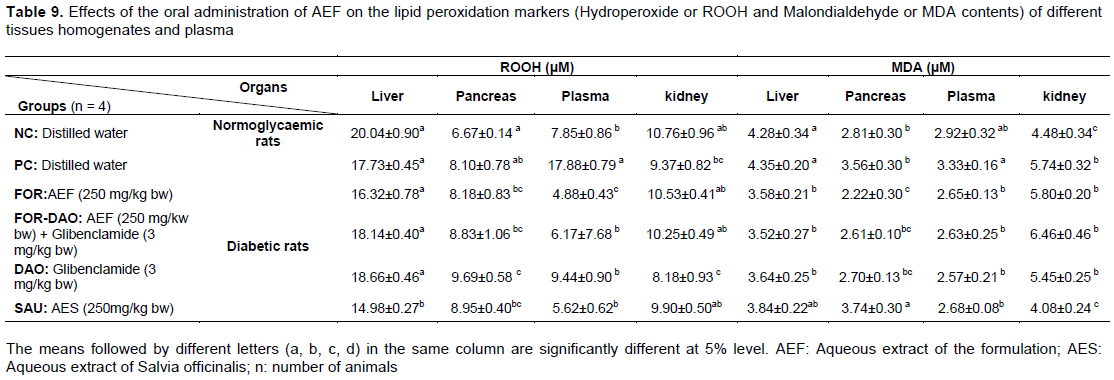
AEF effects on the antioxidant system
No significant difference was noted between PC and NC goups in all target organs (Table 7) and plasma was shown to contain the highest TAC (test groups). AEF, AEF-Glibenclamide and Glibenclamide increased the TAC of all tissue homogenates and plasma compared to the Positive control group. AEF is more efficient than AEF-Glibenclamide and single Glibenclamide in the plasma (17.95±0.03mg AAE/ml). There is no significant difference between the effect of AEF and AEF-Glibenclamide in the liver and kidneys. In all tissue homogenates, AEF is more efficient than AES. Concerning the effect of AEF on the enzymatic antioxidant system, the Positive control group has the lowest SOD and Catalase activities in the pancreas and hemolysates compared to Normal control (Table 7). AEF induces the highest activities in the hemolysates and kidneys compared to the PC group. The formulation enhances the efficacy of Glibenclamide by increasing the SOD activity in pancreas homogenates. AEF is more effective than Glibenclamide in the pancreas, hemolysates and kidneys. AES is more active in the liver and hemolysates than AEF. About catalase activity, there is no difference between the controls on the target organs (except for the liver). There is an increase of this activity in the pancreas and hemolysates for groups receiving Glibenclamide and AEF-Glibenclamide. AES is more efficient in the liver, kidney and pancreas compared to AEF.
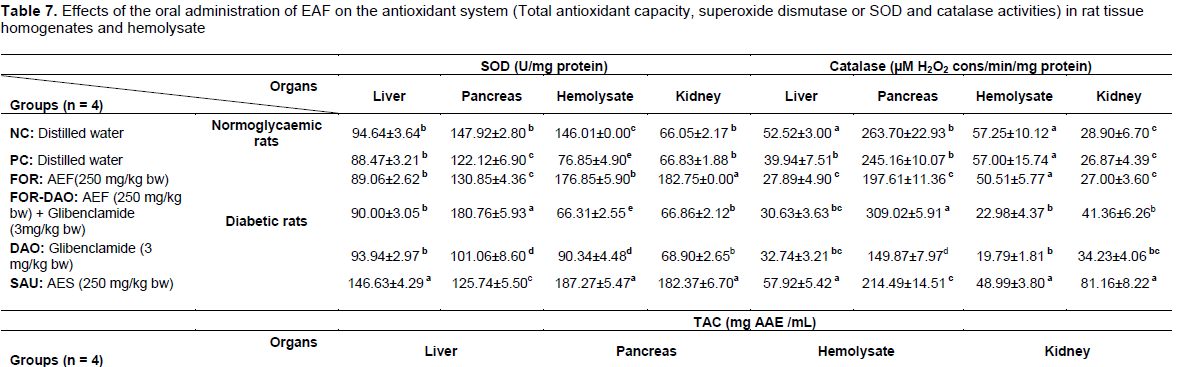
The antioxidant markers (enzymatic and non-enzymatic) studied is used by the body to control ROS production. The results obtained are identical to previous studies where scientists reported an increase in TAC in diabetic rat (STZ) tissues receiving the phenethyl ester of caffeic acid (Okutan et al., 2005)and an improvement in SOD and catalase activities in diabetic rats following treatment with rosmarinic acid (Govindaraj and Subramanian, 2015). The increase in SOD and catalase activities is similar to observations made for T. tetraptera extracts (Bella et al., 2012; Atawodi et al., 2014)and S. officinalis extracts (Kolac et al., 2017).
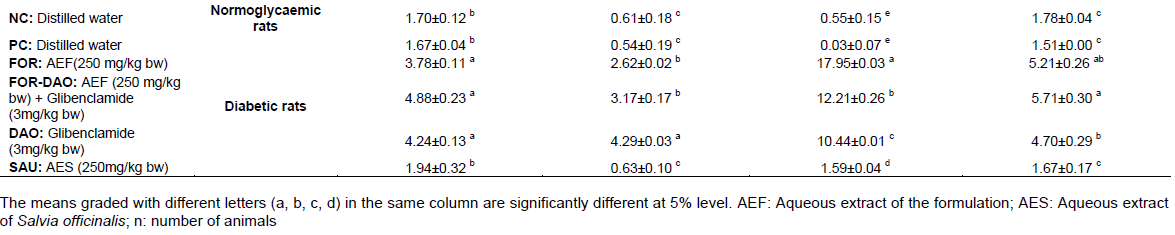
Influence of AEF on lipid profile
There is no change between the controls concerning rat cholesterolaemia while triglyceridaemia was significantly higher in the Positive control group compared to Normal control group (Table 8). AEF lowers cholesterolaemia by about 17% compared to the positive control group, while the other treatments had no significant effect on cholesterolaemia. Triglycerides content was significantly lower in the group receiving AEF compared to controls. However, the effect of AEF is identical to the Glibenclamide activity while AEF-Glibenclamide and AES are more effective. To the best of our knowledge, insulin deficiency is strongly correlated with hyperglycaemia, hypercholesterolemia and hyperlipidaemia (Govindappa, 2015). Unlike this author, we note that AEF has a cholesterol and triglyceride lowering effect in diabetic rats. The results match those of previous discoveries where T. tetraptera aqueous and hydroethanolic extracts, respectively were used (Bella et al., 2012; Atawodi et al., 2014). The groups receiving Glibenclamide or AEF-Glibenclamide recorded a slight increase in cholesterol amounts, but this was not significant compared to controls. This result is identical to the report of the previous authors, demonstrating that metformin has no significant effect on the cholesterol content of skeletal muscle and the liver in diabetic rats. The results obtained with EAS are identical to a report where the levels remained unchanged, as reported for normoglycaemic rats (Ghorbani and Esmaeilizadeh, 2017).
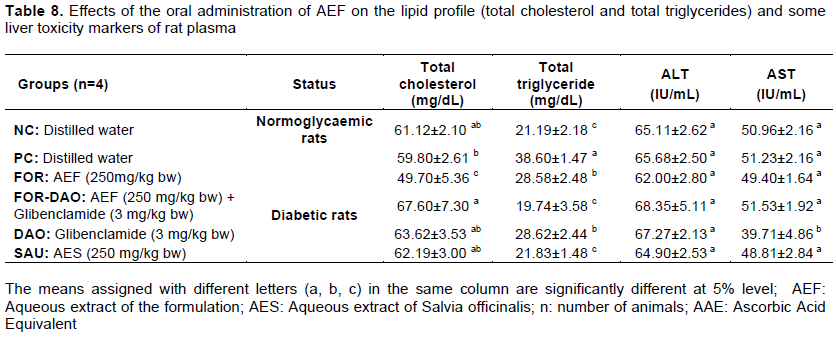
Effect of AEF on hydroperoxides and malondialdehyde (lipid peroxidation markers) content
The various treatments lower ROOH levels compared to the Positive control group in the plasma (Table 9). Groups receiving AEF and AEF-Glibenclamide have identical ROOH contents with the NC group for all target organs. However, AES significantly lowers ROOH content in the liver. With regard to MDA levels, the Positive control group presents significantly (p<0.05) higher amounts in the kidneys compared to Negative Control group and no difference was observed in the other target organs. The groups treated with AEF and AEF-Glibenclamide showed significantly lower rates of MDA in the liver, pancreas and haemolysate compared to the PC group. There was no change between animals treated with AEF, AEF-Glibenclamide and Glibenclamide in the other studied organs.
The decrease in the level of MDA and constant contents of ROOH were also reported for T. tetraptera extracts (Bella et al., 2012; Atawodi et al., 2014). According to them, the reduction of those markers can be attributed to the presence of bioactive compounds in plant extracts that trap and destroy ROS. It has been reported for this purpose that the amount and type of phytochemicals present in plants are largely responsible for the tissue TAC (Pierre et al., 2012).
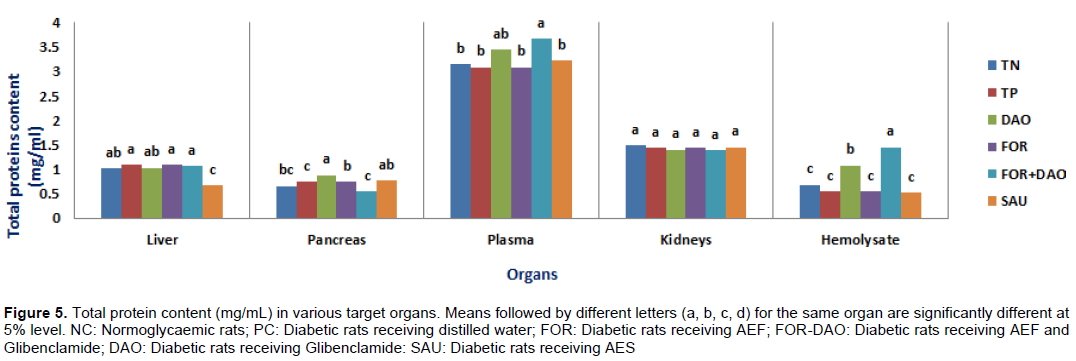
Effect of AEF on liver damage markers
The diabetes induced did not affect the total protein content (Figure 5) between the controls in all organ homogenates, plasma samples and haemolysates. In diabetic rats treated with Glibenclamide, AEF and AEF-Glibenclamide, the protein content in the liver, pancreas and kidneys was not different from that registered in the NC group. With regard to the plasma transaminases activities, Table 8 shows that there is no significant difference at the 5% threshold for the plasma ALT activities of different groups. However, only Glibenclamide led to a significant decrease in AST activity. The results obtained in the liver and plasma are similar to those reported by Taheri et al. (2012) cited by Karami et al. (2016) while testing the effects of hydro-alcolohic extract of Berberis vulgaris root on the activity of liver enzymes in male hypercholesterolemic rats. These effects may be due to the hypoglycaemic activity of Glibenclamide and AEF and/or the regulation of glucose homeostasis and its use by peripheral tissues.
The presence of flavonoids in both plant species also appears to be a contributing factor for maintaining protein levels in diabetic rats. This suggestion is supported by a report where the same effect was noted in diabetic rats treated with resveratrol (Palsamy and Subramanian, 2008). However, total protein content was reduced in several groups (livers of SAU group, pancreas and hemolysates of FOR-DAO). This could be due to the fact that the lack of insulin during diabetes may cause protein catabolism (Konrad et al., 2001). The increase in total protein according to the previous authors can be explained by the diabetogenic actions of STZ (DNA alkylation and increased O-glycosylated proteins rates in the β-pancreatic cells). With regard to transaminase activities in plasma, their increase correlates with important gluconeogenesis and ketogenesis during diabetes (Hasan et al., 2015).
In this case, the induction of diabetes did not affect their activity. However, there was a non-significant decrease compared to controls in the groups receiving AEF and AES. The plasma transaminase activities allow us to conclude that AEF at this concentration after 14 days of treatment shows no toxic effects in spite of the damage induced by STZ. These results are identical to those obtained previously (Ghorbani and Esmaeilizadeh, 2017)in obese diabetic rats receiving S. officinalis extract.
CONCLUSION
In summary, the beneficial effects of AEF alone against metabolic disturbances associated with diabetes were observed. The action of Glibenclamide is improved by adding AEF, and AEF alone also has an equal influence on Glibenclamide for a few tests. Similar results were obtained with AEF and AES for a number of tests. For all of these observations, AEF possess a significant non-negligible potential; using only the anti-diabetic drugs was not sufficient to limit diabetes complications. We believe that AEF can be used as a food additive and can help to improve the effectiveness of oral anti-diabetic agents in order to delay the onset of degenerative complications in a controlled and regulatedframework mechanism. However, the in vivo relevance of the anti-diabetic infusion should be more highly emphasised. Toxicological studies according to the administered dose should be highlighted in comparison with the administration of reference anti-diabetic drugs.
CONFLICT OF INTERESTS
The authors have not declared any conflict of interests.
REFERENCES
|
||||||||||||||||||||||||||||||||||||||||||||||||||||||||||||||||||||||||||||||||||||||||||||||||||||||||||||||||||||||||||||||||||||||||||||||||||||||||||||||||||||||||||||||||||||||||||||||||||||||||||||||||||||||||||||||||||||||||||||||||||||||||||||||||||||||||||||||||||||||||||||||||||||||||||||||||||||||||||||||||||||||||||||||||||||||||||||||||||||||||||||||||||||||||||||||||||||||||||||||||||||||||||||||||||||||||||||||||||||||||||||||||||||||||||||||||||||||||||||||||||||||||||||||||||||||||||||||||||||||||||||||||||||||||||||||||||||||||
Copyright © 2024 Author(s) retain the copyright of this article.
This article is published under the terms of the Creative Commons Attribution License 4.0


