Full Length Research Paper

ABSTRACT
The solar sources of 884 geomagnetic storms have been studied for the solar cycles 23 and 24 (1996-2019), regardless of their size ranges; using the Kp index and the NOAA G criteria (minor to extreme storms). It claims from our investigation that fast solar wind streams (HSSWs) is the main factor of small (G1) and medium (G2) storms and occur mostly on the descending phase of the solar cycle. Fast solar wind has contributed to about 59% of G1 storms; 50% of G2; 29% G3; and 10% G4 storm. Large storms (G3 to G5) are the effects of coronal mass ejections (CMEs) and they are observed mainly during the maximum and the descending phases of the solar cycle. About 10% of G1 storms, 26% of G2 storms, 59% of G3 (strong) storms, 87% of G4 (severe) storms, and 100% of G5 (extreme) storms were the effect of CMEs. Magnetic clouds contributed 11% of G1 storms, 15% of G2 storms, 9% of G3 storms, and 3% of G4 storms. A comparative statistical occurrence shows that the number of storms decreased during solar cycle 24 when compared with the solar cycle 23. These results showed that the magnetospheric energy transfer decreased in solar cycle 24 and that the magnetosphere was under the influence of intense solar magnetic fields in solar cycle 23. The phenomenon observed in these investigations highlight a drop in solar plasma geoeffectiveness since the long minimum that followed the solar cycle 23.
Key words: Magnetic storms, coronal mass ejections (CMEs), high speed solar winds stream (HSSWs), magnetic clouds (MCs), solar cycle.
INTRODUCTION
The underlying mechanism of solar activity is undoubtedly solar magnetism (Hajra et al., 2016; Kakad et al., 2018) but the understanding of the process of the solar dynamic still remains an important subject of great interest for scientists. Solar activity shows variations over many scales covering a few hours to hundreds of years intervals. One of these continual variations’ consequences is to bring change in magnetospheric current generating geomagnetic storms. So, to understand the solar factor of storms with associated phenomenon may help to anticipate its consequences on earth. Many authors (Kahler, 1992; Gosling, 1993; Shen et al., 2017; Xu et al., 2019) have reported on the well-known role of coronal mass ejections (CMEs) in solar wind disturbances, the changes induced in its magnetic field, velocity and density, and the associated disturbances observed on earth. Although the cause of geomagnetic storms has been established for decades, their solar sources are not well identified and studied until the advent of spacecraft observations from the Solar and Heliospheric Observatory (SOHO) in 1996. Numerous studies on geomagnetic storms and their solar sources have been done in past and recent investigations (Zhang et al., 2007; Gopalswamy., 2008; Verbanac et al., 2011; Echer et al., 2008,2011; Richardson et al., 2006; Richardson and Cane, 2012; Watari, 2017). According to these studies, the main solar sources of intense storms (Dst < -100 nT) are CMEs and two solar sources of geomagnetic storms are generally reported: coronal mass ejections (CME) which are sudden large releases of plasma and magnetic field from the solar corona, and their counterparts in interplanetary space called interplanetary CMEs (ICME). These solar activity phenomenon mostly associated with solar wind flowing from coronal holes are both able to reach earth's magnetosphere and the cause geomagnetic storms, aurora and even damage to power grids when it comes to the mechanism of disturbances in the upper atmosphere. These high-speed solar winds streams (HSSWs) are mostly observed during solar descending phase and interact sometimes with upstream slow streams to produce the co-rotating interaction regions (CIRs). The role of this solar wind conditions in storm occurrence and related geomagnetic activity have been reported by a number of authors (Gosling et al., 1991; Verbanac et al., 2011; Gerontidou et al.., 2018). Magnetic clouds are transient events observed in the solar wind and linked to moderate CMEs (Burlaga et al., 1981). Interplanetary causes of geomagnetic storms and associated manifestations have been fully discussed by Gonzales et al. (2007), Tsurutani et al. (1997), Echer et al. (2008), Richardson et al. (2001), and Richardson and Cane (2012). These authors have reported the rate of occurrence of CMEs and their effects dominate at solar maximum; and that geomagnetic activity is mainly driven by high-speed solar winds (HSSWs) during the descending phase of the solar cycle. The present paper analyzes the sources of geomagnetic storms that occur during the solar cycles 23 and 24 and discusses the differences of occurrence.
METHODOLOGY
To identify the different types of storms, we use the following criterion fully described by Gosling et al. (1991) and the different scales of storms described on http://www.swpc.noaa.gov/NOAAscales/.
In this work, the Kp-index was used which is the global geomagnetic activity index based on 3-h measurements from ground-based magnetometers around the world (Bartels et al., 1939; Menvielle and Berthelier, 1991; Rostoker, 1972) data provided by World Data Cente (WDC) for Geomagnetism, Kyoto, as a parameter of geomagnetic activity level. It describes the disturbance of the earth's magnetic field caused by the solar wind. These data are available at http://wdc.kugi.kyoto-u.ac.jp/dstdir/.
To identify storm strength we employ:
(1) The criteria of Gosling et al. (1991) fully described and adopted by Richardson (2002, 2013): A "major" storm is defined by Kp max ≥ 8 and Kp ≥ 6 for at least an interval of 3 h in a 24 h period. A “big” storm has 7 ≤ Kp max ≤ 7+ and Kp ≥ 6 for at least 3 h in a 24 h period. “Medium” storms are all other cases with Kp max ≥ 6−. A “small” storm has 5− ≤ Kp max ≤ 5+.
(2) The NOAA “G” storm sizes (http://www.swpc.noaa.gov/NOAAscales/): G5 (“extreme”) has Kp=9; G4 (“severe”) has Kp=8 including a 9−; G3 ("strong") reaches Kp = 7; G2 (“moderate”) has Kp=6; and G1 (“minor”) has Kp=5. Over the period from 1996 to 2019, 884 minors to extreme geomagnetic storms were identified: 583 minors storms; 191 moderate storms; 76 strong storms; 31 severe storms and 3 extreme storms. It is important to note that G4 and G5 storms are comparable to a ‘‘major’’ storm in the Gosling et al. (1991) criteria, G3 is comparable to a large storm, G2 to a medium storm, and G1 to a small storm.
To identify the solar sources of geomagnetic storms regardless their sizes, we use data from LASCO observations available in the SOHO/LASCO CME Catalog: https://cdaw.gsfc.nasa.gov/CME_list/. For the period from 1996 to 2019, more than 30,000 CMEs have been observed. Among them, 721 CMEs are halo CMEs. Then, we use the solar wind classification: slow wind (v ≤ 450 km/s) and fast wind (v > 450 km/s) and magnetic clouds data available at http://omniweb.gsfc.nasa.gov/ow.html and https://wind.nasa.gov/mfi/mag_cloud_pub1.html, respectively to perform the identification of the solar sources of geomagnetic storms.
To identify the factors responsible for these storms, we proceeded as in Richardson and Cane (2012) using an automated process that identifies storms as defined in the Kp index and then we look at the different wind factors that may be responsible for the storm. If more than one flux factor is present, the one associated with the highest level of activity is chosen.
RESULTS AND DISCUSSION
Figure 1 shows the pie diagram of the different G-type storms observed during both from the solar cycles 23 and 24. a total of 884 storms have been identified for the two solar cycles: 609 storms in solar cycle 23 and 269 in solar cycle 24. Small storms (G1) represent the most important fraction of storms observed during our investigations: 63% for cycles 23 and 72% for cycles 24 considering the total storm of each solar cycle. The moderate storms (G2) represent 22% for the solar cycle 23 against 21% for the solar cycle 24. The proportion of large storms (G3) is 10% in cycle 23 against 6% in cycle 24. As to major storms (G4+G5), we have the folowing occurence: 5% during the solar cycle 23 against 1% for the solar cycle 24. Only 3 extreme storms (G5) have been recorded during the period covered by the present study. These storms were recorded exclusively during the solar cycle 23. From observations, it appears that large and major storms have a most significant occurrence during the solar cycle 23. This may be due to the very disturbed solar wind conditions observed during the solar cycle 23 (Zerbo et al., 2012, 2013; Lawrence et al., 2020).
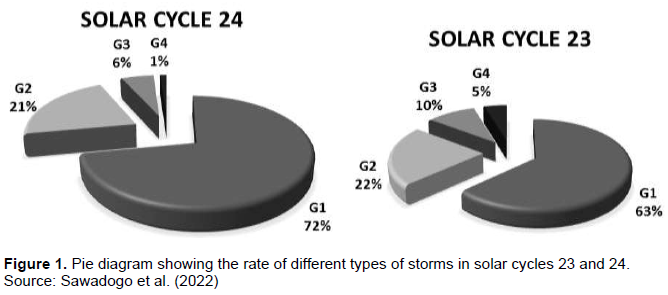
Figure 2 shows the NOAA G-type storms profile as a function of sunspot cycle for solar cycles 23 and 24. This figure shows clearly that magnetic storms occur during all the solar cycle phases. From top to bottom, Figure 2 presents the occurrences of small storms (Figure 2a), moderate storms (Figure 2b), large storms (Figure 2c), and severe storms (Figure 2d), respectively. However, small storms and moderate storms present similar temporal distribution and they are mainly observed in the ascending and descending phases of each solar cycle (Figure 2a and b). Large and severe storms (G3 and G4) are mainly observed around the maximum and the descending phases of the solar cycle (Figure 2c and d). We did not represent extreme storms due to limited statistics (only three extreme storms recorded during this investigation: year 2000 and 2003). Considering small and medium storms, it is easy to remark that higher occurrences have been observed in 2003 for the solar cycle 23, and 2015 for the solar cycle 24. Large and major (severe) present similar distribution both in solar cycles 23 and 24. The most important fractions are observed in year 2004 (G4) and 2005 (G3) for the solar cycle 23 while the highest one is recorded in year 2015 (G3) for the solar cycle 24. When the solar activity increases, the fraction of storms related to the CME flow increases. From minimum to maximum the rate increases and then decreases again for a given solar cycle. This suggests the cyclic dependence of CMEs-associated storms.
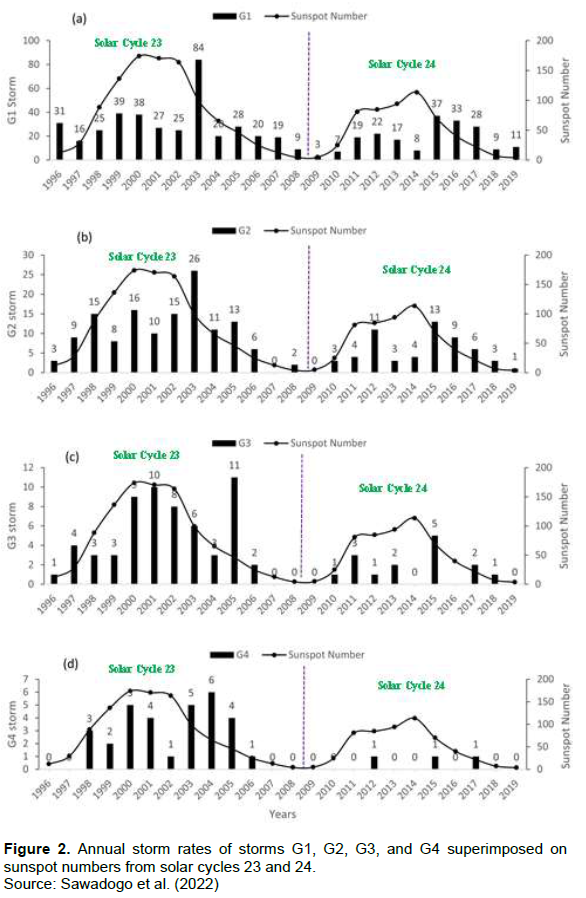
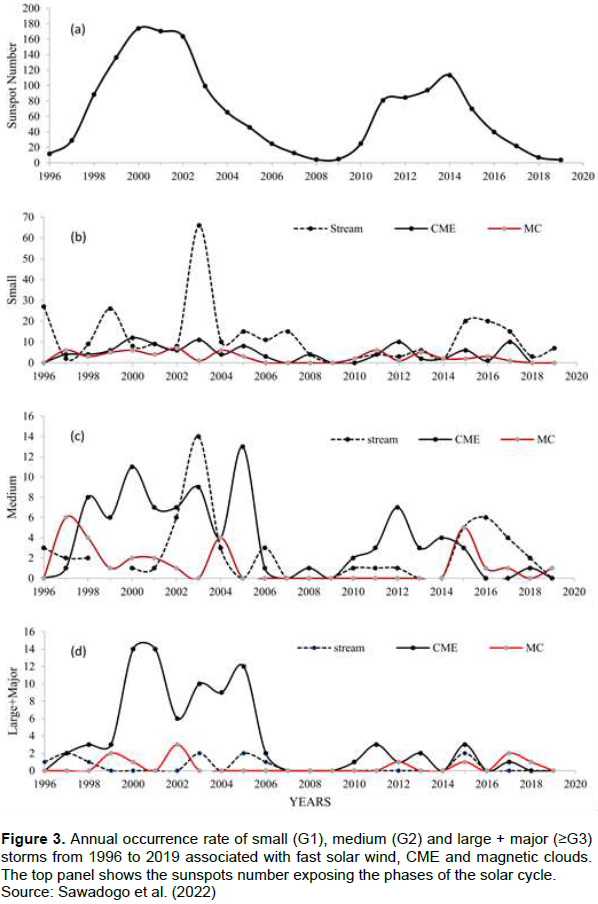
Figure 3 presents the storm occurrence rate of small storms (Figure 3b), moderate storms (Figure 3c) and (large + severe) storms (Figure 3d) considering their associated solar sources together with the sunspot number in the top panel (Figure 3a). Magnetic storm occurs at any phase of solar cycle as shown in Figure 3 regardless of their associated solar sources. From this figure, one can see that storms associated to the fast solar wind are usually the small and moderate storms with the most important occurrence (peaks) in the descending phase of both the solar cycles 23 and 24 (Figure 3b and 3c). The peak observed for storm associated to fast solar wind is in agreement with solar wind dynamics according to which the most important high stream solar wind occurs on the declining of sunspot cycle (Zerbo et al., 2013). Furthermore, it can be seen from Figure 3 that the rate of storms caused by fast winds follows the size of the sunspot cycle, that is, the rate of storms is higher during the solar cycle 23 than the solar cycle 24. Storms related to magnetic clouds are mainly the moderate storms (G2) with peak in occurrence observed around solar maximum.The storms associated with the CME are moderate and major storms (Figure 3c and 3d) with peaks observed at the maximum phase (for major storms) and the descending phase (for moderate) of each cycle. We can also remark that the rate of these storms is closely related to the level and the size of the solar cycle. This geomagnetic response of solar activity is in agreement with the predictions since the number of CME increases from minimum to maximum (Webb and Howard, 1994, Richardson and Cane, 2010, 2012) and suggest that NOAA G-storms occurrence is well correlated with the level of geomagnetic shock activity reviewed in previous studies (Legrand and Simon, 1989; Richardson and cane, 2002; Zerbo et al., 2012). About 22% of all solar cycle 23 storms were caused by CMEs while only 17% of solar cycle 24 storms were the cause of CMEs. Yet observations show that there were more CMEs in cycle 24 than in cycle 23. This shows that the magnetosphere was under the influence of higher magnetic fields carried out by CMEs/ICMEs in solar cycle 23 than in cycle solar 24. These findings are in agreement with Lawrance et al. (2020) where the relationships between interplanetary coronal mass ejection characteristics and geoeffictiveness have been reported. Kakad et al. (2019) carried out a study to examine the variations in global energies available to the Sun and the earth's upper atmosphere during the solar cycles 22,23 and 24 and concluded that there is a weakening of the solar magnetic field at cycle 24; a decrease of approximately 54% in the energy transferred to the magnetosphere during solar cycle 24 compared to the energy transferred at cycle 23; a decrease in the average strength of the equatorial electrojet, the auroral electrojet current AE and the low latitude annular current (Dst) as well as a decrease in Joule heating from auroral electrojet currents during solar cycle 24.
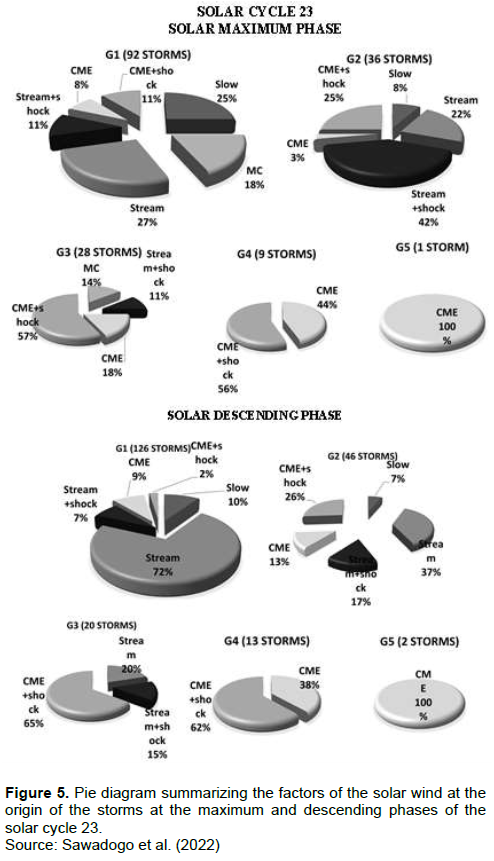
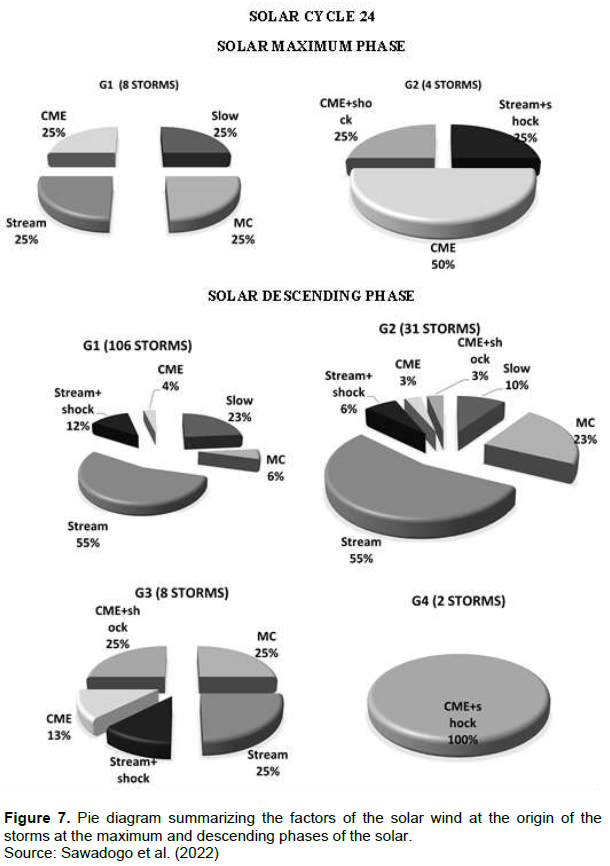
Figures 4 to 7 summarize the occurrence frequencies of the solar wind factors associated storms during the solar cycles 23 and 24 phases. Figures 4 and 5 are devoted to solar cycle 23 while Figures 6 and 7 are for solar cycle 24.
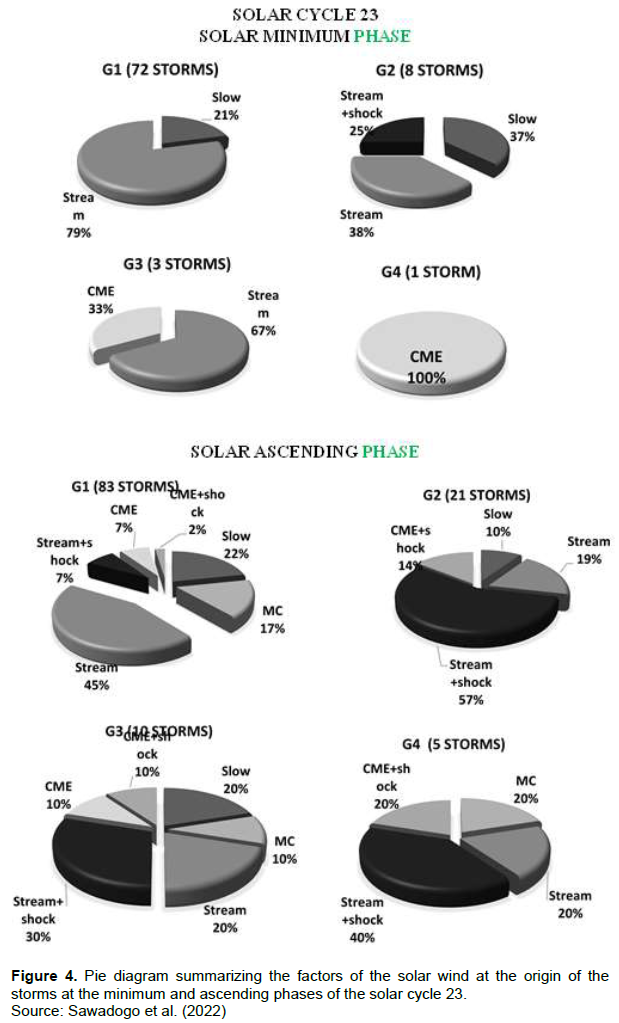
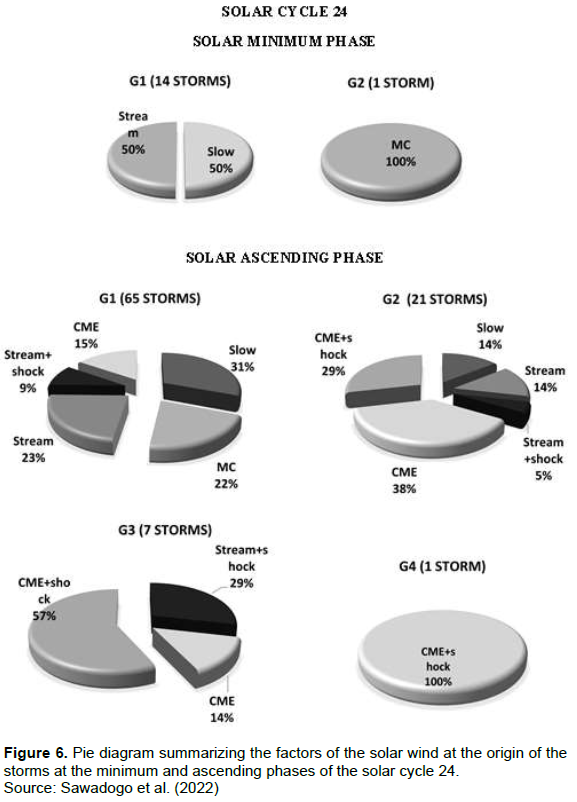
At solar cycle 23 minimum of phase (Figure 4), high streams associated storms rate is ~79% for G1 storms, 63% for G2 storms, 25% of which are accompanied by shocks, 67% for G3 storms while CME-associated storms are ~33% for G3 storms and 100% for G4 storms. Slow winds contribution is ~21% for G1 storms and 37% for G2 storms. At solar cycle 24 minimum phase (Figure 6), high streams associated storms are 50% of G1 against the 50% other rate related to slow winds. G2 storms are all related to magnetic clouds (MC).
In the ascending phase of solar cycle 23 (Figure 4), fast winds are responsible for 52% of G1 storms, 7% of which are accompanied by shocks, 76% of G2 storms of which 57% are accompanied by shocks, 50% G3 storms including 30% accompanied by shocks, 60% of G4 storms including 40% accompanied by shocks. CME-associated storms represent 9% of G1 storms, 2% of which were accompanied by shocks, 14% of G2 storms all accompanied by shocks, 20% of G3 storms including 10% accompanied by shocks, and 20% of G4 storms all accompanied by shocks. Slow winds were responsible for 22% of G1 storms, 10% G2 storms and 20% G3 storms. Magnetic clouds are responsible for 17% of G1 storms, 10% of G3 storms and 20% of G4 storms. During the solar cycle 24, fast winds have driven 32% of G1 storms, 9% of which are accompanied by shocks, 19% G2 storms including 5% accompanied by shocks and 29% G3 storms all accompanied by shocks. CMEs were responsible for 15% of G1, 38% of G2, 73% of G3 including 57% accompanied by shocks and 100% of G4 all accompanied by shocks. The occurrence rate of storms associated with magnetic clouds represents only22% of G1 storms.
At the solar maximum of solar cycle 23 (Figure 5), the fast-solar winds induced 38% of G1 storms, 11% of which were accompanied by shocks, 64% G2 storms including 42% accompanied by shocks, and 11% G3 storms all accompanied by shocks. CMEs were responsible for 19% of G1 storms, 11% of which were accompanied by shocks, 28% G2 storms including 25% accompanied by shocks, 75% of G3 including 57% accompanied by shocks; 100% of G4 including 56% accompanied by shocks and 100% of G5. Magnetic clouds caused only 18% of G1 storms. Storms associated to slow winds rates are 25% of G1 storms and 8% of G2 storms. During maximum phase of the solar cycle 24 (Figure 7), only G1 and G2 storms were observed. Fast winds are responsible for 25% of G1 storms and 25% of G2 storms all accompanied by shocks. Magnetic clouds contributed to 25% of G1 storms. The rest, 25% of G1 storms are related to slow winds.
During the descending phase of solar cycle 23, fast-solar winds are responsible for 79% of G1 storms, 7% of which are accompanied by shocks, 54% G2 storms including 17% accompanied by shocks, 35% of G3 including 15% accompanied by shocks. CMEs-associated storms are 100% G4 and G5 storms, with 62% of G4 amplified by shock. In solar cycle 24, fast-solar winds caused 67% of G1 storms (12% of which were accompanied by shocks), 61% of G2 storms including 6% accompanied by shocks, and 37% of G3 storms including 12% accompanied by shocks. CMEs are responsible for 100% of G4 storms all accompanied by shocks, 38% of G3 storms including 25% accompanied by shocks, 6% of G2 including 3% accompanied by shocks and 4% of G1 storms. At the minimum and maximum phases of solar cycle 24, only small and medium storms were observed, while at the same period of solar cycle 23, in addition to G1 and G2 storms, large storms G3 and severe storms G4 were observed. This may be due to the weak in solar cycle 24 compared to solar cycle 23 reported in many studies (McComas et al., 2008; Zerbo and Richardson, 2015). A global overview from Figures 4 to 7 shows that the level and the occurrence rate of all the storms regardless of their associated source is higher during the solar cycle 23 than the solar cycle 24. It implies that the wind flow was more geo-effective in solar cycle 23 than it was in solar cycle 24. For a global overview, the present study highlights that the high stream solar wind causes are about 59% G1 storm, ~50% of G2, ~29% of G3, and ~10% of G4 storm. Coronal mass ejections (CMEs) were responsible for about 10% of G1 storms, 26% of G2 storms, 59% of G3 storms, 87% of G4 storms and 100% of G5 storms. Magnetic clouds induce 11% of G1 storms, 15% of G2 storms, and 9% of G3 storms. From all these observations it appears that major (extreme and severe) storms are the manifestations of coronal mass ejections. This observation is in agreement with previous works and extend their findings (Zhang et al., 2007; Richardson et al., 2012; Zhang et al., 2007) have shown that about 87% of intense storms (Dst ≤ -100 nT) were related to CMEs and the rest to solar wind conditions. Richardson et al. (2012) have also reported that about 96% of G4 and G5 storms are almost exclusively driven by flows associated with the CMEs.
CONCLUSION
This study’s investigations on storms and associated factors during the solar cycles 23 and 24 led to interesting results.
Storms caused by flows associated with CME have a rate of occurrence that follows the size of the cycle of solar activity. Storms associated with high streams solar winds are predominant during the descending phase of each solar cycle and are the main contributors to small (G1) and medium (G2) storms. As the activity increases, the shock accompanying the wind factors associated to storms increases. As to storms related to the magnetic clouds, they are mainly the G1-storms (small) and G2-storms (medium storms). At the minimum and maximum phases of solar cycle 24, only small and medium storms were observed, while at the same period of solar cycle 23, in addition to G1 and G2 storms, large storms G3 and severe storms G4 were observed. This may be explained by the weak solar wind condition during the cycle 24. Based on previous studies (Kakad et al., 2019; Lawrance et al., 2020) and our present results, we suggest that earth atmosphere was under quiet solar wind conditions and associated effects during the solar cycle 24 than it was during the solar cycle 23. The phenomenon observed in the present investigations highlight a drop in solar plasma geoeffectiveness since the long minimum that followed the solar cycle 23.
CONFLICT OF INTERESTS
The authors have not declared any conflict of interests
ACKNOWLEDGEMENT
The authors thank the reviewers for their detailed and insightful comments and constructive suggestions. Special thanks to all providers of data used (OMNIweb from NASA Goddard Space Flight Center to provide solar wind data, International Services of Geomagnetic Indices to provide Kp data, Royal Observatory of Belgium for providing sunspot number, NOAA, SOHO/LASCO catalogue for provided CMEs list).
REFERENCES
|
Bartels J, Heck NH, Johnston HF (1939).The Three-Hour-Range Index Measuring Geomagnetic Activity. Terrestrial Magnetism and Atmospheric Electricity 44(4):411-454. |
|
|
Burlaga L, Sittler E, Mariani F, Schwenn R (1981). Magnetic Loop behind an Interplanetary Shock: Voyager, Helios, and IMP 8 Observations. Journal of Geophysical Research: Space Physics 86(A8):6673-6684. |
|
|
Echer E, Gonzalez WD, Tsurutani BT (2011). Statistical Studies of Geomagnetic Storms with Peak Dst≤−50nT from 1957 to 2008. Journal of Atmospheric and Solar-Terrestrial Physics, Influence of Solar Activity on Interplanetary and Geophysical Phenomena 73(11):1454?1459. |
|
|
Echer E, Gonzalez WD, Tsurutani BT, Clua-Gonzalez AL (2008) Interplanetary Conditions Causing Intense Geomagnetic Storms (Dst ≤ −100 nT) during Solar Cycle 23 (1996-2006) ». Journal of Geophysical Research: Space Physics 113(A5). |
|
|
Gerontidou M, Mavromichalaki H, Daglis T (2018). High-Speed Solar Wind Streams and Geomagnetic Storms During Solar Cycle 24. Solar Physics 293(9):1-18. |
|
|
Gonzalez WD, Echer E, Gonzalez AL, Tsurutani BT (2007). Interplanetary Origin of Intense Geomagnetic Storms (Dst < −100 nT) during Solar Cycle 23 ». Geophysical Research Letters 34(6). |
|
|
Gopalswamy N (2008). Solar Connections of Geoeffective Magnetic Structures. Journal of Atmospheric and Solar-Terrestrial Physics, Coupling of Solar Wind, Magnetosphere, Ionosphere and Upper Atmosphere 70(17):2078?2100. |
|
|
Gosling JT (1993). The Solar Flare Myth. Journal of Geophysical Research: Space Physics 98(A11):18937?18949. |
|
|
Gosling JT, McComas DJ, Phillips JL, Bame SJ (1991). Geomagnetic Activity Associated with Earth Passage of Interplanetary Shock Disturbances and Coronal Mass Ejections ». Journal of Geophysical Research: Space Physics 96(A5):7831?7839. |
|
|
Hajra R, Chakraborty SK, Tsurutani BT, DasGupta A, Echer E, Brum CGM, Gonzalez WD, Humberto J, Sobral A (2016). An Empirical Model of Ionospheric Total Electron Content (TEC) near the Crest of the Equatorial Ionization Anomaly (EIA) ». Journal of Space Weather and Space Climate 6:A29. |
|
|
Kahler SW (1992). Solar Flares and Coronal Mass Ejections». Annual Review of Astronomy and Astrophysics 30(1):113?141. |
|
|
Kakad B, Kakad A, Ramesh DS, Lakhina GS (2019). Diminishing Activity of Recent Solar Cycles (22-24) and Their Impact on Geospace ». Journal of Space Weather and Space Climate 9:A1. |
|
|
Lawrance MB, Moon YJ, Shanmugaraju A (2020). Relationships between Interplanetary Coronal Mass Ejection Characteristics and Geoeffectiveness in the Declining Phase of Solar Cycles 23 and 24. Solar Physics 295(4):62. |
|
|
McComas DJ, Ebert RW, Elliott HA, Goldstein BE, Gosling JT, Schwadron NA, Skoug RM (2008).Weaker Solar Wind from the Polar Coronal Holes and the Whole Sun. Geophysical Research Letters 35:18. |
|
|
Menvielle M, Berthelier A (1991). The K-Derived Planetary Indices: Description and Availability. Reviews of Geophysics 29(3):415-432. |
|
|
Richardson IG (2013). Geomagnetic Activity during the Rising Phase of Solar Cycle 24. Journal of Space Weather and Space Climate 3:A08. |
|
|
Richardson IG, Cane HV (2010). Near-Earth Interplanetary Coronal Mass Ejections During Solar Cycle 23(1996 - 2009): Catalog and Summary of Properties. Solar Physics 264(1):189?237. |
|
|
Richardson IG, Cane HV (2012). Solar Wind Drivers of Geomagnetic Storms during More than Four Solar Cycles. Journal of Space Weather and Space Climate 2:A01. |
|
|
Richardson IG, Cliver EW, Cane HV, White NE (2002), Long-term Trends in Interplanetary Magnetic Field Strength and Solar Wind Structure during the 20th Century. Journal of Geophysical Research: Space Physics, 107(A10), SSH-12. |
|
|
Richardson IG, Webb DF, Zhang J, Berdichevsky DB, Biesecker DA, Kasper JC, Kataoka R, et al. (2006). Major Geomagnetic Storms (Dst ≤ −100 nT) Generated by Corotating Interaction Regions ». Journal of Geophysical Research: Space Physics 111:A7. |
|
|
Richardson JD, Wang C, Paularena KI (2001). The Solar Wind: From Solar Minimum to Solar Maximum. Advances in Space Research 27(3):471-479. |
|
|
Rostoker G (1972). Geomagnetic Indices. Reviews of Geophysics 10(4):935?50. |
|
|
Shen F, Wang Y, Shen C, Feng X (2017). On the Collision Nature of Two Coronal Mass Ejections: A Review ». Solar Physics 292(8):104. |
|
|
Tsurutani BT, Gonzalez WD, Kamide Y (1997). Magnetic Storms. Surveys in Geophysics 18(4):363?383. |
|
|
Verbanac GB. Živkovi? VS, Hojsak T, Veronig AM, Temmer M (2011). Solar Wind High-Speed Streams and Related Geomagnetic Activity in the Declining Phase of Solar Cycle 23. Astronomy & Astrophysics 533:A49. |
|
|
Watari S (2017). Geomagnetic storms of cycle 24 and their solar sources. Earth, Planets and Space 69(1):70. |
|
|
Webb DF, Howard RA. (1994). The Solar Cycle Variation of Coronal Mass Ejections and the Solar Wind Mass Flux ». Journal of Geophysical Research: Space Physics 99(A3):4201?4220. |
|
|
Xu Q, Xu X, Chang Q, Rong Z, Wang J, Xu J, Zhang T (2019). Observations of the Venus Dramatic Response to an Extremely Strong Interplanetary Coronal Mass Ejection ». The Astrophysical Journal 876(1):84. |
|
|
Zerbo JL, Amory Mazaudier C, Ouattara F, Richardson JD (2012). Solar Wind and Geomagnetism: Toward a Standard Classification of Geomagnetic Activity from 1868 to 2009 ", Annales Geophysicae 30(2):421 426. |
|
|
Zerbo JL, Ouattara F, Amory-Mazaudier C, Legrand JP, Richardson JD (2013). Solar Activity, Solar Wind and Geomagnetic Signatures. Atmospheric and Climate Sciences 3:610-617. |
|
|
Zerbo JL, Richardson JD (2015). The Solar Wind during Current and Past Solar Minima and Maxima". Journal of Geophysical Research: Space Physics 120(12):10-250. |
|
|
Zhang J, Richardson IG, Webb DF, Gopalswamy N, Huttunen E, Kasper JC, Nitta NV, Poomvises W, Thompson BJ, Wu CC, Yashiro S (2007). Solar and Interplanetary Sources of Major Geomagnetic Storms (Dst ≤ −100 nT) during 1996-2005. Journal of Geophysical Research: Space Physics 111(A7). |
|
Copyright © 2024 Author(s) retain the copyright of this article.
This article is published under the terms of the Creative Commons Attribution License 4.0


