Full Length Research Paper
ABSTRACT
The international outsourcing of intermediate products is a common practice in manufacturing. Although outsourcing labor- and resource-intensive production to developing countries is based on financial motives, the decision should also be evaluated from an environmental perspective at a global scale. In this study, the environmental effects of four supply chain scenarios are analyzed through a life-cycle assessment (LCA) of a cast iron component. The study reveals that when upstream manufacturing activities are performed in Mexico, the Global Warming Potential (GWP), Ozone Depletion Potential (ODP) and ecotoxicity levels might be comparable with those of manufacturing activities performed in the U.S. However, in China- and India-based outsourcing scenarios, the GWP, ODP and ecotoxicity levels are two to three times higher than those of U.S.-based scenarios. The main causes of the higher levels of GWP, ODP and ecotoxicity in China and India are related to differences in the amount of scrap metal usage, sources of electricity generation, transportation modes, material transport distances, and emissions control practices.
Key words: Life cycle assessment (LCA), global warming, ozone depletion, ecotoxicity, international trade, metal casting.
INTRODUCTION
Environmental problems are global issues, and governments are addressing these problems on a global scale through the adoption of international treaties, such as the Montreal Protocol (1987) and the Paris Agreement (UNFCCC.COP 2015). Such treaties are aimed at regulating the emissions of certain materials into the environment by placing the responsibility for their control on the participating countries; however, a number of studies (Davis and Caldeira 2010; Peters et al., 2011; Frankel, 2009) have indicated that international trade has made it more difficult for developing countries to achieve their targets. International outsourcing of intermediate products has been a common business practice in recent decades. Labor- and resource-intensive production is outsourced to countries that present lower associated costs (Yuskavage et al., 2008; Dachs et al., 2006). The iron and steel industries are associated with energy-, material- and labor-intensive processes (Dalquist and Gutowski, 2004; Pal et al., 2008). In 2014, 452 million tons of finished and semi-finished steel products were exported (29.1% of the total production in the world), with China exporting 92.9 million tons of steel products (WSA, 2015). In the same year, the top three importing countries and regions were the U.S., European Union countries, and South Korea. With regard to the metal casting industry, China, with 44.5 million tons of annual production in 2013, is by far the largest producer in the world, followed by the U.S. and India (MC, 2014). In 2013, China, Canada, and Mexico were the top three suppliers of castings to the U.S. (FG, 2015).
The environmental footprint of the iron and steel industries is associated with their consumption of energy and high levels of production (IEA, 2007). Manufacturing iron and cast iron products is one of the major sources of CO2 and toxic materials released to the environment (PESI, 2003). In the global manufacturing sector, iron and steel industries are responsible for 27% of the total CO2 emissions (IEA, 2007). The main sources of CO2 and toxic emissions are related to the generation of electrical energy, production and burning of metallurgical coke, melting of scrap metals, and processes for molding (IEA, 2007; PESI, 2003).
Life Cycle Assessment (LCA) is a common approach to assess the environmental impacts of products, processes and systems supported by European Commission (ECJRC, 2010) and standardized by International Organization for Standardization (ISO 2006a, b). In iron and steel industries there are numerous LCA studies conducted to measure the emissions, resource consumptions and health impacts associated with the production, usage and consumption of iron and steel products. Bieda (2012a) and Burchart-Korol (2011b) studied the pig iron production, and Bieda (2012b) and Chen et al. (2011) focused on the steel making process through basic oxygen furnace method. Environmental impacts of cupola furnaces are presented by Dalquist and Gutowski (2004) from the energy consumption point of view only and by Joshi et al. (2011) for the production conditions specific to India. However, there is no LCA study performed for cast iron production with cupola furnaces for the selected countries with the international transportation perspective included. In this study, the environmental issues caused by the current industrial practices in manufacturing and transportation systems related to international trade are discussed and the major differences in primary energy sources among trading countries are presented.
To estimate and compare the environmental impacts, the operations of a U.S.-based manufacturing company that specializes in manufacturing cast iron valves is studied and compared with that of four international supply chain scenarios.
METHODS
To track the environmental impacts, the Life-Cycle Assessment (LCA) method is applied. The LCA is a methodological approach to the environmental management of products and processes. In this study, guidelines from ISO 14040 and 14044 (ISO 2006a, b) are adopted to perform the LCA study. According to the ISO reference documents, the LCA consists of four main steps: (1) Goal and scope definition; (2) Inventory analysis; (3) Impact assessment; and (4) Interpretation.
Goals
The goals of this study are to analyze and compare the environmental impacts of manufacturing a sand cast component through four alternative global supply chain scenarios.
Scope
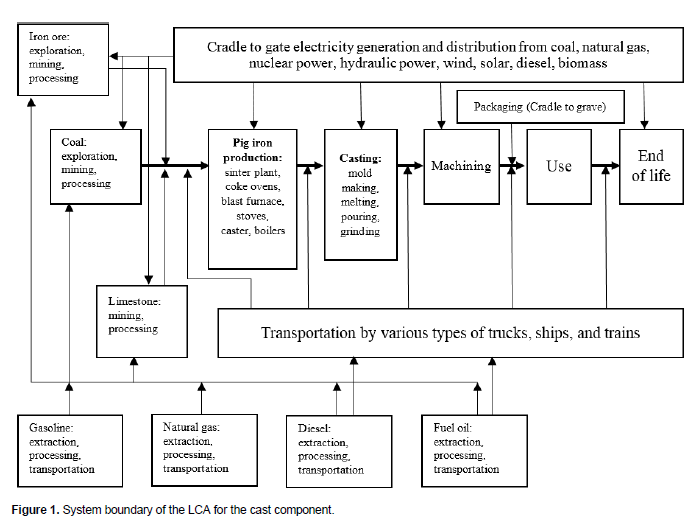
A cradle-to-grave model, which includes relevant manufacturing activities based on the literature (Joshi et al., 2011; Dalquist and Gutowski 2004; ASMI, 2002), is developed to manufacture a finished cast iron valve body. The scope of the study and the activities are presented in Figure 1. The life cycle of the valve body starts with the extraction of raw materials and energy sources. Transportation, manufacturing and packaging are also included in the scope. For the final stage, the end-of-life recycling of the cast component is included.
Functional unit
In this study, the functional unit is the body of a control valve made of cast iron, and it weighs 1.542 kg. After machining, the weight is reduced to 1.361 kg.
Modeling
Four scenarios are developed to compare their global environmental effects. The upstream processes, including ore mining, pig iron production, and casting, are located in different countries with different characteristics. In each scenario, the downstream operations, which include machining, use, and end-of-life phases, are the same and located in the U.S. After the upstream operations are completed, the cast valves are shipped to the valve manufacturing plant in Tennessee (U.S.). In the first scenario, the upstream operations are located in the U.S.; in the second scenario, they are located in China; in the third scenario, they are located in India; and in the fourth scenario, they are located in Mexico. The countries were selected based on their production and export volumes to the U.S. (WSA, 2015; MC, 2014; FG, 2015). For the downstream manufacturing operations, a Tennessee (U.S.)-based manufacturing plant is used as a reference.
Life-cycle inventory (LCI)
To create life-cycle inventories, the total resource consumption in the form of energy and material and the emissions into the air, water, and soil are quantified. LCI models are adopted from the National Renewable Energy Laboratory (NREL) LCI database (NREL, 2012), GaBi database (GaBi 2011) and Chinese LCI database (IKEET, 2012). If new data or parameters are found in the literature, the model is updated. If a model for these databases is not available, a new model is created from the literature. If the available model is not representative of the regional characteristics, then it is modified. Modifying the model with available regional parameters is a recommended method (de Eicker et al., 2010a, b). The aggregate LCI and LCIA values are calculated using the GaBi software package, version 6.0 (GaBi, 2011). In the next section, LCI models of major activities are explained.
Pig iron production
Pig iron is a primary input material for cast iron parts. LCI models for pig iron production are created specifically for each country in the cradle-to-gate approach, and the first process is ore mining. To model the LCI of pig iron production, two sources are used. The first source is an LCI study conducted at a Canada-based integrated steel mill equipped with a blast furnace (ASMI, 2002). Using this study, the models are derived for pig iron production from the U.S., India, and Mexico. The models are built by articulating suitable sub-models for the modifications. To model the raw material activities, the limestone extraction; lime production; iron ore exploration and development; hematite mining, crushing, concentrating and pelletizing; magnetite mining and processing; and coal exploration, mining and processing activities are included. Locations of raw materials, modes of transportation and the transportation distances are explained in the section titled “transportation models”. To model the pig iron production, the sinter plants, coke ovens, blast furnaces, stoves, casters, and boilers are included in the system. For these activities, material and emission balances are derived from the reference study (ASM, 2002), however, the input energy sources are replaced with current country specific values.
To model the China-based pig iron production, the Chinese LCI database is used. In the database, the process is modeled as a black-box process, and it is not suitable for modifications for other countries.
Casting with cupola furnaces
A reference model representing the operations of a foundry equipped with a cupola furnace is created and modified for each scenario. The cupola is the most common technology used in producing cast iron (BCSI, 2005; CAI, 2004; ILFSEL, 2010). LCI models for casting processes are created according to the NREL database model. The model consists of melting, pouring, and cooling and then shakeout and post-shakeout operations (Sauer, 2016). The LCI database model of the cupola furnace can be modified for each country by changing the origin of the electricity, the source of raw materials, the mix of the furnace charge, and the yield of the casting. The emissions values are adopted from documented actual emissions test results (TLLC, 2000; NREL, 2012; PESI, 1999).
For the metallic charge mix, each foundry can use a different material mix ratio based on the availability of the charge materials. The charge mix of cupola furnaces consists of pig iron and scrap materials. In the U.S., the typical charge mix for cast iron consists of 20% pig iron and 80% scrap (Davis, 1996; Dalquist and Gutowski 2004; U.S.GS, 2013), whereas for the Indian model, the ratio is 80% primary material and 20% foundry scrap (Joshi et al., 2011). In Mexico, ferrous scrap currently constitutes 37% of the total material input in the iron- and steel-making industries (Flores, 2013), whereas in China, the rate of scrap consumption is approximately 10% (BIR, 2015). Based on the size of the cast part, the casting yield is assumed to be 70% for all countries (CAI, 2004), with the remaining 30% allocated to knocked-off feeders and runners and rejected castings with defects. For all of the scenarios, all of the foundry scrap is assumed to be re-melted with 100% efficiency. Considering the scrap metal availability for each country and the casting yield, the cupola charge is assumed to be 70% pig iron and 30% foundry scrap for all scenarios except the first scenario.
Transportation models
To model the life-cycle inventories of the transportation activities, the manufacturing locations, distances, and transportation modes are identified. The distances are calculated by the Web mapping applications Google Maps (2016), sea-distances.org (2016), and Cargorouter (2016). The locations for the mining sites, foundry sites and ports are based on personal conversations with the company design engineer, C. Lax (2015) as well as a literature review, the available modes of transportation, and the calculated shortest distances between the points of interest. The modes of transportation are determined from the literature.
Transportation model of scenario 1
In scenario 1, the iron ore is assumed to be mined from the Minnesota Iron Range and shipped to a steel plant in Ohio. The lime stone is extracted in Ohio, and the coal is mined in West Virginia. The limestone is transported by trucks 125 km. The iron ore is transported by train 80 km and then by ship 1,339 km. The coal is transported by train 552 km. The pig iron is transported from the Ohio steel mill to the foundry in Pennsylvania via trucks 204 km. The cast parts are carried to the valve manufacturing plant in Tennessee 1,090 km on trucks. Finally, the machined valve bodies are shipped to the dealers in the Midwest on trucks. The average shipping distance from the manufacturing plant to the dealers is assumed to be 480 km.
In this scenario, central and northeast heavy duty truck models from NREL-LCI are applied to simulate the truck transportation, and the NREL-LCI diesel train model is applied to simulate railway transportation. In the literature, bulk cargo ships for lake transportation are characterized as diesel-powered large ships with a capacity of up to 70,000 tons (U.S. DTMA, 2013). The NREL-LCI “diesel powered ocean freighter” model is applied to simulate water transportation.
Transportation model of scenario 2
In the second scenario, the LCI model of pig iron production includes all of the transportation-related LCIs; thus, ore transportation is not separately modeled, whereas transportation activities after pig iron production are modeled.
In China, 70% of the iron and steel production is located in the east, southeast, and northeast regions (U.S.ITC, 2005), and Jiangsu is one of the top steel-producing provinces (Pan, 2011). Thus, Jiangsu is selected for the location of the foundry. The cast parts are transported by trucks 95 km from the foundry to the port in Shanghai and then shipped 18,831 km to the port in Savannah, Georgia (U.S.). From Savannah, the cast parts are shipped to the valve-manufacturing plant in Tennessee by truck.
In China, nearly all transportation among suppliers, customers, manufacturers, warehouses, and shipping centers is performed by non-container-carrying heavy-duty diesel trucks (Jun and Bensman, 2010; Duan et al., 2015), and the typical gross weight of these trucks is 17 tons (Li, 2014). Thus, the “18-ton diesel truck” profile is adopted from the Chinese-LCI database. For ocean transportation, the “27,500-ton deadweight capacity, heavy fuel oil driven container ship” profile is selected from the GaBi database. For inbound transportation, U.S. truck profiles for the southeast and central regions are selected from the NREL-LCI database.
Transportation model of scenario 3
For India, all of the transportation modes (truck and train) and distances for the pig iron production activities are adopted from the study by Joshi et al. (2011). The parameters for the remainder of the transportation activities are based on the assumptions made for the foundry and port locations.
In India, the foundry industry is geographically clustered around industry centers to minimize the transportation costs (U.S. ITC, 2005). Since 46% of the foundries in Coimbatore are specialized in pump and valve manufacturing (Das et al., n.d), for the casting location of valve bodies, the Coimbatore foundry cluster is selected. Indian foundries use the closest international port to ship their products (KPLIL, 2003). For the Coimbatore foundry cluster, the international port of Cochin, which is 200 km away from the foundry, is the most suitable port. The total travel distance for water transportation is 21,836 km from the port in Cochin (India) to the port in Norfolk, Virginia (U.S.). From Virginia, the parts travel 1,313 km on trucks to Tennessee.
The characterization of locomotives is based on the engine type and carrying capacity. As of 2014, 5,633 diesel and 4,823 electric freight locomotives were operating in India. From 2013 to 2014, diesel trains traveled 558 km and electric trains traveled 473 km on average per day. In the same time frame, the average load of a diesel train was 1,560 tons and the average load of an electric train was 1,755 tons (GIMR, 2015). Thus, from the GaBi database, a locomotive model with mixed fuel consumption (diesel and electric) and a gross weight capacity of 2,000 tons is selected. In India, heavy-duty vehicles handle most of the freight transportation and have average loads of 16.4 tons, and most of these trucks are equipped with diesel engines with emissions standards similar to Euro 2 (Joshi et al., 2011; JPSALC, 2011). For truck transportation, the “22-ton payload capacity, Euro 2, cargo truck” model is selected from the GaBi database. For sea transportation, the “27,500-ton deadweight capacity, heavy fuel oil-driven container ship” model is selected from the GaBi database. Truck transportation in the U.S. is modeled according to the NREL-LCI models for the southeast and central regions.
Transportation model of scenario 4
For the fourth scenario, the state of Coahuila (Mexico) is selected as the location for all of the casting activities because of its proximity to the U.S. border, strength of ferrous industries, and availability of resources for producing iron (Espinosa, 2014; U.S.ITC, 2005). The Hercules region has iron ore, the San Lorenzo region has limestone mines, the Golfo de Sabinas region has coal mines, and the city of Monclova in Coahuila is one of the top three casting producers in Mexico (SGMSE, 2014; U.S.ITC, 2005).
The only mode of transportation available from Monclova to the Hercules and San Lorenzo regions is road transportation. The iron ore is transported 354 km by truck from Hercules to Monclova, and the limestone is transported 258 km from San Lorenzo to Monclova. The coal is transferred by trains 120 km. The cast parts are sent from Monclova to the Laredo (Texas) port of entry at the U.S.-Mexico border. U.S. trucks then pick up the cargo from the warehouses at Laredo and distribute it throughout the U.S. Cast parts are assumed to be transported from Monclova to Laredo (381 km) on Mexican trucks and from Laredo to Tennessee (1,649 km) on U.S. trucks.
The average age of Mexican trucks is seventeen years old (DGAF, 2015), and the emissions standards for heavy duty trucks have been in effect since 1993 (ICCT, 2014). Based on the emissions standards for that age group, Mexican trucks are modeled as Euro 3 diesel engine trucks with 27 tons of payload capacity. The locomotives that run between Monclova and Sabinas are operated by the Ferromex transportation company. The fleet consists of diesel locomotives with an average power of more than 3,000 hp (FMSADECV, 2015). GaBi’s closest railway transportation model for the identified characteristics is a diesel locomotive with 1,452 tons of payload capacity. The U.S. trucks are modeled for the south and central regions from NREL-LCI.
Electricity models
Electricity is the major form of energy consumed in every step of the product life cycle. Typically, 27% of the energy consumption in casting processes is electrical energy (Eppich, 2004). Thus, the electricity production mixes for each country are updated based on the fuel sources.
U.S. electricity model
In the U.S., there are five non-unified power grids known as interconnections (U.S.EIA, 2015a). Because all of the manufacturing activities occur in the eastern region, only the eastern interconnection profile is modeled in the study.
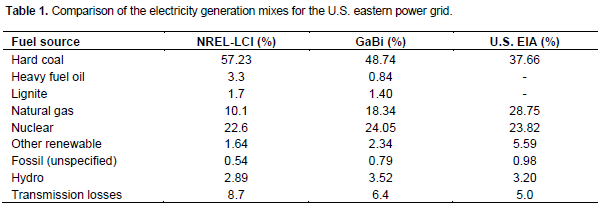
Among the available data sources, the oldest is the profile from the NREL database, which was modeled in 2000, whereas the GaBi energy model dates from 2010. Thus, the GaBi model is updated according to the electricity generation mixes and energy losses calculated from the U.S. Energy Information Administration monthly reports for the eastern interconnection (U.S. EIA 2015b, 2015c) is shown in Table 1.
Chinese electricity model
In the GaBi database, China’s electricity generation mix is modeled as a national average. However, China has seven power grids that work independently (U.S.EIA, 2015d). In this study, all of the casting activities are assumed to be located in the state of Jiangsu, which is served by the east power grid. Therefore, a model for the east power grid is created using the Chinese LCI database (IKEET, 2012).
Indian electricity model
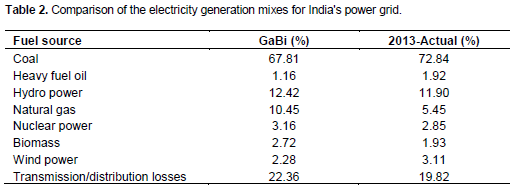
India has had a unified power grid since 2013, and it uses a continuously changing energy mix (U.S.EIA, 2015e). GaBi includes an LCI model for Indian electricity generation processes, and it uses 2011 as the reference year. An updated electricity model is created based on the actual electricity generation for 2013 as shown in Table 2 (IEA, 2015).
Mexican electricity model
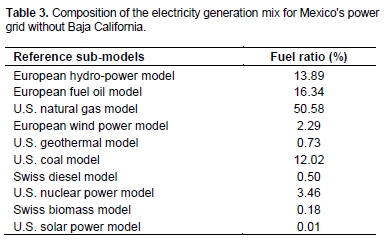
An LCI model for Mexico’s electricity generation is not available in the Gabi database. Therefore, a new model is created using the available LCI sub-models with similar electricity production characteristics (Itten et al., 2012) and actual fuel mix ratios for 2014 (SE, 2015). Because the Baja California power grid is not connected to the national grid and all relevant manufacturing activities are located in the northeast of Mexico, the actual fuel mix ratios for Mexico are calculated by excluding Baja California’s electricity generation mix. In addition, transmission and distribution losses of 5.98% are considered (SE, 2015). The reference sub-models and fuel mixes are calculated as shown in Table 3.
Machining
Machining operations consist of turning and thread-cutting operations. Three sides of the valve body are machined on a Mori Seiki LII CNC turning center (Lax, 2015). The operations require 144 s, consume 1.66 MJ of electrical energy per part, and reduce the part by 181 grams on average, and the metal chips and cutting fluid are recycled. An LCI model is created for the machining operations, with electricity used as the energy input and the scrap metal and finished part used as the outputs. For electricity consumption, the U.S. east power grid LCI model is used.
Packaging
The finished parts are packaged for shipping in a heavy-duty corrugated cardboard box, which can hold 25 parts. The empty weight of the box is 670 g. A cradle-to-cradle corrugated box model is created using U.S.-specific LCI data (NCASI, 2014). The use phase of the LCI box model includes transportation to the point of use; however, it does not include energy or resource usage during the use phase. Therefore, the weight of the packaging material is considered along with the finished parts in the transportation model from the manufacturing plant to the dealers.
Use phase
The valve body does not use energy or resources; however, under severe conditions, the valve body can erode by 20% before it starts to dysfunction (Lax, 2015). Therefore, a significant amount of material loss is considered in the end-of-life calculations.
Life Cycle Impact Assessment (LCIA)
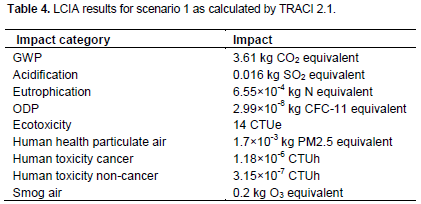
The LCIA is performed in two steps. In the first step, the LCIA is performed with the TRACI 2.1 LCIA method for the first scenario only. Using TRACI 2.1, the LCIA is performed on nine life-cycle impact categories as shown in Table 4. TRACI 2.1 is specifically developed for the conditions in the U.S. (Bare, 2012).
Because the goal of the study is to compare the aggregate environmental consequences of different manufacturing scenarios that occur on a global scale, globally measurable categories are selected for the second step of the LCIAs. Based on the recommendations of the ILCD (ECJRC 2011) and the availability of the GaBi methods library, the Global Warming Potential (GWP), Ozone Depletion Potential (ODP) and ecotoxicity categories are selected for comparisons at the midpoint level.
For the GWP, the IPCC’s Fifth Assessment Report (Pachauri and Meyer, 2014) is used as the reference for the 100-year midpoint indicators. Stratospheric ozone depletion is modeled by the EDIP2003 method using the ODP values published by the World Meteorological Organization (ECJRC, 2011). Finally, the USEtox method (Rosenbaum et al., 2008) is used to perform the midpoint ecotoxicity calculations, which are applied on a global scale.
RESULTS
The LCA of the first scenario using TRACI 2.1 is presented in Table 4. The GWP analysis reveals that manufacturing the valve body in the U.S. produces a 3.61 kg CO2 equivalent when the end-of-life recycling credit is included in the analysis. Among all of the main steps, casting and pig iron production have the highest impacts, with 2.15 and 0.961 kg CO2 equivalents, respectively. The underlying source of the overall GWP is the carbon dioxide emitted from fossil fuel burning, which produces 3.59 kg of actual carbon dioxide emissions. Most of the fossil fuel burning is associated with electricity generation. Electricity is the primary form of energy used for many processes, and it has a 2.15 kg CO2 equivalent GWP, of which 97.7% is generated from direct CO2 emissions.
TRACI 2.1 calculates the acidification potential based on the emissions into the air and water. Among the chemicals with high acidification potentials, the emissions of sulfur dioxide (SO2) constitute the highest share (64%) in the aggregate acidification potential at 0.0106 kg total emissions. Most of the SO2 emissions occur during the burning of sulfur-containing coal and fossil fuels at power plants and during metal melting processes. Fifty-three percent of all SO2 (0.0056 kg) emissions occur at power plants during electricity generation.
The eutrophication potential is calculated from emissions into the air and water. Sand casting accounts for the highest share of the eutrophication potential, and it is followed by pig iron production. Coal burning power plants and foundries account for 40% of the total eutrophication potential (0.0002441 kg N equivalent).
Ozone depletion is mainly caused by the release of halogenated compounds during the combustion of bituminous coal at foundries (36%) and the burning of wood and spent liquor in the pulp-making industry for the production of corrugated box material (59%) (NCASI, 2014).
Among the main sources of ecotoxicity, heavy metals released into the air and water presents the highest contributions. Copper, zinc and chromium emissions from the cupola melting process account for 99% of the total ecotoxicity potential.
'Human health particulate air' is measured according to the amount of emitted particulates and their sizes. In this study, the main source of particulate emissions is the burning of coal at power plants and foundries, which account for 66% of the total emissions.
Regarding the human toxicity (cancer and non-cancer) category, heavy metal emissions from the cupola process have the most substantial toxic effects. Chromium +VI (0.00011 kg) emissions into fresh water are responsible for 92% of the total human toxicity cancer potential, and zinc +II (0.00218 kg) emissions into air are responsible for 99% of the human non-cancer toxicity potential.
Nitrogen oxide and volatile organic compound (VOC) emissions are two of the main contributors of photochemical smog formation. In this study, 85.6% of the total smog formation resulted from the emission of nitrogen oxides. Transportation is responsible for 40% of the total smog formation, and coal burning at power plants and foundries is responsible for another 40%.
For the scenario comparisons, the life of the valve body is analyzed in three stages. The first stage is the upstream stage, which includes ore mining, pig iron production, casting, raw material transportation and energy generation. The second stage is the transportation of the finished cast part to the valve manufacturing plant in the U.S. The downstream stage is common for all of the scenarios and consists of machining, packaging, shipping and using the valve body in the U.S. The cradle-to-grave LCIA results are calculated with and without end-of-life recycling. The LCIA results for each stage and the full life cycles are presented in Table 5.
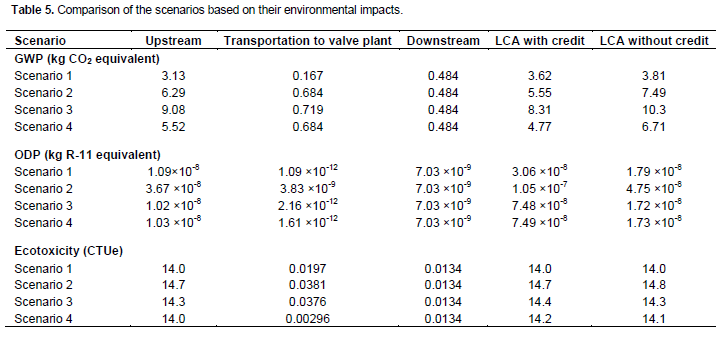
Table 5 reveals that manufacturing the cast valve in the U.S. has the lowest overall GWP, which was primarily because of the transportation stage, scrap usage percentage, and coal-based electricity generation percentage for each country. For scenario 2, when only the upstream activities are considered, the contribution of coal-powered plants to the GWP is 3.55 kg CO2 equivalent, whereas for scenario 3, the contribution is 5.21 kg CO2 equivalent. The contribution of transportation activities to the GWP is directly related to the type of vehicle and the distances traveled. Interestingly, transportation for scenario 2 and scenario 4 has an equivalent GWP, although in scenario 2, the total distance traveled is 20,539 km, whereas in scenario 4, the total distance is 2,030 km. The equivalent results are related to the 18,831-km container ship transportation in scenario 2 and the 2,030-km heavy-duty diesel truck transportation in scenario 4. The difference between the LCIA results with and without the end-of-life recycling credit is more significant when the net scrap surplus is higher. For scenario 1, the net scrap surplus is 0.128 kg, whereas for the other scenarios, the net scrap surplus is 1.27 kg.
For the ODPs, Table 5 indicates that scenario 2 has the highest ozone depletion potential in all stages that occur in China. In scenario 2, halon 1301 is the main contributor of ozone depletion at 77%, whereas in the other scenarios, halon 1301 appears in negligible amounts. In terms of the major ODP activities, Chinese pig iron production is the main contributor in the overall life cycle at 2.96×10⁻⁸ kg R-11 equivalent. For the other scenarios, methyl bromide emissions during bituminous coal burning and halogenated organic compound emissions during paper mill energy generation are the most significant sources of high ODPs.
The ecotoxicity levels show that heavy metal emissions during the cupola melting process are the major source of the ecotoxicity potential. More than 99% of the overall ecotoxicity potential originates from metal melting-related heavy metal emissions. Because the same cupola melting model is used for all four scenarios and the remaining processes have negligible ecotoxicity potential, the overall ecotoxicity levels do not reveal substantial differences.
Sensitivity analysis
All of the scenarios are based on assumptions related to the critical parameters, technologies and methods. Because each assumption produces a certain level of uncertainty, sensitivity analyses are performed on all four scenarios to test the effects of the assumptions contained in the models.
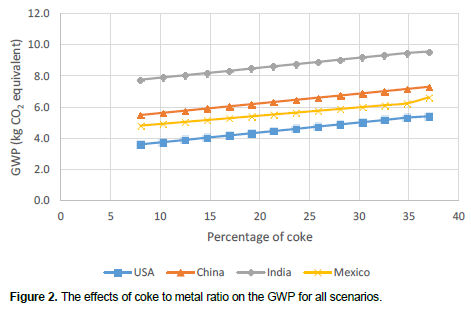
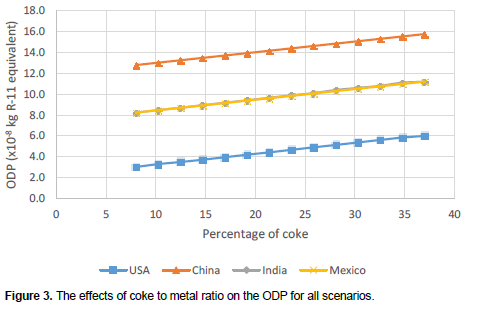
For the first sensitivity study, the coke to metal ratio of the cupola furnace charge is analyzed. In the original scenarios, the coke to metal ratio is assumed to be 1:12.5 (8%), which is based on the NREL-LCI cupola furnace model (NREL, 2012). This situation is possible with high-efficiency cupola furnaces with alternative melting systems, such as oxygas burners that burn natural gas. However, based on the reports of field studies conducted in China and India, the highest coke to metal ratios were 1:2.7 (37%) and 1:3.2 (31%), respectively (CAI, 2004; Pal et al., 2008). To simulate the effects of change in coke to metal ratio, all scenarios are re-evaluated for a range of values from 8 to 37% coke ratio. In all scenarios, a linear positive trend is observed for GWP and ODP (Figures 2 and 3). Because of low initial GWP and ODP values, largest percentage effects are observed on the U.S. based production. As the coke to metal ratio increases from 8 to 37%, GWP increases by 50% and ODP increases by 100% in the U.S. based scenario. Changing the coke to metal ratio has less than 1% effect on the ecotoxicity levels.
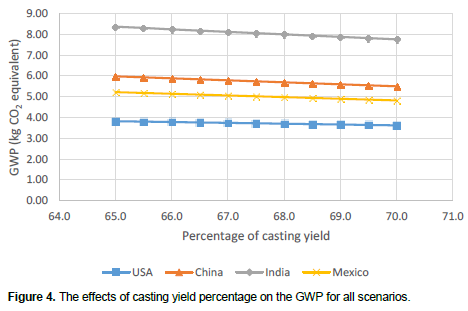
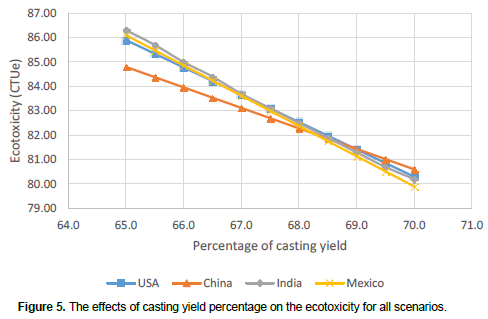
For the second sensitivity scenario, the percentage of casting yield is analyzed. The overall quality of the foundry (rejected parts), mold design (runners, gates, risers), and melting and pouring technologies are included as factors that determine the percentage of yield. Because the quality of castings and the level of casting technologies in India and China are lower than in the U.S. (U.S.ITC 2005), a range of values from 65 to 70% yield is analyzed for all scenarios. In all scenarios, a linear negative trend is observed for GWP and ecotoxicity (Figures 4 and 5). Highest percentage effects are observed on the China based production. As the yield ratio increases from 65 to 70%, GWP decreases by 9% and ecotoxicity decreases by 8% in the China based scenario.
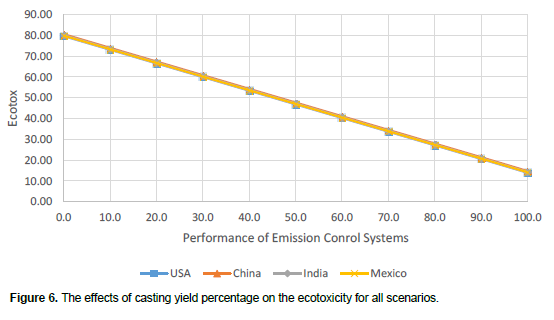
The third sensitivity study is modeled for the performance of emissions control systems. In the base scenarios, a baghouse dust filter is modeled to capture the particulate emissions into the air. According to the field studies of foundries in India and China, the application of an emissions control system is rare (CAI, 2004; ILFSEL, 2010). Performance is analyzed between 0 and 100% particulate capture efficiency. 0% represents the condition with no emission control system. A lack of filters does not significantly change the ODP and produces a slight increase in GWP, whereas the ecotoxicity levels are reduced by 80% (Figure 6). The ecotoxicity level is significantly affected by the amount of heavy metal emissions into the air. The release of toxic materials depends on the type and condition of the scrap metal charge; thus, the ecotoxicity levels can vary widely from foundry to foundry.
DISCUSSION
In this study, the environmental impacts of outsourcing a product are analyzed through comparisons of four supply chain scenarios. The study is centered around a specific iron manufacturing industry that represents the casting of iron products with cupola melting technology, and it includes all of the significant activities, from raw material extraction to the end-of-life stage. For comparison purposes, a reference scenario is developed according to actual information and a literature review. To model the scenarios for outsourcing, variable inputs are identified and modified according to regional values. Whenever available, all of the regional values are determined according to regional averages; otherwise, the best assumption is made to minimize the cost or time of the relevant activity.
Because electricity is used in every step of the manufacturing process, electricity production profiles are created based on the source of energy. Table 6 shows the significant differences between the potential environ-mental impacts of generating 1 KWh of electricity in each region of interest. High levels of GWP for India and China are related to high levels of coal consumption for electricity generation.
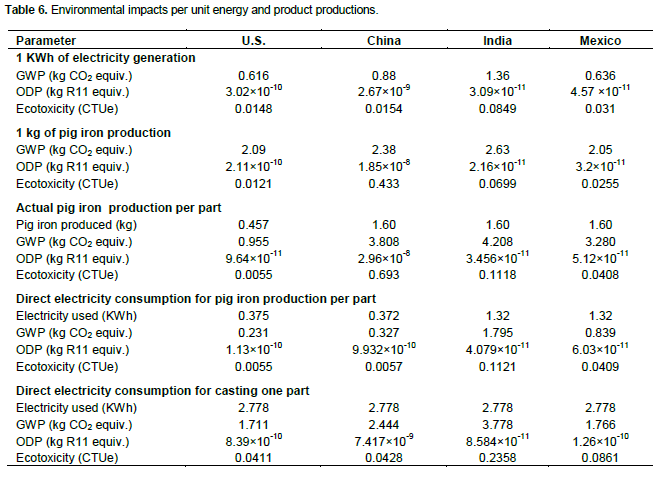
Pig iron is a key ingredient in iron casting processes. The production of pig iron and the amount of pig iron usage have significant environmental impacts because of the associated coke consumption. In this study, a Canadian steel mill is used as a reference model because of it is representative of the production characteristics of the U.S. In the reference model, 437 kg of coke is used to produce 1,000 kg of pig iron. In the literature, the coke consumption varies from 330 to 589 kg for 1,000 kg of pig iron production (Burchart-Korol, 2011a, b; Bieda b, 2012; Thuresson, 1996; Liang et al., 2015; Eggleston et al., 2006). Because the amount of coke used in the production of pig iron depends on the specific foundry, the reference model is used for all of the scenarios without modifying the coke consumption levels.
Table 6 presents the estimated environmental effects of electricity generation, pig iron production, casting processes, and corresponding electricity consumptions in the countries of interest. Table 6 reveals that environ-mental effects of electricity productions are significantly different for each country. However, environmental effects of “actual pig iron production per part” is substantially determined by the metallurgical coke burning and amount of pig iron used per part, and amount of pig iron used per part depends on the amount of scrap availability and usage. On the other hand, casting processes are heavily depending on the electrical energy, and as a result, country specific electricity production sources are more significant to explain the overall environmental effects of casting processes.
Transportation is one of the main activities that produces detrimental effects on the environment. To model the transportation activities, first, the foundry locations are identified for each scenario. When selecting the foundry locations, the casting output, exporting characteristics, and distance to ports or target locations are evaluated. In scenario 1, the total transportation activities (including raw materials, cast metal and finished product transportation) produce a 0.485 kg GWP CO2 equivalent, whereas in scenario 3, the same activities produce a 0.991 kg GWP CO2 equivalent.
Modeling a cupola furnace is the most challenging task for LCIA studies because of the number of associated variables and assumptions. The furnace design, fuel type, charging technologies, charge material quality and emission control technologies are among the foundry-specific factors that can impact the working characteristics of a cupola furnace and subsequently affect the environmental emission levels (CAI, 2004; ILFSEL, 2010).
Since the input parameters, assumptions and the results for each module or unit process that makes of the complete LCA are identified and presented in the study, it is believed that the study could be used by the LCA practitioners for commercial and research purposes by modifying relevant input parameters and assumptions with the use of an LCA simulation software.
CONCLUSIONS
Outsourcing the upstream manufacturing operations of a cast iron part to China, India or Mexico is an economically sustainable practice for U.S. manufacturing companies; however, it causes increases in the GWP, ODP and ecotoxicity levels. In the international trade of cast parts, amount of scrap usage, sources of electrical energy, furnace technology, and transportation distances, modes and technologies are found to be the main factors that control the magnitude of the negative environmental impacts.
In order to tackle today’s environmental problems, preliminary research and practice should focus on both preventive and remedial approaches at the same time. On-site carbon sequestration at current power plants, steel mills and foundries should be promoted. For the new generation of power plants, investment in green energy sources should be prioritized. For the iron industries in specific, recycling and scrap usage should be promoted by educating the public and the industry leaders.
Some factories in developing countries might use more modern equipment with better eco-efficiency than the developed countries. However, in this LCA study, country specific average data are used from the literature and LCA databases to present the current state of the industry.
NOMENCLATURE
GWP, Global Warming Potential; ILCD, The International Life Cycle Reference Life Cycle Data System; IPCC, Intergovernmental Panel on Climate Change; LCA, Life Cycle assessment; LCI, Life Cycle Inventory; LCIA, Life Cycle Impact Assessment; NREL, National Renewable Energy Laboratory; ODP, Ozone Depletion Potential.
CONFLICT OF INTERESTS
The author has not declared any conflict of interests.
REFERENCES
|
ASMI (Athena Sustainable Materials Institute) (2002). Cradle-to-gate life cycle inventory: Canadian and US steel production by mill type. Merrickville, Ontario. Accessed May 2016. |
|
|
Bare JC (2012). Tool for the reduction and assessment of chemical and other environmental Impacts (TRACI), Version 2.1 - User's manual. Environmental Protection Agency. |
|
|
BCSI (BCS, Incorporated) (2005). Advanced melting technologies: Energy saving concepts and opportunities for the metal casting industry. Columbia, MD: BSCI. View. Accessed May 2016. |
|
|
Bieda B (2012a). Life cycle inventory processes of the Mittal Steel Poland (MSP) S.A. in Krakow, Poland -blast furnace pig iron production - a case study. Int. J. Life Cycle Assess. 17:787–794. |
|
|
Bieda B (2012b). Life cycle inventory processes of the Mittal Steel Poland (MSP) S.A. in Krakow, Poland – basic oxygen furnace steel production. Int. J. Life Cycle Assess. 17:463-470. |
|
|
BIR (Bureau of International Recycling) (2015). World steel recycling in figures 2010 – 2014. View. Accessed May 2016. |
|
|
Burchart-Korol D (2011a). Significance of environmental LCA method in the iron and steel industry. Metalurgija 50(3):205-208. |
|
|
Burchart-Korol D (2011b). Evaluation of environmental impacts in iron-making based on life cycle assessment. Paper presented at 20th Anniversary International Conference on Metallurgy and Materials Conference 2011, Ostrava, Poland. |
|
|
CAI (Centric Austria International) (2004). Cleaner production in the foundry industry of the People's Republic of China. Accessed May 2016. |
|
|
Cargo Router (2016). www.cargorouter.com. Accessed May 2016. |
|
|
Chen B, Yang J, Ouyang Z (2011). Life cycle assessment of internal recycling options of steel slag in Chinese iron and steel industry. J. Iron Steel Res. 18(7):33-40. |
|
|
Dachs B, Ebersberger B, Kinkel S, Waser BR (2006). Offshoring of production - A European perspective. European Manufacturing Survey, Karlsruhe, Germany: Fraunhofer Institute Systems and Innovation Research ISI. Vol. 2. |
|
|
Dalquist S, Gutowski T (2004). Life cycle analysis of conventional manufacturing techniques: Sand casting. Paper presented at ASME International mechanical engineering congress and exposition, 2004, Anaheim, California. |
|
|
Das A, Biswas P, Lala S (n.d.) Diagnostic Study Report on Metal casting (Foundry) Cluster of Howrah, West Bengal Under Small Industries Cluster Development Programme (SICDP). View. Accessed August 2016. |
|
|
Davis JR (1996). Cast irons: ASM specialty handbook, Materials Park, OH: ASM International. |
|
|
Davis SJ, Caldeira K (2010). Consumption-based accounting of CO2 emissions. Proceedings of the National Academy of Sciences, U.S.A. 107:5687-5692. |
|
|
de Eicker MO, Hischier R, Hurni H, Zah R (2010a). Using non-local databases for the environmental assessment of industrial activities: The case of Latin America. Environ. Impact Assess. Rev. 30(3):145-157 |
|
|
de Eicker MO, Hischier R, Kulay LA, Lehmann M, Zah R, Hurni H (2010b). The applicability of non-local LCI data for LCA. Environ. Impact Assess. Rev. 30(3):192-199. |
|
|
DGAF (Direccion General de Autotransporte Federal) (2015). Estadistica básica 2014. [Basic statistics 2014]. View. Accessed May 2016. |
|
|
Duan H, Hu M, Zhang Y, Wang J, Jiang W, Huang Q, Li J (2015). Quantification of carbon emissions of the transport service sector in China by using streamlined life cycle assessment. J. Clean. Prod. 95:109-116. |
|
|
ECJRC (European Commission-Joint Research Centre) (2011). Institute for environment and sustainability: International reference life cycle data system (ILCD) Handbook- recommendations for life cycle impact assessment in the European context. Luxemburg: Publications Office of the European Union. View. Accessed May 2016. |
|
|
ECJRC (European Commission-Joint Research Centre) (2010). Institute for environment and sustainability: International reference life cycle data system (ILCD) Handbook- Framework and Requirements for Life Cycle Impact Assessment Models and Indicators. Luxemburg: Publications Office of the European Union. View. Accessed August 2016. |
|
|
Eggleston HS, Buendia L, Miwa K, Ngara T, Tanabe K (2006). IPCC Guidelines for national greenhouse gas inventories. National Greenhouse Gas Inventories Programme. Japan: Institute of Global Environment and Society. |
|
|
Eppich RE (2004). Energy use in selected metal casting facilities-2003. Prepared for U.S. Department of Energy |
|
|
Espinosa A (2014). Perfil de la Industria Siderúrgica en México 2004-2013. [Profile of the steel industry in Mexico 2004-2013]. Cámara Nacional de la Industria del Hierro y del Acero. View. Accessed May 2016. |
|
|
FG (The Folk Group) (2015). State of the metal casting industry by country. Doylestown, Pennsylvania: The Folk Group. View. Accessed May 2016. |
|
|
Flores LF (2013). Utiliza México 37% de chatarra en su producción nacional de acero. [Mexico produces 37% of its domestic steel production from scrap steel]. Reportacer. View. Accessed May 2016. |
|
|
FMSADECV (Ferrocarril Mexicano, S.A. DE C.V.) (2015). Informe anual 2014. [Annual report 2014]. View. Accessed May 2016. |
|
|
Frankel JA (2009). Environmental effects of international trade. HKS Faculty Research Working Paper Series RWP09-006, John F. Kennedy School of Government, Harvard University. |
|
|
GaBi (PE International AG; LBP-GaBi) (2011). GaBi Software System. University of Stuttgart. Leinfelden-Echterdingen, Germany. |
|
|
GIMR (Government of India Ministry of Railways) (2015). Annual statistical statements 2013-2014. View. Accessed May 2016. |
|
|
Google Maps (2016). View. Accessed May 2016. |
|
|
ICCT (International Council on Clean Transportation). 2014. Mexico heavy-duty vehicle emissions standards. View. Accessed May 2016. |
|
|
IEA (International Energy Agency) (2007). Tracking industrial energy efficiency and CO2 emissions. View. Accessed May 2016. |
|
|
IEA (International Energy Agency) (2015). India energy outlook. |
|
|
IKEET (Integrated Knowledge for our Environment, Environmental Technology CO., Ltd) (2012). Chinese life cycle database. View. Accessed May 2016. |
|
|
ILFSEL (IL & FS Ecosmart Limited) (2010). Technical EIA guidance manual for induction, electric arc and cupola furnaces. Hyderabad: ILFSEL. Accessed May 2016. |
|
|
ISO (International Organisation for Standardisation) (2006a). ISO14040: Environmental management – Life cycle assessment – Principles and framework. Geneve: International Organisation for Standardisation (ISO). |
|
|
ISO (International Organisation for Standardisation) (2006b). ISO 14044: Environmental management – Life cycle assessment – Requirements and guidelines. Geneve: International Organisation for Standardisation (ISO). |
|
|
Itten R, Frischknecht R, Stucki M (2012). Life cycle inventories of electricity mixes and grid. Uster, Switzerland: Treeze Ltd. www.lc-inventories.ch. Accessed May 2016. |
|
|
Joshi D, Modi Y, Ravi B (2011). Evaluating environmental impacts of sand cast products using life cycle assessment. Paper presented at Third International Conference on Research into Design Engineering, 10-12 January, Bangalore, India. |
|
|
JPSALC (JPS Associates Limited Consultants) (2011). Final report: Study on economics of trucking industry. New Delhi: Department of Road Transport and Highways, Ministry of Shipping, Road Transport and Highways, Government of India. View Accessed May 2016. |
|
|
Jun X, Bensman D (2010). The heart of the problem: Trucking in China's logistics sector. Labor and Employment Relations Association Annual Meeting. Atlanta, Georgia. |
|
|
KPLIL (KPL International Limited) (2003). Buyer's guide to sourcing castings from India. Cambridge: Woodhead Publishing Limited. |
|
|
Lax C (2015). Personal communication with C. Lax. Paris, Tennessee, U.S., 16 November 2015. |
|
|
Li C, Cui SP, Gong XZ, Meng XC, Sun BX, Liu Y (2014). Life cycle assessment of heavy-duty truck for highway transport in China. Mater. Sci. Forum 787:117-122. |
|
|
Liang KY Zhang JLi, Zhao C (2015). Carbon footprint analysis and reductive project evaluation of iron-making enterprise based on LCA. Presented at International Conference on Education, Management and Computing Technology, 2015, Tianjin, China. |
|
|
MC (Modern Casting) (2014). 48th Census of world casting production. View. Accessed May 2016. |
|
|
Montreal Protocol (1987). Montreal protocol on substances that deplete the stratospheric ozone layer. Washington, DC: U.S. Government Printing Office. |
|
|
NCASI (National Council for Air and Stream Improvement, Inc.) (2014). Life cycle assessment of U.S. average corrugated product. Research Triangle Park, North Carolina: NCASI. View. Accessed May 2016. |
|
|
NREL (National Renewable Energy Laboratory) (2012). U.S. life cycle inventory database. View. Accessed May, 2016. |
|
|
Pachauri RK, Meyer LA (2014). Climate change (2014). Synthesis report. Contribution of working groups I, II and III to the fifth assessment report of the Intergovernmental Panel on Climate Change (IPCC). Geneva, Switzerland: IPCC. |
|
|
Pal P, Sethi G, Nath A, Swami S (2008). Towards cleaner technologies in small and micro enterprises: a process-based case study of foundry industry in India. Journal of Cleaner Production 16: 1264-1274. |
|
|
Pan A (2011). China economy atlas. Auckland, New Zealand: Cloud New Zealand Limited. |
|
|
PESI (Pacific Environmental Services, Inc.) (1999). Iron and Steel Foundries manual emission testing cupola baghouse Waupaca foundry, Tell City, Indiana. Prepared for U.S. Environmental Protection Agency Research Triangle Park, NC. View. Accessed May 2016. |
|
|
PESI (Pacific Environmental Services, Inc.) (2003). Background report AP-42 section 12.10 iron foundries. Prepared for U.S. Environmental Protection Agency. Research Triangle Park, NC View. Accessed May 2016. |
|
|
Peters GP, Minx JC, Weber CL, Edenhofer O (2011). Growth in emission transfers via international trade from 1990 to 2008. Proceedings of the National Academy of Sciences, U.S.A. 108:8903-8908 |
|
|
Rosenbaum RK, Bachmann TM, Gold LS, Huijbregts MAJ, Jolliet O, Juraske R, Koehler A, Larsen HF, MacLeod M, Margni MD, McKone TE, Payet J, Schuhmacher M, van de Meent D, Hauschild MZ (2008). USEtox - The UNEP-SETAC toxicity model: Recommended characterisation factors for human toxicity and freshwater ecotoxicity in life cycle impact assessment. Int. J. Life Cycle Assess. 13:532-546. |
|
|
Sauer B (2016). Personal communication with B. Sauer, Senior chemical engineer and project manager, Franklin Associates, Praire Village, Kansas, 11 January 2016. |
|
|
SE (Secretaria de Energia) (2015). Programa de Desarrollo del sistema electrico nacional 2015-2029. [Development of national electric system 2015-2029]. View. Accessed May 2016. Sea-distances.org 2016. www.sea-distances.org. Accessed May 2016. |
|
|
SGMSE (Servicio Geológico Mexicano, Secretaría de Economía) (2014). Panorama Minero del Estado de Coahuila. Mining survey of the state of Coahuila. View. Accessed May 2016. |
|
|
Thuresson J (1996). Life cycle assessment of water pumps. Technical environmental planning report. Gothenburg, Sweden: Chalmers University of Technology. |
|
|
TLLC (Technicon LLC) (2000). Casting emission reduction program, baseline testing emission results production foundry. McClellan, California. View. Accessed May 2016. |
|
|
UNFCCC.COP (United Nations Framework Convention on Climate Change. Conference of the Parties) (2015). Adoption of the Paris Agreement-Proposal by the president. Geneva, Switzerland: United Nations Office at Geneva. |
|
|
U.S. DTMA (U.S. Department of Transportation Maritime Administration) (2013). Status of the U.S.-flag Great Lakes water transportation industry. Washington. View. Accessed May 2016. |
|
|
U.S.EIA (U.S. Energy Information Administration) (2015a). What is the electric power grid and what are some challenges it faces? View. Accessed May 2016. |
|
|
U.S.EIA (U.S. Energy Information Administration) (2015b). How much electricity is lost in transmission and distribution in the United States? View. Accessed May 2016. |
|
|
U.S.EIA (U.S. Energy Information Administration) (2015c). Electricity monthly update. View. Accessed May 2016. |
|
|
U.S.EIA (U.S. Energy Information Administration) (2015d). International energy data and analysis, China. View. Accessed May 2016. |
|
|
U.S.EIA (U.S. Energy Information Administration). 2015e. International energy data and analysis, India. View. Accessed May 2016. |
|
|
U.S.GS (U.S. Geological Survey) (2013). Minerals yearbook: Volume I. metals and minerals. View Accessed May 2016. |
|
|
U.S.ITC (U.S. International Trade Commission) (2005). Foundry products: Competitive conditions in the U.S. market. Washington, DC. |
|
|
WSA (World Steel Association) (2015). World steel in figures 2015. Brussels, Belgium: World Steel Association. |
|
|
Yuskavage RE, Strassner EH, Medeiros GW (2008). Outsourcing and imported inputs in the U.S. economy: Insights from integrated economic accounts. Paper presented at the 2008 World Congress on National Accounts and Economic Performance Measures for the Nations, 12-17 May, Arlington, VA. |
|
Copyright © 2024 Author(s) retain the copyright of this article.
This article is published under the terms of the Creative Commons Attribution License 4.0


