Full Length Research Paper

ABSTRACT
Cell phones and mobile devices have been an integral part of life over the past 30 years. In parallel with the intensity of use of mobile phones, the number of base stations has also increased. The increasing number of base stations has caused an intensity of electromagnetic pollution in the GSM band. The issue of electromagnetic pollution has become increasingly remarkable due to the claims that it can cause diseases and scientific studies carried out in this field. The number and variety of studies carried out in the last 30 years in this regard has also increased. Base stations are established with various features. While some kinds of base stations use radial antenna type, some of them use directional antennas. Depending on the region where it is established, the cell types it uses may also differ. Therefore, multiple measurements are required to analyse the impact of a base station. However, it is practically not possible to make an infinite number of measurements. Within the scope of this study, it is aimed to refine and clarify the electromagnetic pollution maps by using artificial intelligence methods. As a result of the studies carried out in this area, electromagnetic pollution maps have become much more detailed.
Key words: Electromagnetic pollution, GSM, base station.
INTRODUCTION
Electromagnetic fields have become one of the most important issues of today. The fact that the subject of electromagnetic fields keeps its current relevance is due to the increasing number of studies in this field. As a matter of fact, with each study in this area, another effect of electromagnetic fields comes to light. Although electromagnetic fields are a subject studied in a wide spectrum, most of the studies are concentrated in the 900 MHz and 1800-1900 MHz bands used by mobile phones (Rani et al., 2018; Gunes et al., 2021; Bektas et al., 2021). The focus of the studies in this band is primarily due to the high increase in the use of mobile phones in the last two decades. Because of the prevalence of mobile phone use, a considerable amount of research has turned to analysing the relationship between mobile phone antennas and the public health (Budd et al., 2020; Oliver et al., 2020; Miller et al., 2019). Although some definite results were obtained as a result of these studies, many studies whose results could not be confirmed were also reported. This means that electromagnetic fields cannot be said to be definitively harmful. However, precautionary (preventive) measures have been recommended by international organizations. In this regard, the recommendations of organizations such as IEEE, FCC, ICNIRP and CENELEC, which can be considered as influential organizations, can be examined in (Cleveland and Ulcek, 1999; Ahlbom et al., 1998; CENELEC, 1995; IEEE Standards Coordinating Committee, 1992). Considering the relevant reports of international organizations, European Council also published a recommendation, emphasizing the relevance of the issue (Recommendation Council, 1999).
There are basically two reasons for determining limit values for electromagnetic fields. The first reason is to ensure that the interference generated by the produced devices is controllable and to help the working devices to be designed in a way that does not harm each other's working performance. The other is the examination of the effect of electromagnetic field exposure created by actively used devices on the human body. Regarding this, the limit values determined by international organizations are presented in Table 1 (Cleveland and Ulcek, 1999; Ahlbom et al., 1998; IEEE Standards Coordinating Committee, 1992).

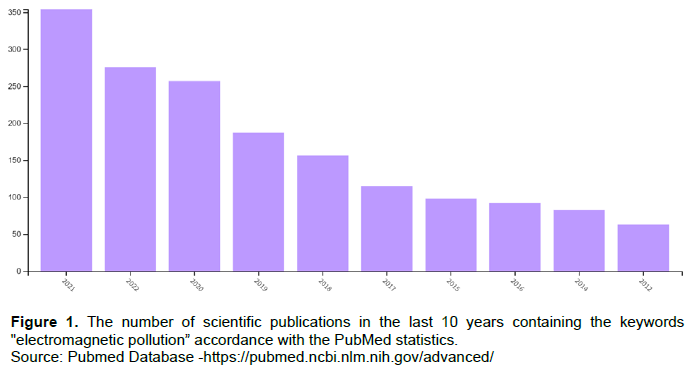
Electromagnetic pollution is a very current issue. As a matter of fact, a large number of researchers continue their studies on this subject. According to PubMed statistics, 1744 studies have been carried out with the keyword "electromagnetic pollution" in the last ten years. The number of studies on electromagnetic pollution is presented in Figure 1 by years. This means that an average of 14.5 studies is conducted on this subject each month.
The subject of electromagnetic pollution is not of particular interest to one group of people in the academic world. It is such a significant issue that it is being studied in many different parts of the world. As shown in Figure 2, electromagnetic pollution has been the subject of intense research in the last 10 years, especially in China, India, America and many European countries. This is not to claim that there are no other researchers studying this issue other than these countries. In fact, there are researchers working on this issue at all parts of the world.

Both the interest of scientists around the world and concerns about electromagnetic pollution are the main motivation for this study. For example, seeing a cell tower causes discomfort in people, and although there is no precise evidence of its correlation with cancer, its long-term effects are not yet completely recognized. Because of the reasons outlined, electromagnetic pollution studies were carried out in the region selected within the scope of this study.
Specifying why this study was conducted and which gap in the literature it aims to fill makes the rest of the article more understandable. Firstly, the study area can be considered as a slightly more specific one than the areas selected in the literature, since the selected study area is approximately 600,000 ha. The number of people living in this area is estimated to be around 1 to 1.5 million. This study differs from many studies in the literature in that the size of the study area is quite large and the density of people living in the measurement area is high.
Therefore, these characteristics of the study area are the main motivations for conducting this research. For example, Zhao et al. (2019) conducted a study on a university campus. In another study (Karada?, 2019), measurements of electromagnetic pollution were carried out in a hospital.
As can be understood from the examples, this study makes a remarkable contribution to the literature in terms of the size of the study area and the large number of affected people. Another major characteristic of this study is that it can be applied to many countries around the world. As shown in Figure 3, GSM900 and DCS1800 systems are widely preferred around the world. While GSM900 is preferred in about 190 countries, DCS1800 is actively used in about 140 countries. Therefore, the methods and results of the study contain important insights and implications for many researchers around the world.

This study is the first in the literature to use artificial intelligence to improve electromagnetic pollution maps, in addition to the measurement site and area.
METHODOLOGY
Pre processing
A well-defined experimental setup is as important as the experimental setting, free of all disturbances that might affect the experimental measurement. Otherwise, the results obtained cannot be claimed to be of acceptable accuracy. For this reason, an electromagnetic field meter (Spectrum Analyzer - Spectran HF 6080) with a directional antenna was used in all measurements Figure 4.
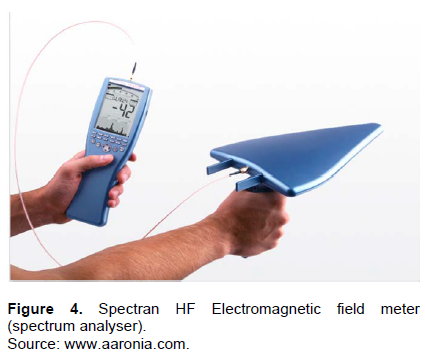
Spectran HF6080 brand measuring device can be locked to the desired frequency band and can make a measurement free from disturbing frequencies. Choosing the right device is not enough on its own. In addition, it is obvious that the measurements must be made in the same weather conditions in order to ensure their consistency. All measurements were made under 27±2°C temperature and 35±5% relative humidity conditions. Thus, the effect of air humidity and temperature on the propagation of the electromagnetic field is fixed.
All of the measurements were made in urban areas. Reflection and refraction losses may have affected the measurements. However, to overcome these issues, a directional antenna was used and measurements were made with an average of 6 min each. It is important that the measurement, in which direction is maximum, is taken for a period of 6 min. Since in a short-term measurement, maximum or minimum measurements can be taken. An example measurement is presented in Figure 5. As shown in Figure 5, the measurement took values between 820 and 850. However, it can be argued that the measurements taken at a time of heavy pedestrian and vehicle traffic are safe and close to reality. All measurements were carried out in accordance with ICNIRP guidelines (Ahlbom et al., 1998). ICNIRP specifies the general requirements for the competence to carry out tests and/or calibrations, including sampling.

Measurements
Within the scope of this study, an urban area was chosen as a study area. Human mobility is high in the selected region. In addition, the region determined as the study area is the region with the highest number of base stations according to the information received from local government officials. For this reason, the study area is considered to be the right area to evaluate the radiation level in terms of public health. In Figure 6, the measurement points in the region determined as the study area are seen.
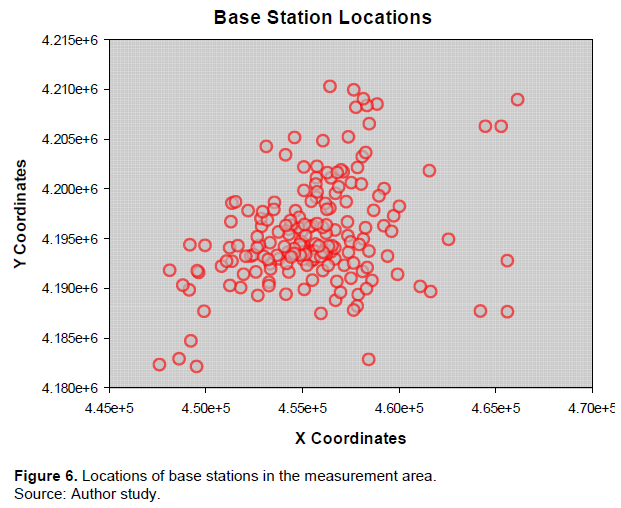
180 measurements points that are signed with latitude and longitude are shown in Figure 6. It is not practically possible to show all measurements point with the real-life photos. So, all measurement points are presented in Figure 6 with the red circles. All measurements have common points and were taken from far-field. This measuring system basically consists of 4 parts. These are data acquisition unit, RF cable, an antenna and GPS tracker. Although the antenna frequency range is very wide, measurements were made between 900 and 1800 MHz frequencies. RF cable connects the three-axis electric field antenna and data acquisition unit. The data acquisition unit is used to record the measurement samples as a data logger. Some of the measurements made for these base stations are presented in Table 2.

The sample selection process should be explained to make the rest of the study more understandable. The level of exposure in an environment can be simply measured using an electromagnetic field meter. However, several factors can affect the accuracy of the measurements. Except for instrument-related issues, measurement time and location is also important.
Furthermore, in measurements where more than one base station is directly affecting the measurement environment, the frequency-locked mode of the meter is activated. For this reason, measurements were made with the Spectran HF6080 which has a frequency-locked mode. All measurements were made at a height of 1.50 m above the ground and lasted 6 min. In the literature, averaging the 6-min measurement is a generally accepted practice. Both ICNIRP and IEEE have emphasised that a 6-min average is sufficient. In addition, all measurements were calculated for an antenna length of 1 metre and taken as far-field measurements, that is, no measurements were undertaken closer than 6.4 m for 900 MHz or 2.6 m for 1800 MHz.
All of the measurements, some of which are presented in Table 2, were taken in the gsm frequency bands. All of the measurements obtained were then mapped. In many studies in the literature, the information on how long the measurements are taken is not presented. Another important issue that is often overlooked by the researchers is that the measurements are not made with directional antennas. As a matter of fact, electromagnetic limit values can be determined for a single device in many countries. As a result of the measurement results obtained, the electromagnetic pollution map presented in Figure 6 was obtained.
In the electromagnetic pollution map in Figure 7, only the measurement results are processed. No interpolation method was added, and raw data were processed. For this reason, there are transitions between the contours. The electromagnetic pollution map presented in Figure 7 is both visually inappropriate and insufficient to explain the results; hence, the study has been deepened. The measurement results are developed with the help of interpolation method. The measurement was taken from the point in the middle of the two closest points to each other and the value in between was determined by the interpolation method. Then, the electromagnetic pollution map in Figure 7 is partially improved as shown in Figure 8.


Figure 8 shows a partially improved electromagnetic pollution map. This improvement was achieved by the interpolation method using additional measurements. The researcher has previous studies investigating the effect of electromagnetic fields (Sorgucu et al., 2011). In this study, the electromagnetic field effect was successfully estimated by the interpolation method. Based on this information, in this study, the interpolation method was used to clarify the electromagnetic pollution map. The electromagnetic pollution map improved by the Kriging interpolation method has much clearer contours. The formation of clearer contours is an important parameter for measurement reliability.
Although interpolation has been used for the electromagnetic pollution map and successful results have been obtained, it is possible to improve these results. With the use of artificial intelligence in electromagnetic pollution maps, the contours on the map will become much clearer.
In this study, there are 180 measurement points. In order to make the electromagnetic pollution map clearer, measurements need to be taken at different distances from the base stations. As a matter of fact, as the number of measurements increases, the contour areas on the electromagnetic pollution maps will become much clearer. For this reason, 40 measurement points of these 180 measurements which have at least two neighbour measurement points were randomly selected. 30 of the selected measurement points as an example were used for training and 10 for testing. Accurate test success was achieved with 98.86% success. Thanks to this point of view, the measurements for the remaining 120 base stations were estimated by artificial intelligence and the electromagnetic pollution map in Figure 8 was created.
It is practically impossible to present all of the actual measurements, interpolation estimates and artificial intelligence data. Since, there are too many points to count. Therefore, Table 3 is presented, which shows the success of the predictions made for artificial intelligence and interpolation. First column in the table shows the measurement number.
Second column shows the measurement made for this point. Third and fourth columns show the predictions made by interpolation and artificial intelligence. Fifth and sixth columns show the success of these prediction models.

As shown in Table 3, the prediction of artificial intelligence method is much better than interpolation. This situation is also seen on the maps. As a matter of fact, contours are almost non-existent in Figure 8. The error rate in the predictions made with artificial intelligence is 1.14%, while there is an average error of 4.68% in the predictions made with the interpolation method.
The electromagnetic pollution map in Figure 9 is much clearer than in Figure 8. To obtain this image, it is necessary to make dozens of measurements for each base station. However, by using artificial intelligence, measurement practice is ensured and time for measurement is saved, which is an advantage that will save time for detailed measurements.

RESULTS AND DISCUSSION
For the first time in the literature, an artificial intelligence technique is used to determine and clarify electromagnetic pollution map. Successfully result is obtained by using artificial intelligence. A low-cost and time-saving method for making electromagnetic pollution map which is especially efficient for a crowded urban area is proposed. Based on the results obtained from the study, the electromagnetic density levels of the sensitive places such as hospitals can be estimated in a short timeand without making new measurements. By installing artificial intelligence in a continuous system, the electromagnetic pollution level of a region can be predicted instantly with high accuracy.
It can be seen visually that the contours on the exposure maps are softened. However, the most important factor is that a person exposed to electromagnetic pollution is not only exposed to one source. Therefore, it was crucial to develop an intelligent system since it is practically impossible to measure at variable distances from each base station. Since, sometimes that means thousands of measurements. Accordingly, this study shows that the detection of electromagnetic pollution levels with artificial intelligence can be conducted in a clear and practical way. In this respect, the study differs from many studies in the relevant literature. Furthermore, it can serve as a pioneering research for future studies to be conducted in such densely populated areas.
The most original aspect of this study is the use of artificial intelligence to improve an electromagnetic pollution map. There are several reasons for making electromagnetic pollution maps much clearer. First of all, it is for controlling and planning the overall electromagnetic pollution level. For instance, it is stated in the study of García-Díaz et al. (2013) that pollution in mobile network can directly affect other communication systems. This situation raises two important issues: electromagnetic compatibility and total electromagnetic pollution. In this study, a separate research on electromagnetic compatibility was not conducted. The difference between Figures 7 and 9 shows how practical and important AI-enhanced maps are for the detection and planning of total electromagnetic pollution.
Besides, there are studies in the literature in which the effect of indoor obstacles on electromagnetic pollution is determined by artificial neural networks (Gomez-Perez et al., 2017). However, since these studies are carried out in an indoor environment and limited area, the number of sources causing electromagnetic pollution is quite limited. On the other hand, electromagnetic field values due to reflection and scattering contribute to the consistency of the measurements in the enclosed area. Therefore, it can be said that the study is parallel to the literature in terms of measurement and prediction approach.
As mentioned above, there is a relationship between electromagnetic pollution and many diseases. For this reason, people from many disciplines, especially biostatisticians and public health experts carry out studies investigating the relationship between electromagnetic pollution and diseases. In this regard, Bakcan (2022) stated that sustainable measurement strategies should be developed to manage health risks (Bakcan, 2022).
CONFLICT OF INTERESTS
The author has not declared any conflicts of interests.
REFERENCES
|
Ahlbom A, Bergqvist U, Bernhardt JH, Cesarini JP, Grandolfo M, Hietanen M, Matthes R (1998). Guidelines for limiting exposure to time-varying electric, magnetic, and electromagnetic fields (up to 300 GHz). Health Physics 74(4):494-521. |
|
|
Bakcan MR (2022). Measurement and Prediction of Electromagnetic Radiation Exposure Level in a University Campus. Tehnicki Vjesnik 29(2):449-455. |
|
|
Bektas H, Dasdag S, Bektas MS (2021). Evaluation of 900 and 1800 Mhz Radiofrequency Radiation Emitted from Mobile Phones on Pregnant Women. Journal of International Dental and Medical Research 14(4):1675-1683. |
|
|
Budd J, Miller BS, Manning EM, Lampos V, Zhuang M, Edelstein M, McKendry RA (2020). Digital technologies in the public-health response to COVID-19. Nature Medicine 26(8):1183-1192. |
|
|
CENELEC (1995). Exposition humaine aux champs électromagnétiques Hautes-Fréquences (10 KHz à 300GHz) Rep. ENV 50 166-2. |
|
|
Cleveland RF, Ulcek JL (1999). Questions and Answers about Biological Effects and Potential Hazards of Radiofrequency Electromagnetic Fields (Fourth Edition). Standards Development Branch, Allocations and Standards Division, Office of Engineering and Technology, Federal Communications Commission. |
|
|
Electronic Communications Committee (ECC). The European Table Of Frequency Allocations and Applications In The Frequency Range 8.3 kHz to 3000 GHz (ECA Table). Approved October 2017. |
|
|
García-Díaz P, Salcedo-Sanz S, Portilla-Figueras JA, Jiménez-Fernández S (2013). Mobile network deployment under electromagnetic pollution control criterion: An evolutionary algorithm approach. Expert Systems with Applications 40(1):365-376. |
|
|
Gomez-Perez P, García MC, Cuiñas I, Caldeirinha RFS (2017). Modelling and inference of the attenuation induced by vegetation barriers in 2G/3G/4G cellular bands using artificial neural networks. Measurement 98:262-275. |
|
|
Gunes M, Ates K, Yalcin B, Akkurt S, Ozen S, Kaya B (2021). An Evaluation of the Genotoxic Effects of Electromagnetic Radiation at 900 MHz, 1800 MHz, and 2100 MHz Frequencies with a SMART Assay in Drosophila melanogaster. Electromagnetic Biology and Medicine 40(2):254-263. |
|
|
IEEE Standards Coordinating Committee (1992). IEEE standard for safety levels with respect to human exposure to radio frequency electromagnetic fields, 3kHz to 300GHz. IEEE C95. 1-1991. |
|
|
Karadag T (2019). Bir Üniversite Hastanesi Acil Servisinin Elektromanyetik Kirlilik Seviyelerinin Ölçülmesi ve De?erlendirilmesi. Computer Science 4(2):128-133. |
|
|
Miller AB, Sears ME, Morgan LL, Davis DL, Hardell L, Oremus M, Soskolne CL (2019). Risks to health and well-being from radio- frequency radiation emitted by cell phones and other wireless devices. Frontiers in Public Health 7:1-10. |
|
|
Oliver N, Lepri B, Sterly H, Lambiotte R, Deletaille S, De Nadai M, Vinck P (2020). Mobile phone data for informing public health actions across the COVID-19 pandemic life cycle. Science Advances 6(23):1-6. Baba VSSNS, Gundala S (2018). Analysis of SAR in Human Blood, Bones and Muscles due to Mobile Waves at 900MHz, 1800MHz and 2400MHz. International Journal of Applied Engineering Research 13(5):2125-2129. |
|
|
Recommendation Council (1999). Limitation of exposure of the general public to electromagnetic fields (0 hz to 300 ghz). Official Journal of the European Communities, p. 199. |
|
|
Sorgucu U, Develi I, Durduran SS (2011). The Use of Different Interpolation Methods in Estimating Electromagnetic Power Density. Sigma 29:148-155. |
|
|
Zhao X, Ji Z, Chu W, Zhao Y, Yan L, Zhou H, Huang K (2019). Measurement and analysis of electromagnetic environment characteristics on Wangjiang Campus of Sichuan University. Radio Science 54(7):633-645. |
|
Copyright © 2024 Author(s) retain the copyright of this article.
This article is published under the terms of the Creative Commons Attribution License 4.0


