ABSTRACT
A grain yield trial was conducted in three locations in Southern Ghana. The objective of the trial was to determine the effects of genotype by environment interaction on 90 early maturing hybrid maize. The trial was conducted in Fumesua, Ejura and Kpeve; representing the forest, forest-Savanna transition and coastal-Savanna transition zones respectively. The analysis of variance for grain yield demonstrated that genotypic and environmental effects were highly significant (P<0.001) while their interaction was significant (P<0.005). The genotypes contributed 34.4% of total sum of square percentage while environment contributed 31.1% of the total sum of square of the variance. The genotype main effect plus genotype × environment interaction biplot explained 85.2% of total variation of the sum of squares for grain yield. P40, P16, P78, P53, P41 P9 and P3 were identified by GGE biplot analysis as high yielding and stable genotypes while P20, P80, P22, and P15 were low yielding but very stable genotypes. On the other hand, P59, P41, P16, P26 and P50 were high yielding but not stable and was recommended that genotypes with broad range adaptability can be tested on farmers field for possible release.
Key words: Tropical maize early maturing (TZEI), Genotype × environmental interaction (GGE) biplot, hybrid, Fumesua, Ejura, Kpeve trial, environment, treatment.
Maize (Zea mays L.) is the dominant staple crop grown by a vast majority of rural households in most parts of Africa, covering a total of nearly 35 million hectare that account for 20% of the total global maize area (FAOSTAT, 2013). It ranged as the third most important and highest industrial valued cereal in the world next to wheat and rice and is an important staple crop in most under privileged countries (Badu-Apraku et al., 2010; Malik et al., 2005; Khalil et al., 2011). Maize can be grown over a range of agro climatic zones and its fitness to varied environments is higher than any other crop (Golam et al., 2011). The crop can be grown from latitude 58°N to 40°S, from below sea level to altitude higher than 3000 m and in areas with rainfall of about 250 to 5000 mm per annum and with growing season ranging from 3 months to about 5 months (Dowswell et al., 1996, Golam et al., 2011).
Its high yield potential, wide adaptability, relative ease of cultivation, processing, storage and transportation of maize has increased its potentials for combating food security challenges posed by population increase in West and Central Africa (WCA) (Badu-Apraku et al., 2010). Hybrid maize varieties have caused a significant impact on crop yields for farmers on every continent since the 1930s (Bello et al., 2012). In most developing countries, maize farmers often prefer early maturing hybrid varieties because they perform better across different environments than their parents.
Multi-environment yield trial is essential in estimating genotype by environment interaction and identification of superior genotypes. Genotype by environment interaction effect on maize grain yield is usually significant due to large variation in soil and weather conditions at growing sites.
The relative performance of genotype(s) across environments has raised important and challenging issues among plant breeders, geneticists and agronomists (Babic et al., 2008). The presence of genotype by environment interaction should be of great concern to maize breeders as large interaction could reduce yield and even make the selection of superior cultivars difficult (Rasul et al., 2005). Kang et al. (1991) point out that selection based on yield only may not always be adequate when genotype x environment interaction is significant. He additionally proposed the use of a rank-sum method as an alternative when testing is done in diverse environments.
Importance of early maturing maize
Availability of early maturing maize will significantly contribute to rapid increase and spread of maize in WCA, especially where the short duration of rainfall had long caused stress to maize production (Boakyewaa, 2012). Chavez et al. (2005) worked on single cross hybrids and reported that single cross hybrids are more productive than double crosses and open pollinated varieties (OPVs). According to Badu-Apraku et al. (1995), annual maize yield loss from drought stress in developing countries is estimated at 15% of total production.
In some countries in WCA, most farmers prefer to grow early maturing maize hybrids because they do well during off-season planting, and even provide an early harvest, thereby helping to minimize the hunger gap before the main harvest of full season crops especially where there are two growing seasons (Pswarayi and Vivek, 2008). Early maturing maize also enables multiple planting dates over an extended period of time as a measure to cope with the uncertainty of the rainfall patterns. They also provide flexibility with planting dates which enable farmers to plant their crops later in the planting season and are ideal for intercropping because they provide less competition for moisture, light, and nutrients than late maturing varieties (CIMMYT, 2000).
Ninety early maturing maize single cross hybrids derived from crosses between 41 inbred lines were obtained from International Institute of Tropical Agriculture (IITA) (Table 1). The hybrids were evaluated at three locations in southern Ghana Fumesua, Ejura and Kpeve. Each of the locations experiences a bimodal rainfall pattern. Fumesua lies within the forest ecology while Ejura is a Forest-Savanna transition zone and lies between the semi-deciduous Forest and Guinea Savanna zones. The location experiences both forest and savanna climatic conditions. Kpeve is a Coastal-Savanna transition zone and is influenced by the south-west monsoons from the South Atlantic Ocean and dry harmattan winds from the Sahara Desert (Table 2).

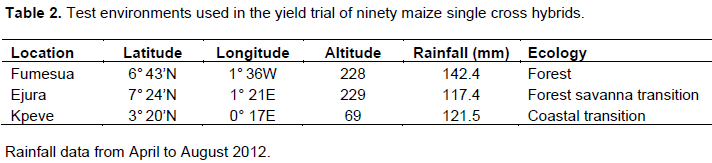
The major season stretches from April through July and the minor season from August to November (Table 2). The experiment was planted in a randomized complete block design (RCBD) with two replications at each location. Each hybrid was planted in a single row plot measuring 5 m in length with an inter-row spacing of 0.75 m and within row spacing of 0.45 m. Three seeds were planted per hill and thinned to two seedlings to obtain a target plant population density of approximately 60,000 plants ha-1. The experiment was protected by two-guard rows of Dorke SR, to control border effect. Pre-emergence and post emergence chemical weed control was done with an application of Gramoxone and Atrazine respectively. Hand weeding was also done when necessary to control weeds during the growing period. NPK 15-15-15 fertilizer was applied at the rate of 30 kg N ha-1 and 60 kg P2O5 ha-1 as basal fertilizer at two weeks after planting and top-dressed with additional N at 60 kg N ha-1 at four weeks after planting.
Data collection and analysis
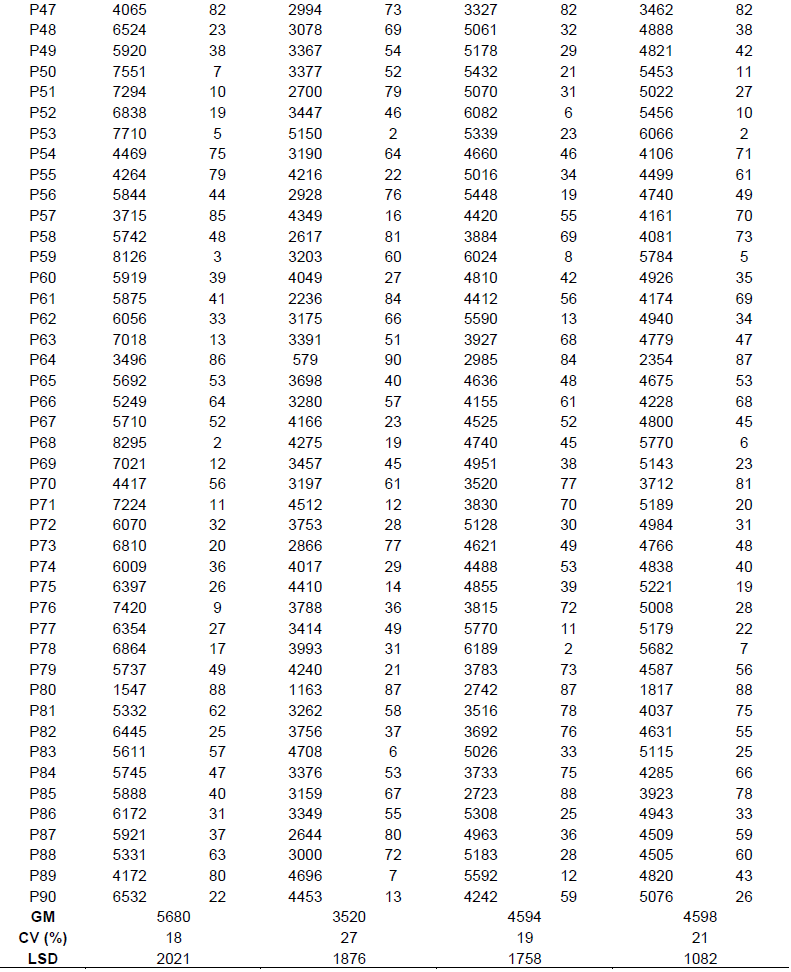
Data were collected on other agronomic parameters but only data from grain yield were used in data analysis. Grain yield (kg ha-1) was calculated using the following formula:
Grain yield (kg ha-1) = Harvested ear weight (kg plot-1) × (100-MC) × 0.8 × 10,000/ (100-15) × 3.75 m2 (at 15% moisture) = Total grain yield/h-1
The analysis of variance (Steel and Torrie, 1980) for grain yield for each location and across locations was conducted using Statistical Analysis System version 9.2 (SAS, 2003). Least significance difference test (P≤0.05) was used to determine the level of significance among the treatment means and environments.
GGE biplot analysis
The GGE biplot software (Yan, 2001) is a polygon that is used to enable visualization of three important aspects: (i) the genotype x environment relations as represented by the which-won-where pattern; (ii) the interrelationships among test environments, which enabled the identification of better environments for evaluation of maize and of least performing environments that can be dismissed and (iii) the interrelationships among genotypes, which facilitated comparison among genotypes and genotype ranking on both mean yield and stability (Yan and Hunt, 2001) and is recovered through this formula
Yij −μ − βj = λ1 ξ i1ηj1 +λ2 ξi2 ηj2 +εij (1)
where Yij is the measured mean of genotype i in environment j, μ is the grand mean, βj is the main effect of environment j, μ + βj being the mean yield across all genotypes in environment j, λ1 and λ2 are the singular values (SV) for the first and second principal component (PC1 and PC2), respectively, ξ1i and ξ2i are eigenvectors of genotype i for PC1 and PC2, respectively; ηj1 and ηj2 are eigenvectors of environment j for PC l and PC2, respectively, εij is the residual associated with genotype i in environment (Yan, 2002).
Result from the evaluation conducted for individual location showed that there were significant differences among genotypes for grain yield (Table 3) and between locations (Table 4). At Fumesua, grain yield was generally moderate for all entries and ranged from 1366 to 6278 kg ha-1. Low grain yields were observed at Ejura with yields ranging from 579 to 5269 kg ha-1. There was an invasion of spittle bugs in Ejura which seriously affected yields. Moreover, there was cessation of rainfall at flowering which resulted in less soil moisture during grain filling period. This resulted in poor synchronization, subsequently affecting seed set. A similar observation was made by Denmead and Shaw (1960). They further mentioned that drought stress reduces yields by 21% when it occurs during grain filling and by 50% flowering. The result indicates that the order of response of genotypes at the three locations varied (Table 5).
In their work, Dehghani et al. (2006) reported that cropping season, rainfall and temperature had significant effects on the yield of barley and also contributed to large interactions.
GGE biplot analysis of grain yield and stability
The biplot analysis was based on environment-focused singular value partitioning (SVP = 2) and genotype-focused singular value partitioning (SVP = 1). This allowed visualization of the relationships among genotypes and among environments. The principal component axis (PCA1) explained 69.1% of total variation; while PCA2 explained 16.1%.
The “which-won-where” patterns
From the polygon view of the GGE biplot (Figure 1), the vertex genotype can be seen as the one that give the highest yield for each of the environment in which they lie. P40 was the highest yielding hybrid at Fumesua (best hybrid across environments) followed by P78 (7th best hybrid). Meanwhile, P15, P20, P85, and P80 performed very poorly at Fumesua. P26 (14th best hybrid) was the highest yielding hybrid at Ejura followed by P53 (2nd best hybrid across environments) and P64, P20, P15, P80 and P14 were the poorest performing hybrid at Ejura. Meanwhile, P59 was the winning hybrid at Kpeve (5th best across environment) followed by P41, P16 and P68. No environment fell into the sector where P20, P15, P80, P64, And P23 were the vertex hybrid.
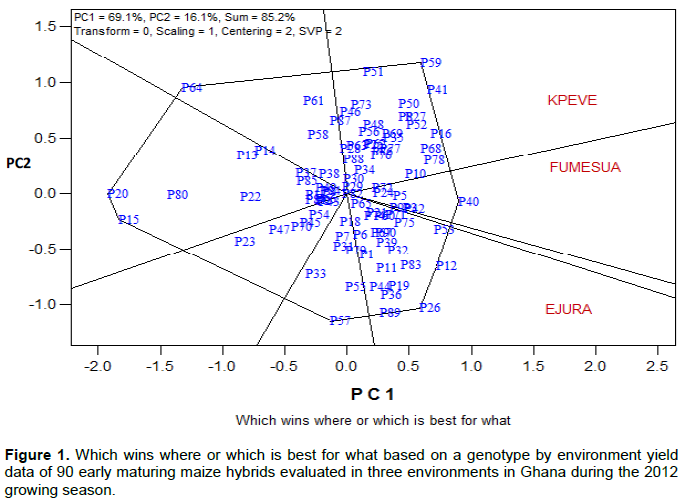
From the view of the biplot (Which-Won-Where), P40 was the winning hybrid at Fumesua; P26 was the winning hybrid at Ejura, while P59 won at Kpeve because they were all close to the vertices. However, from the SAS analysis, it was observed that P41 obtained the highest yield at Kpeve. Similar observation by Yan (2002) reported that the pattern displayed by the biplot may be more vigorous than the individual data points for genotypes, because it places more weight on stability rather than rank. Furthermore, Yan and Tinker (2006) reported that the best way to determine the best genotype in a test environment is to do scaling with environment standard deviation such that all environ-ments are given the same weight. Based on the genotype-focused scaling (Figure 1), P59 was the most desirable genotype followed by P41 even though P41 had the highest mean yield.
Discriminative ability and representativeness of the environments
An ideal environment should both be highly differentiating of the genotypes and representative of the target environment (Tonk et al., 2011; Dehghani et al., 2006).
According to Tonk et al. (2011), the ideal environment represented by the small circle with an arrow pointing to it (Figure 2) is the most discriminating of genotypes and representative of the other test environments. The lines connecting the biplot origin with the markers for the environments are called environment vectors (Brar et al., 2010). Based on the cosine of angles of environment vectors, the three locations for grain yield were grouped into three. The presence of wide obtuse angles among the locations indicates strong cross-over genotype by environment interactions (Yan and Tinker, 2006). The distance between two environments measures their dissimilarity in discriminating the genotypes. Thus, the three locations fell into three apparent groups, Fumesua, Ejura and Kpeve. The concentric circles on the biplot help to visualize the length of the environment vectors, which is proportional to the standard deviation within the respective environments and its discriminating ability of the environments (Kroonenberg, 1995). A test environment with a smaller cosine of angle with Average Environment Coordinate (AEC) was more representative than other test environments

Hybrid performance and stability across environment
GGE biplot was used to analyze the mean performance and stability of genotypes for grain yield because of the significant interaction for grain yield alone. The performances of the hybrids and stability are observed by an average environment coordination method (Yan, 2002). This is further demonstrated by means of average PC1 and PC2 scores for all environments, and is indicated by a small circle. A line is then drawn to pass through this average environment and the biplot origin. This line is known as the average environment axis and serves as the abscissa of the average environment coordination. The biplot displayed the pattern of variability of genotypes, environment and their interactions and stability. P40, P10, P 42, P12, and P53 had high potential yield respectively and were near to ideal genotypes (Figure 3). Therefore, these were considered as stable and high yielding genotypes. On the other hand, P59, P41, P16, P26, P68, P52 and P50 were high yielding but not stable. This condition poses a serious challenge to plant breeders because the highest yielding genotype may not be preferred by farmers due to its instability across range of environments. According to Tonk et al. (2011), an ideal genotype grown in test environments should possess high mean performance and stability. Such an ideal genotype having high yield with less interaction and the greatest vector length from origin of biplot to the genotype pointers can be recommended for release. P40, P78 P12 P35 are specifically adapted to Fumesua; P26, P53, P12 and P40 are adapted to Ejura; while P41, P68, P59, P16 and P53 are specifically adapted to Kpeve.

From the study conducted, G × E was found to be highly significant (P<0.001) for both genotypes and environment, and significant (P<0.05) for their interaction. The combined analysis of variance revealed that genotypes contributed 34.4% of the total percentage sum of square variation in grain yield while environment contributed 31.1% of the variation. The highly significant effects revealed that environmental conditions had major effects in selecting hybrids for high grain yield and wide adaptation. From the results, 20 hybrids were identified to be high yielding. Therefore, the high yielding and stable hybrids can be tested on farm and the best could be released to farmers.
The authors have not declared any conflict of interests.
REFERENCES
|
Babic M, Anelkovic V, Babic V (2008). Genotype by environment interaction in maize breeding. Genetika 40(3):303-312.
Crossref
|
|
|
|
Badu-Apraku B, Fajemisin JM, Diallo AO (1995). The performance of early and extra-early varieties across environments in West and Central Africa. In Contributing to Food Self-sufficiency: Maize Research and Development in West and Central Africa. Proceedings of a Regional Maize Workshop, 29 May–2 June 1995 (Eds B. Badu-Apraku, M. O. Akoroda, M. Ouedraogo & F. M. Quin), pp. 149-159. Cotonou, Benin Republic: IITA.
|
|
|
|
|
Badu-Apraku B, Menkir A, Ajala SO, Akinwale RO, Oyekunle M, Obeng-Antwi K (2010). Performance of tropical early maturing maize cultivars in multiple Stress environments. Can. J. Plant Sci. 90:831-852.
Crossref
|
|
|
|
|
Bello OB, Abdulmaliq SY, Ige SA, Mahamood J, Oluleye F, Azeez MA, Afolabi MS (2012). Evaluation of early and late/intermediate maize varieties for grain yield potential and adaptation to a southern Guinea savanna agro-ecology of Nigeria. Scholarly J. Agric. Sci. 2(3):42-51.
|
|
|
|
|
Boakyewaa AG (2012). Genotype by Environment interaction and grain yield stability of extra-early maize (Zea mays l.) hybrids evaluated at three locations in Ghana. MSc. Thesis Pdf, Department of Crop and Soil Science, Kwame Nkrumah University of Science and Technology, Kumasi, Ghana.
|
|
|
|
|
Brar KS, Pritpal S, Mittal VP, Paramjit S, Jakhar ML, Yadav Y, Sharma MM, Shekhawat US, Kumar C (2010). GGE biplot analysis for visualization of mean performance and stability for seed yield in taramira at diverse locations in India. J. Oilseed Brassica 1(2):66-74.
|
|
|
|
|
Chavez A, de Souza CL, de Souza AP (2005). Use of partial inbred S3 lines for the development of maize single cross. Maydica, pp. 113-121.
|
|
|
|
|
CIMMYT (2000). CIMMYT-Zimbabwe: 2000 Research highlights. Harare, Zimbabwe.
|
|
|
|
|
Dehghani H, Ebadi HA, Yousefi A (2006). Biplot analysis of genotype by environment interaction for barley yield in Iran. Agron. J. 98:388-393.
Crossref
|
|
|
|
|
Denmead OT, Shaw RH (1960). The effect of soil moisture stress at different stages of growth on the development and yield of corn. Agron. J. 52:2728.
Crossref
|
|
|
|
|
Dowswell CR, Palliwal RL, Ronald PC (1996). Maize in the third world. West view Press, Inc. CIMMYT 2000. CIMMYT-Zimbabwe: 2000 Research highlights. Harare, Zimbabwe, pp. 1-19.
|
|
|
|
|
FAOSTAT (2013). Statistical database of the Food and Agriculture of the United Nations. FAO, Rome.
|
|
|
|
|
Golam F, Farhana NN, Zain M F, Majid NZ, Rahman MM, Kadir MA (2011). Grain yield and associated traits of maize (Zea mays L.) genotypes in Malaysian tropical environment. Afr. J. Agric. Res. 6(28):6147-6154.
|
|
|
|
|
Kang MS, Gorman DP, Pham HN (1991) Application of a stability statistic to international maize yield trials. Theor. Appl. Genet. 81:162-165.
Crossref
|
|
|
|
|
Khalil AI, Ur- Rahman H, Ur-Rehman N, Arif M, Khalil IH, Iqbal M, Hidayatullah, Afridi K, Sajjad M, Ishaq M (2011). Evaluation of maize hybrids for grain yield stability in North-West of Pakistan. Sarhad J. Agric. 27(2):213-218.
|
|
|
|
|
Kroonenberg PM (1995). Introduction to biplots for G X E tables. Department of Mathematics, research Report 51, University of Queensland, Australia.
|
|
|
|
|
Malik H, Malik SI, Hussain M, Ur-Rehman S, Habib C, Javid I (2005). Genetic correlation among various Quantitive characters in maize (Zea mays l) hybrids. J. Agric. Soc. Sci. 1(3):262-265.
|
|
|
|
|
Pswarayi A, Vivek BS (2008). Combining ability among CIMMYT's early maturing maize germplasm under stress and non-stress conditions and identification of testers. Euphytica 162(3):353-362.
Crossref
|
|
|
|
|
Rasul S, Khanm IM, Javed MM, ul-Haq I (2005). Stability and adaptability of maize genotypes in Pakistan. J. Appl. Sci. Res. 1(3):307-312.
|
|
|
|
|
SAS Institute Inc (2003). SAS proprietary software, SAS Institute, Inc, Cary, NC, Canada.
|
|
|
|
|
Steel RGD, Torrie JH (1980). Principles and procedures of Statistics, A biometrical approach, 2nd Ed McGraw-hill book company, pp 195-220.
|
|
|
|
|
Tonk FA, Ilker E, Tosun M (2011). Evaluation of genotype x environment interactions in maize hybrids using GGE biplot analysis. Crop Breed. Appl. Biotechnol. 11:1-9.
Crossref
|
|
|
|
|
Yan W (2001). GGE biplot a Windows application for graphical analysis of multi-environment trial data and other types of two way data. Agron. J. 93:1111-1118.
Crossref
|
|
|
|
|
Yan W (2002). Singular-value partitioning in biplot analysis of multi-environment trial data. Agron. J. 94:990-996
Crossref
|
|
|
|
|
Yan W, Hunt LA (2001). Interpretation of genotype by environment interaction for winter wheat yield in Ontario. Crop Sci. 41:19-25.
Crossref
|
|
|
|
|
Yan W, Tinker NA (2006). Biplot analysis of multi-environment trial data: Principles and application. Can J. Plant Sci. 86:623-645.
Crossref
|
|