Sorghum (Sorghum bicolor (L.) Moench) grain color ranges from white, yellow, red, to brown, depending on the pericarp (external layer composed of ≤6 wt% of kernel) color and thickness (8-160 μm), endosperm color, mesocarp thickness and the presence of pigmented testa (Pedersen and Toy, 2001). Regardless of grain color, sorghum contains phenolic acids in pericarp, testa, aleurone layer and endosperm: hydroxybenzoic (e.g., gallic, vanillic and protocatechuic) and hydroxycinnamic (e.g., caffeic and coumaric) acids (Dykes and Rooney, 2006). While most sorghum varieties also contain flavonoids, only varieties having a pigmented testa contain condensed tannins (proanthocyanidins) (Dykes and Rooney, 2006). Sorghum seed extracts have been intensively characterized for toxicity (Scalbert, 1991), antioxidant property (Hagerman et al., 1998), the ability to precipitate protein (Ali et al., 2009), mold/bird resistance (Wu et al., 2012), and their effects on the fuel ethanol production (Yan et al., 2011). Sorghum tannins are a strong antioxidant even when complexed with proteins (Riedl and Hagerman, 2001). Although pigmented testa adversely affects the nutritional quality of grain, it improves resistance to mold, bird and preharvest seed germination on farm (Earp et al., 2004a).
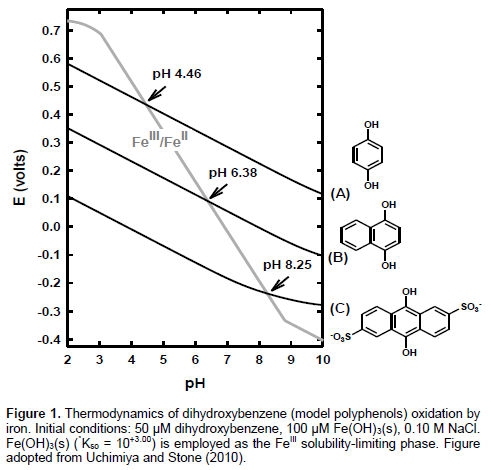
The unique chemical properties underlying the above-described functions of sorghum seed pigments (phenolic acids, flavonoids, and condensed tannins) are the reversible electron-transfer (Hagerman et al., 1998) and metal complexation (Martell et al., 2004). Antioxidant activity of polyphenols and flavonoids, e.g., by quenching Fenton reaction, originates from the redox reactions as well as the complexation of Fe and Cu (Mira et al., 2002). As illustrated in Figure 1 adopted from Uchimiya and Stone (2010), two-electron reduction potential (E in volts) of polyphenols progressively decrease with the number of aromatic rings. Oxidation by FeIII is thermodynamically favorable when E of a given polyphenol is lower than E of iron. This corresponds to acidic pH range in Figure 1 where metal complexation by polyphenol is minimal (Martell et al., 2004). As illustrated in detail in the present study, different electron-donating capacities (E in Figure 1) of seeds are reflected in the amount of FeIII reduced at a given pH. Our subsequent papers in this series will utilized approaches developed in this study to examine the relationships between the chemical properties of sorghum pericarp and phenotypes, with a particular emphasis on the on-farm bird resistance.
The degree of aromaticity and the number of conjugated π electrons are observable in the characteristic peaks of fluorescence excitation-emission (EEM) spectro-photometry, a sensitive, rapid, and non-destructive tool widely employed on dairy and other food products (Andersen and Mortensen, 2008). A shift towards longer excitation and emission wavelengths indicate more aromatic, condensed, and higher molecular weight (MW) structures (Lichtman and Conchello, 2005). The peak position and intensity of EEM depend not only on the structure, MW, quantum yield and concentration of each fluorophore, but on solvent (and pH and ionic strength). To the best of the author’s knowledge, no prior report utilized fluorescence EEM to characterize sorghum seed extracts.
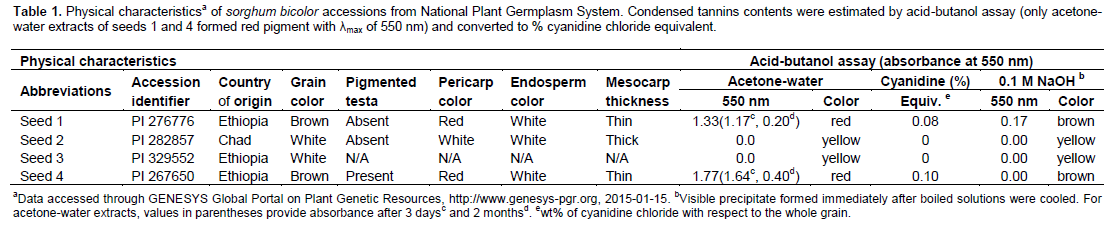
The objective of this study was to understand the relationships between the function (redox and metal complexation) and structural properties (aromaticity and ionizable functionalities) of sorghum pericarp which will ultimately control its antioxidant and bird/mold resistance behaviors. Available chemical characterization methods of sorghum seeds heavily rely on the colorimetric targeting of structural groups, e.g., acid-butanol and vanillin assays for condensed tannins (Dykes and Rooney, 2006). Because colorimetric methods can be influenced by interferences, are often kinetically controlled, and could involve toxic reagents (e.g., ferricyanide in Prussian blue assay) (Schofield et al., 2001), refined methods have emerged for the quantification of proanthocyanidins (Grabber et al., 2013) and metal complexation (Karamać and Pegg, 2009). This study focuses on model light- and dark- colored Sorghum bicolor accessions with known physical properties (Table 1).
Distilled, deionized water (DDW) with a resistivity of 18 MΩ cm (APS Water Services, Van Nuys, CA) was used for all the procedures. As a reference material, polyphenolic macromolecules of known phenolic C content and aromaticity were obtained from International Humic Substance Society (IHSS, 2014): Elliott soil humic acid (ESHA; 1S102H), reference Suwannee River natural organic matter (SRNOM; 1R101N), and standard Suwannee River II humic acid (SRHA; 2S101H). All other chemical reagents were obtained from Sigma-Aldrich (Milwaukee, WI) with the highest purity available.
Extraction of sorghum seed accessions
S. bicolor accessions were received from National Plant Germplasm System (NPGS) (USDA, 2014) from east and central Africa in 1960s, and are hereby denoted (parenthesis provides NPGS accession identifier): Seed 1 (PI 276776), Seed 2 (PI 282857), Seed 3 (PI 329552), and Seed 4 (PI 267650). Table 1 shows physical characteristics of each seed (GENESYS, 2015). Each accession was extracted as received without grinding or other sizing pretreatments. Two separate extraction fluids were employed to (i) preserve original structures of polyphenols by minimizing the oxidation by O2 in air, a process called autoxidation (acetone : water= 70:30 vol%; hereby denoting acetone-water) (Grabber et al., 2013) and (ii) examine the oxidative degradation at elevated pH (0.1 M NaOH; hereby denoting NaOH). For each accession, 0.5 g seed sample was rotated end-over-end at 70 rpm in 10 mL extraction fluid in amber glass vial with Teflon lined screw cap (40 mL nominal volume, Thermo Fisher Scientific, Waltham, MA) for 5 days. Suspension was centrifuged (900 ×g for 30 min) and the supernatant was filtered (0.45 µm Millipore Millex-GS; Millipore, Billerica, MA) and refrigerated.
Electron-donating capacity and condensed tannin content of seed extracts
Electron-donating capacity of sorghum extracts were investigated by (i) reduction of FeIII by seed extracts under acidic pH, and (ii) quantification of FeII product using ferrozine colorimetric method (Stookey, 1970). Acidic pH was utilized to make FeIII reduction by dihydroxybenzene thermodynamically favorable (Figure 1). Seed extract (0.2 mL) and FeIII(NO3)3.9H2O stock solution (1 mM in 0.5 M HCl) were diluted in DDW to yield 50-200 μM FeIII(NO3)3.9H2O. Final volume of each reactor was set to 5 mL and pH was recorded (Orion 3-star plus benchtop pH meter, ThermoScientific, Waltham, MA). Reactors were allowed to stand for 30 min, and then 0.2 mL of resulting solution was added to 5 mL ferrozine stock solution (3-(2-Pyridyl)-5,6-diphenyl-1,2,4-triazine-p,p’-disulfonic acid monosodium salt hydrate, Sigma-Aldrich; 0.1 g L-1 in 0.5 M 3-(N-Morpholino) propanesulfonic acid (MOPS) buffer at pH 7) (Stookey, 1970). Absorbance at 562 nm (Stookey, 1970) was measured using diode-array UV/visible spectrophotometer (HP8452A, Hewlett-Packard, Palo Alto, CA) with DDW as the blank immediately and over 60 days period. Five point calibration was obtained using 1.0 M FeIICl2.4H2O (Aldrich) stock solution prepared in 1.0 mM HCl daily to minimize autoxidation. In order to account for the changes in FeII concentration by complexation (rather than oxidation), control experiments were conducted by repeating the above-described procedure using 200 μM FeIICl2.4H2O. Seed extract-free controls were obtained for 200 μM FeIICl2.4H2O and FeIII(NO3)3.9H2O. Control experiments using replicate extracts of each accession indicated relative standard deviation less than 10%.
Acid-butanol assay is a standard method for quantifying proanthocyanidins (condensed tannins) in sorghum seeds (Porter et al., 1985). Briefly, 6 mL of n-butanol + concentrated HCl (95:5, vol%) and 1 mL extract were mixed in a culture tube. After adding 0.2 mL of 2% (w/v) NH4FeIII(SO4)2.12H2O (in 2 M HCl), reactor was vortexed and then placed in boiling water bath for 50 min. Full spectrum (280-650 nm) was taken before and after boiling, and absorbance was recorded at 550 nm. Blank spectra were obtained for 0.1 M NaOH and acetone-water without seed extracts. Calibration was obtained by repeating the above-described procedures for cyanidin chloride.
UV/visible and fluorescence spectra
UV/visible and fluorescence EEM spectra were obtained for seed extracts diluted (1:100 for UV/visible; 1:50 for fluorescence) in 20 mM acetate (pH 5) and MOPS (pH 7 and 8.5) pH buffers. UV/visible spectra were obtained at 280-780 nm using 20 mM pH buffer (set at sample pH) as the blank. Fluorescence EEM of each extract was obtained using F-7000 spectrofluorometer (Hitachi, San Jose, CA) set to 220-400 nm excitation and 280-600 nm emission wavelengths in 3 nm intervals; 5 nm excitation and emission slits; 0.5 s response time; and 2400 nm min-1 scan speed. The blank EEM for background solution (pH buffer and acetone-water) was obtained daily, and subtracted from each sample to remove background EEM and the lower intensity Raman scattering (Christensen et al., 2005).
Physical properties of accessions and extracts
As shown in Table 1 and Figure 1, Seeds 2 and 3 were white grains, while Seeds 1 and 4 were brown, and only Seed 4 contained pigmented testa (GENESYS, 2015). Therefore, only Seed 4 is the type II-III tannin sorghum, and is expected to contain significant amounts of condensed tannins (Hahn and Rooney, 1986). Brown grain color of Seed 1 could originate from thick pericarp that consists of 3 layers: epicarp containing wax and pigments, mesocarp, and the innermost endocarp layer (Earp et al., 2004b). Thick pericarp makes milling difficult, and indicates higher polyphenol contents (Earp et al., 2004b). White endosperm color of Seeds 1, 2 and 4 (Table 1) indicates low beta-carotene content (Salas et al., 2008).
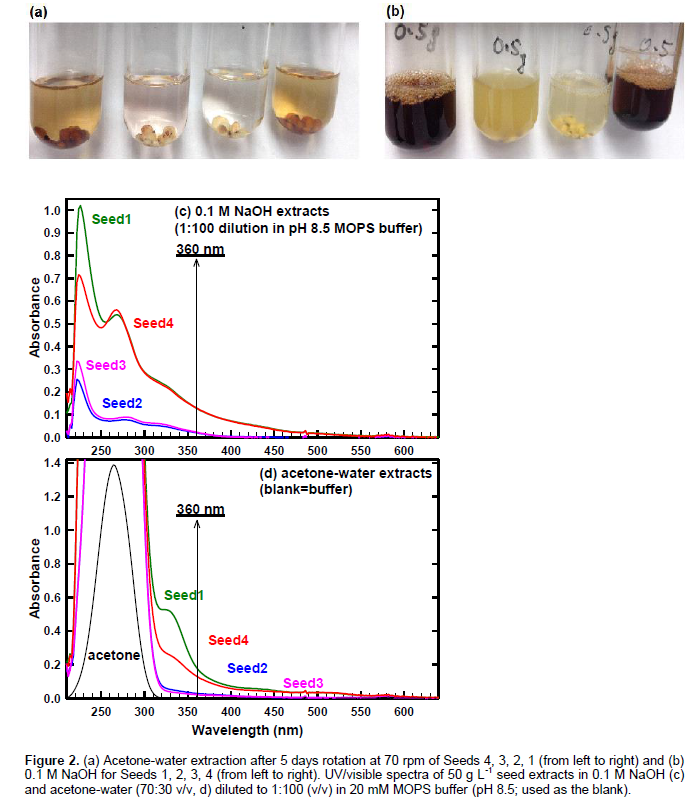
Although, sorghum seeds are often ground to powder before extraction (Xu and Chang, 2007), this study focused on the external surface that will come into contact with bird and other predators on farm (Wu et al., 2012), and did not employ sizing or other pretreatments. Water extraction (by soaking grains in water and base) has been utilized to remove tannins and improve protein digestion for human consumption (Ali et al., 2009). Sorghum seeds (50 g L-1) were extracted as-received (USDA, 2014) in acetone-water (70:30 vol%) (Grabber et al., 2013) and 0.1 M NaOH for 5 days at 70 rpm. Acetone-water extraction was expected to preserve the original chemical structures in the pericarp (Grabber et al., 2013).
In contrast, NaOH extraction could changed the original chemical structures by autoxidation (reaction with O2 at elevated pH), base-catalyzed hydrolysis, and polymerization reactions. As shown in Figure 2b, NaOH produced darker brown extracts from brown seeds (Seeds 1 and 4) than acetone-water (Figure 2a). For white seeds, acetone-water formed clear (Seed 2) and light pink (Seed 3) extracts, while NaOH formed darker yellow extracts (Figure 2a and b). As shown in Figure 3, NaOH extraction partially digested the seeds. Kernel is composed of protein, fat, starch and ash (Neucere and Sumrell, 1980), and starch granules in endosperm are embedded in dense protein matrix (Salas et al., 2008). Brown seeds retained color after acetone-water extraction (Figure 2), and repeated extraction did not remove the color.
UV/visible spectra of seed extracts
Figure 2 presents UV/visible spectra of seed extracts in NaOH (c) and acetone-water (d). Samples were prepared by diluting (1:100 v/v) extracts in 20 mM MOPS buffer (pH 8.5; used as the blank). In Figure 2d, acetone peak is provided for the background concentration in each sample (0.35 mL acetone+9.65 mL DDW). Figure 2c and d show the following absorbance trend across 320-600 nm for both NaOH and acetone-water extracts: Seed1≈Seed4>Seed2≈Seed3. Because acetone absorbs at <320 nm, 360 nm was selected as the reference wavelength to provide comparison among seeds. Absorbance in ultraviolet (180-400 nm) to visible (400-780 nm) regions result from n→π* and π→π* transitions (Bruice, 1998). Because of greater energy of radiation, λmax of π→π* transition occurs at lower wavelength than n→π* transition (Bruice, 1998). Because of O2 absorption (Bruice, 1998), <210 nm regions is not useful for identifying characteristic bands. Depending on pH and background electrolyte, UV absorbance correlates with 13C NMR aromaticity (Weishaar et al., 2003). At a given wavelength, higher absorbance at higher pH is expected from deprotonation (Bruice, 1998), dispersion of aggregate, and oxidative coupling of polyphenols (Janot et al., 2010).
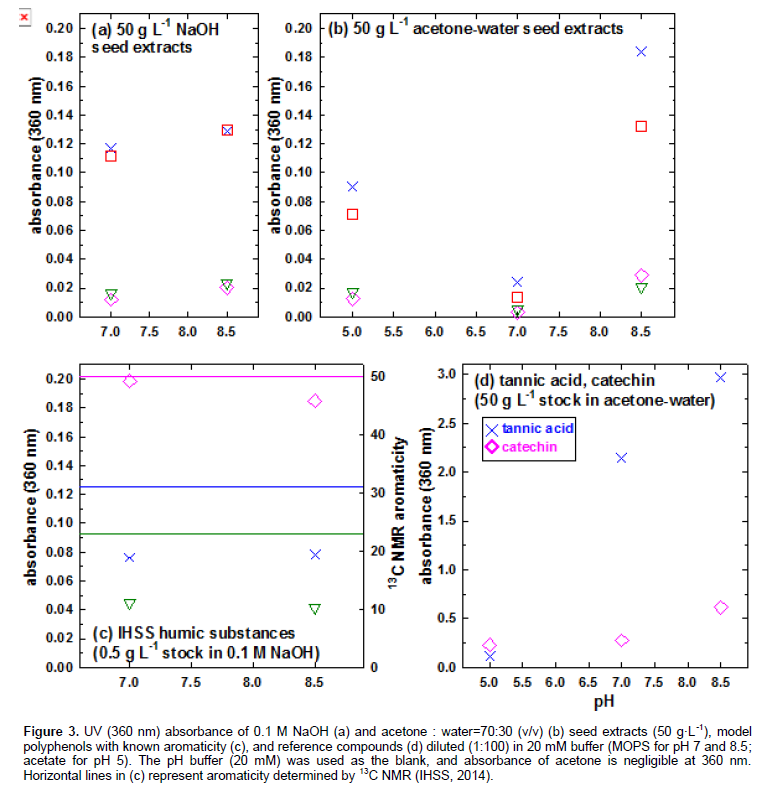
Figure 3a-b present the absorbance at 360 nm as a function of pH. The pH dependence of acetone-water extracts (Figure 3b) indicates amphoteric nature of sorghum grain extracts: (i) deprotonation of phenolic –OH (increase in absorbance from pH 7.0 to 8.5) and (ii) deprotonation of –COOH or protonation of amine near isosbestic point (increase in absorbance from pH 7 to 5) especially for Seeds 1 and 4. Similar pH dependence was observed for NaOH extracts at pH 7-8.5 (Figures 3a-b; acetate did not buffer pH of NaOH extracts to 5). On the other hand, reference compounds containing only phenolic –OH (tannic acid and catechin) showed a progressive increase in absorbance from pH 5 to 8.5 (Figure 3d). Figure 3c shows UV (360 nm) absorbance in NaOH by 3 reference polyphenolic macromolecules with decreasing 13C NMR aromaticity from ESHA, SRHA to SRNOM. Horizontal lines in Figure 3c represent aromaticity (right y-axis) determined solid-state 13C NMR at 165-110 ppm region (IHSS, 2014). Polyphenolic macromolecules showed a progressive increase in 360 nm absorbance as a function of aromaticity (Figure 3c): SRNOM (23%) < SRHA (31%) < ESHA (50% aromatic C). At a given pH, Seeds 1 and 4 had significantly higher absorbance at 360 nm than Seeds 2 and 3 (Figure 3b); this trend was maintained for acetone-water extracts without dilution: Seed 1 (1.39 absorbance at 360 nm) ≈ Seed 4 (1.00) << Seed 2 (0.30) ≈ Seed 3 (0.12). In conclusion, acetone-water extracts of Seeds 1 and 4 showed pH-dependent absorbance at 360 nm indicative of amophoteric nature. Seed 1 had 360 nm absorbance as high as ESHA and slightly lower than catechin (50 g·L-1 at pH 8.5 for all). Absorbance at 360 nm is a useful measure for (i) aromaticity and (ii) deprotonating (from pH 7 to 8.5) and protonating (from pH 7 to 5) functional groups of sorghum seeds.
Acid-butanol assay and reduction of FeIII
In Table 1, acid-butanol assay was employed to determine the presence of proanthocyanidins (condensed, flavanoid-based tannins) (Porter et al., 1985). In acid-butanol assay, proanthocyanidins are oxidatively cleaved at 4,8 linkages to form red anthocyanidin pigment having λmax of 550 nm (Porter et al., 1985). For samples containing water, acid-butanol assay yields higher reproducibility than vanillin method that measures both condensed tannins and flavanols (Burns, 1971). As summarized in Table 1 and described in detail in the Appendix, only acetone-water extracts of Seeds 1 and 4 formed red pigment after boiling. Slightly higher absorbance was observed for Seed 4 (0.10 wt% cyanidin chloride equivalent per whole grain (Table 1) containing pigmented testa than Seed 1 (0.08 wt%). Acid-butanol assay was kinetically controlled, and the absorbance progressively decreased over 3 days period (Appendix).
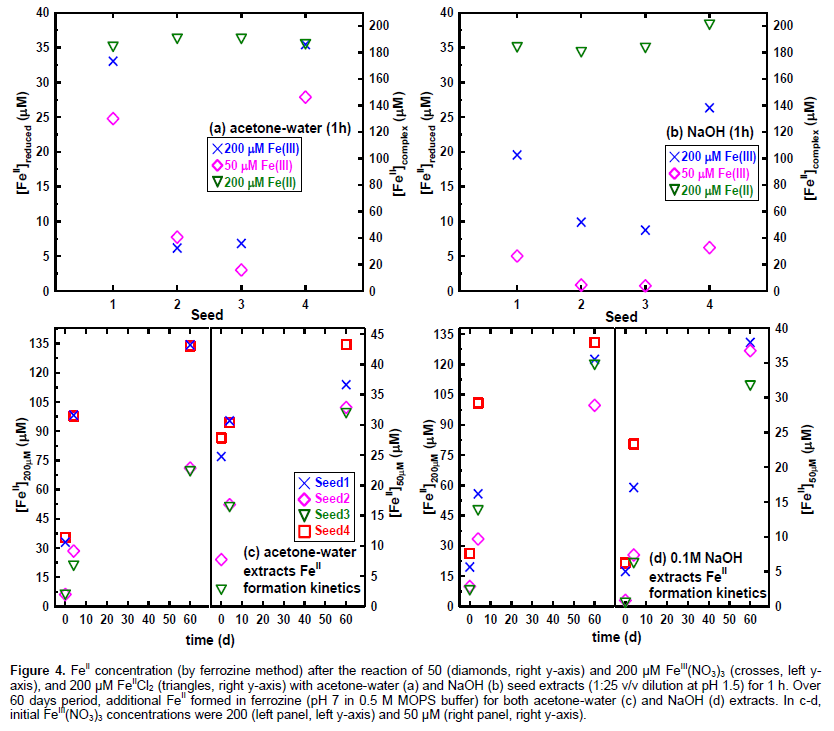
The presence of condensed tannins in Seeds 1 and 4 suggests their ability to reduce iron. Acidic pH was utilized to (i) make FeIII reduction by dihydroxybenzene thermodynamically favorable (Figure 1), (ii) minimize oxidation of FeII product by O2 (Kanzaki and Murakami, 2013) and (iii) minimize FeII complexation by phenolic components of seed extracts (Martell et al., 2004). These conditions will allow us to quantify the electron-donating capacity of seed extracts. Figures 4a-b present the amount of FeII produced by the reaction between seed extracts and FeIII(NO3)3 (50 and 200 μM at pH 1.5 set by HCl) for 1 h. For a given seed, acetone-water produced higher FeII concentration than NaOH. For both extraction fluids, FeII production was significantly higher for Seeds 1 and 4 than Seeds 2 and 3. These results indicate greater antioxidant (electron-donating) capacity of Seeds 1 and 4 than Seeds 2 and 3. Figure 4a-b (triangles for right y-axis) show negligible FeII loss by complexation and autoxidation under acidic pH in all cases. Values in Figures 4a-b were obtained immediately after the addition of ferrozine. As shown in Figure 4c-d, FeII continued to be formed in ferrozine solution at pH 7 over 60 days period. Similarly to acid-butanol assay (Table 1 and Appendix), NaOH extracts formed yellow precipitates during the reaction with FeIII(NO3)3 at pH 1.5. The precipitates could be dispersed by hand shaking, and was likely formed by charge neutralization involving protein in digested seed (Figure 3) at acidic pH. The formation of visible precipitate could contribute to lower electron-donating capacity of NaOH extracts than acetone-water (Figures 4a-b).
Colorimetric methods are used to study FeII com-plexation by tannins, and ferrozine has been suggested as a replacement for Prussian blue test (Karamać and Pegg, 2009). Ferrozine method has also been employed to study the reduction of FeIII by flavones, isoflavones, flavanones and flavanol near neutral pH (Mira et al., 2002). Flavonoid structures with 2,3-double bond (to form quinone oxidation product), 3-hydroxy group (that decreases the reduction potential of dihydroxybenzene reactant), and redox-active catechol in B-ring were most reactive towards FeIII (Mira et al., 2002). At pH 5, flavonoids that reduced FeIII (quercetin and myricetin) also complexed FeIII (Mira et al., 2002). Catechol groups of tannic acid (hydrolysable tannins) form complexes with FeIII that change color as a function of pH (Ejima et al., 2013). The complexes are most stable near neutral pH, and high FeIII concentration leads to aggregation (Ejima et al., 2013). Similar redox and complexation chemistry between tannins and iron has been utilized in the ancient technology known as the iron gall ink (Wilson et al., 2012).
Fluorescence EEM
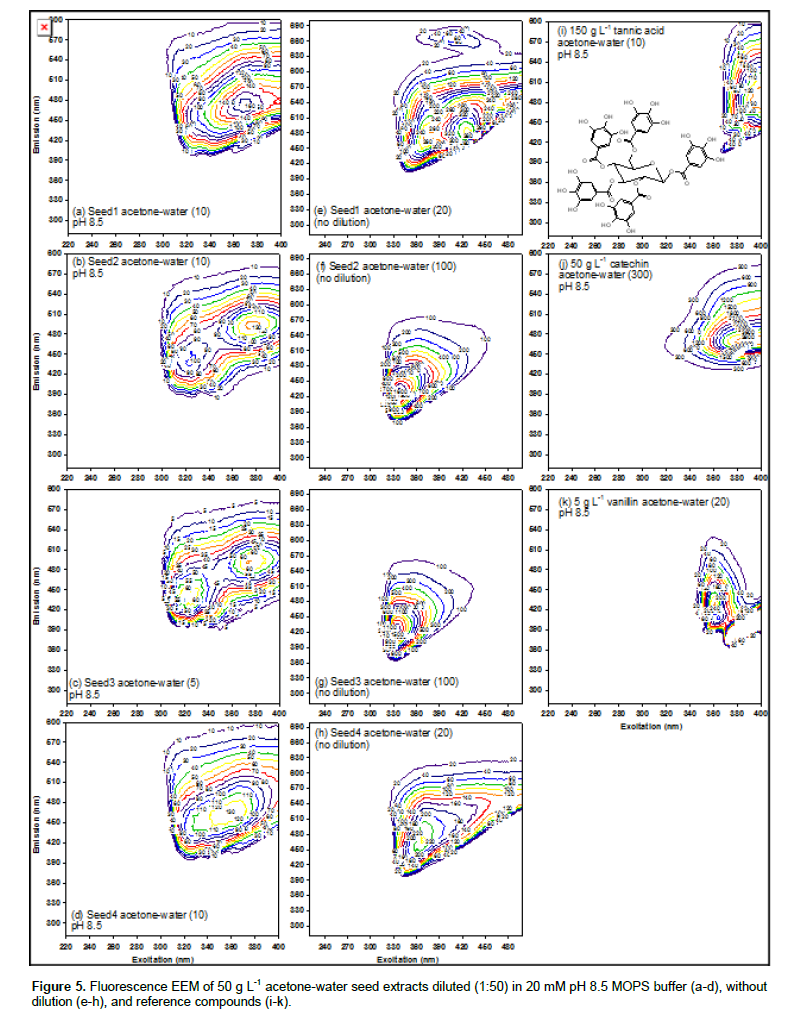
Figure 5a-d present fluorescence EEM spectra of acetone-water seed extracts at pH 8.5 (1:50 dilution in 20 mM MOPS buffer). On each plot, contour interval is provided in parenthesis, and the intensity is given on each contour line. Figure 5 of provides blank (background acetone-water) EEM subtracted to produce Figures 5. Seeds 2 and 3 contained nearly identical peaks at 320-325/440 and 370-380/490; Seed 1 contained a single peak near latter (370/470). Seed 4, in contrast, contained a single peak (360/460) located between the two peaks of Seeds 2 and 3. In acetone-water without dilution (Figure 5e-h), likewise, Seeds 2 and 3 contained an identical peak at 335-340/425-430. As compared to Seeds 2 and 3, higher EEM wavelengths were observed for Seeds 1 and 4 (more so for the excitation wavelength of Seed 1). As illustrated in Figure 5i-k, EEM wavelengths increase with increasing amount of conjugated electrons (benzene ring) from vanillin, catechin, to tannic acid. Therefore, Seed 1 is more aromatic than Seed 4, in agreement with 360 nm absorbance in Figure 3b.
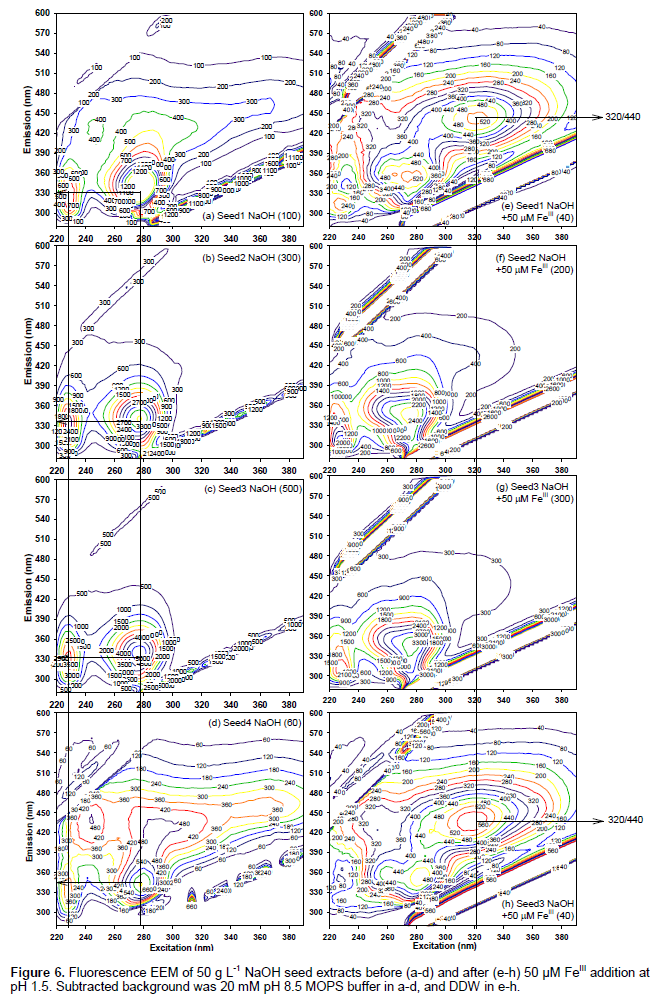
As shown in Figure 6a-d, NaOH extract of all seeds showed two identical peaks at 230/330 and 280/330. The peak intensity decreased in the following order: Seed 4 > Seed 3 > Seed 2 > Seed 1. Low emission wavelengths (230/320 and 280/320) of NaOH extracts are similar to “protein-like” EEM peaks attributable to tyrosine and tryptophan (Andersen and Mortensen, 2008). In conclusion, acetone-water extracts formed two identical peaks at 320-325/440 and 370-380/490 for white Seeds 2 and 3, and indicated greater aromaticity of Seed 1 than Seed 4. In contrast, NaOH extracts of all seeds were represented by two distinct peaks at 230/320 and 280/320 attributable to protein.
Figure 6e-h present NaOH extracts after FeIII addition (NaOH extracts were diluted (1:25 v/v) in 50 μM FeIII(NO3)3+HCl, pH 1.5), corresponding to diamonds in Figure 4b before the addition of ferrozine. As shown in Figure 4b (diamonds), only Seeds 1 and 4 reduced 50 μM FeIII to form FeII. As compared to Figures 6a-d (NaOH extracts without added FeIII), Figures 6e and h (Seeds 1 and 4) showed a new 320/440 peak. The new 320/440 peak was not observable in Seeds 2 and 3 (Figure 6f and g). There are several possible causes of the new 320/440 peak upon FeIII addition to brown seeds. Alkaline (0.1 M NaOH) extraction partially digested sorghum seeds (Figure 3) to form “protein-like” peaks in all seeds (Figures 6a-d) that was absent in acetone-water extracts (Figures 5a-d). Subsequent addition of FeIII under acidic pH formed brown precipitates for Seeds 1 and 4, and white precipitates for Seeds 2 and 3. The precipitates were dispersed by hand-shaking before fluorescence EEM analyses in Figures 6e-h. New 320/440 peak in Seeds 1 and 4 (Figures 6e and h) could arise from (i) polyphenols released from protein upon the addition of FeIII, and (ii) the quinone oxidation product that is less easily complexed by protein and iron than (poly)phenols.
Sorghum tannin can bind and precipitate as much as 12 times its own weight of protein via hydrogen bonding and hydrophobic interactions (Duodu et al., 2003). Low (<10 μM) added concentrations of FeIII, AlIII, CuII and HgII typically cause fluorescence quenching of polyphenols (Yan et al., 2013). Fluorescence quenching has been attributed to the binding of metal ions by carboxylate and phenol functionalities, and deprotonation (upon metal binding) of polyphenolic ligands (Yan et al., 2013). To the best of the author’s knowledge, this is the first report on the formation of new EEM peaks upon the addition of metal ions. New 320/440 peak can serve as the fingerprint for metal/protein complexation properties of tannins, and contribute towards the development of rapid, easy and inexpensive industrial methods for feedstock accounting and quality assurance at food and biochemical/fuel production facilities.
In conclusion, acetone-water extracts showed (poly) phenolic (380/480) peak having similar intensity, regardless of grain color (Figure A.1). Likewise, NaOH extracts showed protein-like (230/330 and 280/340) peaks for all seeds. Therefore, fluorescence EEM provided a more sensitive structural determination than the UV (360 nm) absorbance which correlated with seed color, that is, higher absorbance for darker seeds. New320/440 peak was observed upon FeIII addition in brown seeds, but not in white seeds (Figure 5e-h). UV (360 nm) absorbance was not affected by Fe addition. This new 320/440 peak can serve as the indicator EEM wavelengths for metal/protein complexation properties of tannins.
Color of sorghum grains before and after extraction, acid-butanol assay, and background fluorescence EEM spectra subtracted in Figures 5-6. This materials is available free of charge online.