Full Length Research Paper

ABSTRACT
INTRODUCTION
Brazilian cattle production based on pastures provides excellent market competitiveness once it reduces costs production. Among pastures species, Bermuda grass are greatly used in Brazilian pastures, mainly for dairy production. Nitrogen fertilizer management is determinant for yield and nutritive value of forages. Due the complex biological processes involved in the N cycle, nitrogen soil analyses cannot be used directly to assess N nutrition of plants. Therefore, it is necessary to analyze the crop nitrogen content as the percentage of the above-ground biomass N. However, the absolute N also varies during the growth crop period and season of the year.
N fertilization of grasses frequently increases yield, as well as the level of crude proteins (Monteiro, 1995). However, more studies are needed on N-management. The common recommendation to split N-application into two or more applications is based on the assumption that splitting applications can improve N-supply synchronization with a plant’s ability to utilize nutrients, reducing potential N-loss. Due to this, there is an idea that the greater the number of N-splits, the smaller is the N loss (Coelho, 2007).
Fertilization must be sufficient to provide optimal plant development and final yield. Critical N-concentration has been defined as the minimum crop N-concentration required for reaching maximum crop growth. Once N-concentration is below this level, plant yield tends to decrease. Early on spring, after winter frost, death biomass may impaired plant regrowth, especially due to N immobilization.
Sartor et al. (2011) reported that the amounts of N absorbed by Urochloa plantaginea differed statistically between N-levels (200 and 400 kg ha-1). Treatment with 200 kg ha-1 of N, split into two applications, resulted in plant N content below the critical N-dilution curve proposed by Lemaire (1997), limiting its yield potential. This result shows the high N-recovery potential of U. plantaginea and the negative effect of N-splitting, when N-availability does not meet plant demand.
Even when there is an ample supply of N, the N-concentration in plants within dense canopies declines as they grow (Greenwood et al., 1986). This phenomenon has usually been interpreted as resulting from plant ageing and is related to plant phenology. The use of the critical N-dilution curve has been proposed as a plant bases approach for assessing crop N nutrition.
N-recovery and agronomic efficiency varies among species; although, forage grasses have a higher capacity with an overall N-recovery of 68 to 75% (Primavesi et al., 2001). This is directly related to its better development and deep root system, which provide better soil cover and higher N-absorption, providing a secure means of recycling the nitrate.
Nitrate is the main form of N available in the soil, resulting from applied N-fertilizer or organic matter mineralization. When nitrate is not absorbed by plants or immobilized by soil microbes, it remains free in soil solution and is subject to leaching into deeper layers, reaching surface waters or groundwater (Dynia et al., 2006).
The objective of the current study was to study the N dynamics (nitrogen nutritional status, accumulation rate and total dry matter (DM) production, soil nitrate levels and from it, calculate the N-recovery and N-use efficiency) under different N management aiming to understand the effect of N-split sidedress application on Tifton 85.
MATERIALS AND METHODS
The study was carried out in the 2011/2012 period (December to May) and repeated in 2012/2013 (September to February), at the experimental unit of the Agronomic Institute of Paraná (IAPAR), in Pato Branco, (located 26º07’ S; 52º39’ W) on an established 4-year-old Tifton 85 bermudagrass pasture and the fertilization practices were guided by soil chemical analyses and also based on the recommendation of the Brazilian Commission for Chemical and Soil Fertility (CQFS/RS-SC, 2004). Management history prior to this current study includes occasional mechanical mowing and chemical control to suppress weed infestation. Broadcast nitrogen fertilizers were not applied before this study.
Experimental site soil is classified as Red Dystrophic Oxisol with clay texture (EMBRAPA, 2006). At the beginning of the experiment, soil samples (10 sub-samples) were collected from the 0-20 cm depth of soil, which showed the following chemical traits: pH (CaCl2) = 5.50; organic matter (OM) = 50.93 g dm-3; P = 13.25 mg dm-3; K = 0.53 cmol(c) dm-3; Ca = 6.96 cmol(c) dm-3; Mg = 3.79 cmol(c) dm-3; base saturation = 71%; and Cation Exchange Capacity (CEC) of 15.87 cmol(c) dm-3.
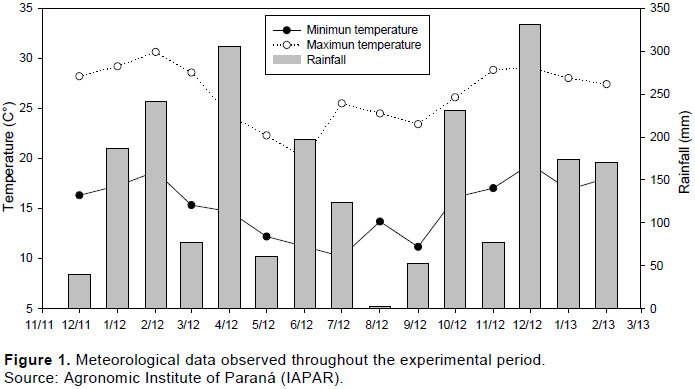
The climate of the region is subtropical humid (Cfb) with well-distributed rainfall throughout the year, according to the Köppen classification. Average annual rainfall for the period of 1980 to 2010 was 2,077 mm year-1 (IAPAR). Figure 1 shows the meteorological data observed throughout the experimental period.
Experimental treatments were replicated four times using a split plot randomized block design. N-management was applied all at once or split into two or four applications in the main plots. N-levels of 0, 100, 200 and 300 kg ha-1 were used in the split plot (15 m2). Titfon 85 was rubbed and N-fertilization (urea with 45% of N) applied manually. Weather conditions (rainfall and soil moisture) were observed in order to allow the system to maximize the benefit of the N. Soils sampling to evaluate nitrate levels were collected at 0-5, 5-10 and 10-20 cm depths.
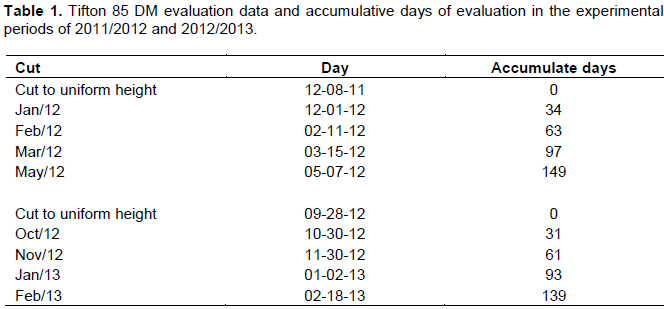
Forage DM accumulation (kg ha-1 day-1) was evaluated by cutting the pasture in a square area of 0.25 m2. When the pasture reached a height of 28 cm, plants were manually cut with a cleaver, at a height of 5 cm from ground level to determine the pasture growth rate (Table 1.) For all treatments the pasture was cut four times. Samples were dried in a forced-air oven at 60°C until they reached constant weight and then converted to kg ha-1 of DM. Total forage production was obtained by adding the forage production of each period.
In order to assess the N-nutritional status of plants according to treatments in the second experimental period, the data of forage DM accumulation (Mg ha-1) were related to the plant N- concentration. The intersection points between these variables were contrasted with the N-dilution curve proposed by Lemaire (1997). N-use efficiency and N-recovery rates were evaluated from pasture DM production and its N-content. N-use efficiency of fertilization on forage yield (kg DM per kg N applied) was calculated assuming that the contribution of soil N was similar among treatments with or without N. Forage N-content multiplied by forage yield enabled the determination of N absorbed by the pasture. Each period was evaluated in this manner, and the sum of the periods resulted in the total N-absorbed.
N-recovery and N-use efficiency of Tifton 85 were calculated using the following equation:
Nitrogen Recovery (%) = [(NUF - NUNF)/AFA] x 100
N-use efficiency (kg DM per kg N) = [(DMY - DMYNF)/AFA]
Where: NUF (kg N ha−1) = N-uptake of forage fertilized in the N treatments; NUNF (kg N ha−1) = N-uptake of forage at 0 kg N ha−1; DMYF (kg ha−1) = yield of forage fertilized with N-treatments; DMYNF (kg ha−1) = yield of forage at 0 kg N ha−1; and AFA (kg N ha−1) = amount of fertilizer applied in the N-treatments.
To determine soil nitrate levels, soil samples were collected in each sub-plot, every ten days, on average, after the N-application, from the following soil depths 0-5, 5-10 and 10-20 cm, by using a shovel and a graduated ruler. Samples were dried in a forced-air oven at 55°C for 72 h, and the concentration of NO3- was determined by the Kjeldahl method described by Tedesco et al. (1995). Forage N-determination was also evaluated by the Kjeldahl method.
Results were subjected to analysis of variance assessed by the Bartlett test for homogeneity. When results showed significance at 5 and 1% probability; the means of qualitative factors (N-management and soil sampling depth) were compared using the Tukey test at 5% probability of error. Polynomial regression was applied to the quantitative factors (N-rates). Linear and quadratic models were tested and the selection of a model was based on significance (less than 5%) and the coefficient of determination. For the significant interaction, evaluations were conducted on the increasing N-rates within each situation and, subsequently, on the behavior of each condition within each N-rate. Where the interaction was not significant; factors were analyzed separately.
RESULTS AND DISCUSSION
Total DM production
In the 2011/2012 period, there was a significant interaction (P=0.0158) between N-management and N-rates for total DM production (149 days of evaluation), whereas in the 2012/2013 period, only the effect of the N-rates were present (P=0.0000). In the 2011/2012 period, the highest total DM production was of 14,976 kg ha-1, with 300 kg ha-1 of N, when treatments were split into two and four applications. With the same N-rate, N-management applied all at once resulted in a total DM production 17%, or 2,491 kg ha-1 lower, when compared to the average value for N-management with two and four applications (Figure 2).
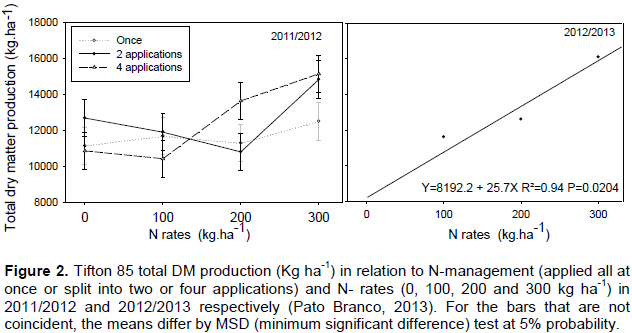
In the 2012/2013 period, only a linear effect of N-rates on total DM production was observed, reaching a value of 16.9 Mg ha-1 at 300 kg ha-1 of N. This production is 104% higher than the control and for each kg ha-1 of N applied, a dry mass yield increase of 26.0 kg ha-1 (Figure 2) was observed. Quaresma et al. (2011) noticed increases of 22.7 kg ha-1 in the production of Tifton total DM for each kg ha of N applied.
Total DM production reported in this paper was higher than the values reported by Quaresma et al. (2011), which DM yield (period from January to April) ranged from 6.3 and 11.7 Mg ha-1 at the treatments without N and with 240 kg ha-1 (N-split in four times), respectively. Under similar soil and climate conditions, Cecato et al. (2001) reported Tifton 85 total DM production of 7.5 and 14.3 kg ha-1 in response to treatments without N and with 400 kg ha-1, respectively. Thus, Alvim et al. (1999) evaluating Tifton 85 DM yield (23.1 Mg ha-1) along the year, reported pasture nitrogen response to higher levels of N (600 kg ha-1).
The application of N in the first experimental period occurred four years after pasture establishment. During this interval there was no N-fertilization. This probably caused a great shortage in soil N, once the increase of soil microbiota was stimulated by N-fertilization and a great part of N was temporarily immobilized in the soil microbiota.
Probably, in the case of N being applied all at once, the microbial population was not large enough to absorb all of it and part of N may have been lost. Although, when N-fertilization was split, the first N-application stimulated the increase of the microbial population which could have captured the N-fertilization applied in sequence.
The lack of response to the N-fertilization strategies treatment in the second experimental period can be a indicative of a soil-microbes plant system stabilization. The strategy of split N-fertilization into a few applications aims to reduce losses and improve its use efficiency and recovery (Cantarella and Marcelino, 2008). However, low N-recovery by plants can result from a temporary N-immobilization by soil microbiota, with the N becoming available after the death of microorganisms. In the second experimental period, there was probably enough mineral N in the soil for the microbes and the Tifton.
Queiroz et al. (2012) studying nitrogen levels (200 and 400 kg ha-1) and management (split or not and applied along rainy or dried rainfall season) on Cynodon spp cv. tifton 85 under irrigation reported that nitrogen fertilization strategy alters the curve of forage distribution throughout the year. The concentration of total or partial nitrogen fertilization in the dry period allows the maintenance of the pasture without big alterations in pasture support capacity. In spite of the lower response to N application in the dry period, the authors estimated that this may not be a problem, once the N non-absorbed in the dry season will be used in the following rainy period and, since in the irrigation there is control of the water depth applied, there are no risks of N leaching even at high doses.
Sartor et al. (2014) working with Alexandergrass (Urocloa plantaginea) with 200 kg ha-1 of N split into two applications, reported that the plant’s N-nutritional status was below the recommended level according to Lemaire and Gastal (1997). This data showed the high potential of N-recovery by even in its early stage of growth, where 100 kg ha-1 of N was not able to supply enough N for the plants.
Nitrogen dilution curves
In the second experimental period (2012/2013), the N-nutritional status of Tifton was assessed, based on the relation between forage DM accumulation (Mg ha-1) and plant N-concentration in comparison with the N-dilution curve proposed by Lemaire (1997).
In the treatment without N-application (Figure 3), the element concentration in the plant remained below the critical curve proposed by Lemaire (1997) in almost all plant cycle, indicating inadequate supply and N-uptake by the plants in this treatment. The N-dilution phenomenon was poorly observed when the largest N-fertilizer doses were applied (300 kg ha-1 N), primarily when this dose was split into two or four applications.
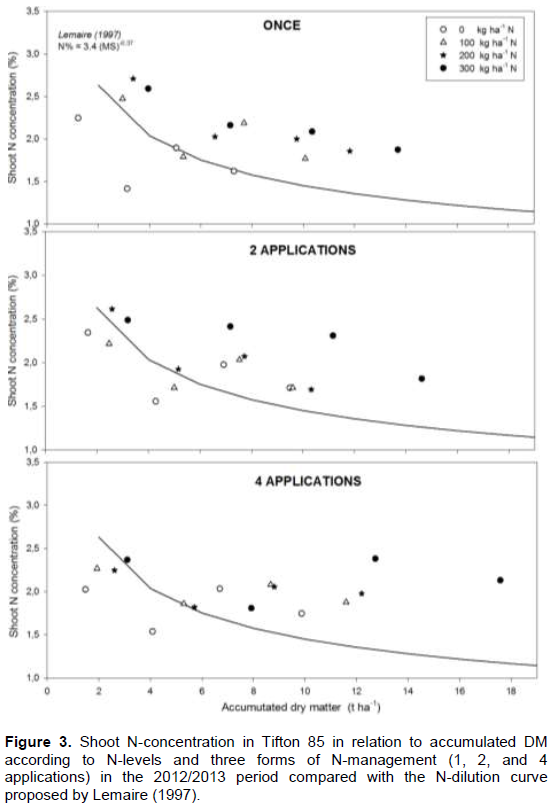
When the 100 and 200 kg ha-1 of N-fertilizer doses were split in two or four applications, more points below the curve of sufficiency propose by Lemaire (1997) was observed until 6 Mg ha-1 of DM accumulation (61 accumulated days). This is in agreement with the hypostasis that N-split can lead to N shortcoming in early development plants stage, because the split action reduces the initial N availability.
Consequently, the recommendation of splitting small N-doses (below 200 kg ha-1) reduces the production and qualitative potentials of C4 forages. On the other hand, the application of 300 kg ha-1 had caused greater fodder N-concentration with a slight advantage when it was applied all at once. The biggest DM productions were observed (18 Mg ha-1) when the 300 kg ha-1 of N were split in two or four applications. However, no significant differences caused by different N-management forms on total production of DM were observed.
After successive N-applications, in special when N-fertilizer was split in four times, the pasture started to show satisfactory N-nutritional indices and according to the plant biomass analysis, there was an N “luxury consumption” showed by N levels beyond what would be necessary for its growth, which may characterize the highest forage quality or accumulation of reserves (Lemaire et al., 1989).
Nitrogen recovery
In both experimental periods, N-recovery was affected by N-rate (Figure 4). In the first experimental period, N-recovery increased as N-rate increased (P=0.0079), whereas, in the second experimental period, N-recovery tended to reduce as N-rate increased (P=0.0020). N-recovery for the treatment with 100 kg ha-1 of N, in the 2011/2012 period was negative (-5.2%). At the same N-level, N-recovery increased to 69.2% in the second experimental period. The increase in N-recovery between periods shows the residual effect of the N-rate applied in the 2011/2012 period. Such residual effect might store N in the soil increasing N-availability for the subsequent period (Figure 4).
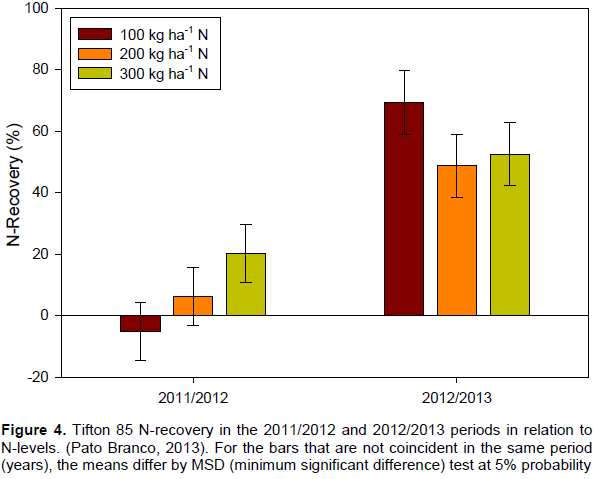
N-recovery in the first experimental period (2011/2012) was also affected by N-management (P=0.0326). The lower N-recovery (-10.0%) was observed when N-rate was split twice. Meanwhile, N-recovery was, on average, 15.6% higher when N-rate was applied all at once or split into four applications.
For a given period, total crop N-uptake is the addition of N derived from synthetic N-fertilizer applied in the same year, and from a variety of other sources (organic soil N, N-fertilizer applied in previous years, N-deposition from the atmosphere, biological N-fixation, applied crop residue and manure) (Yan et al., 2014). In this manner, Sartor et al. (2011) found an N-recovery rate of 110% by plants, that is, the plants absorbed more N than what was applied to the soil.
In addition, low N-recovery rates may not mean high loss of N, since this N may be in other soil compartments. In this manner, the lower N-recovery in the first period (2011/2012) can be a result of high immobilization of applied N-fertilizers as a result of no N-fertilization in the four prior years of the experiment.
When soil microorganisms have greater access to N in pastures due to higher N fertilizations, the additional N is used to produce microbial biomass. This process can result in greater N immobilization and higher N content in litter under high N fertilization (Liu et al., 2011). The results shows that the addition of N fertilization increased N content of Tifton biomass after 128 days indicating that microbes accessed N exogenous to litter. This demonstrates that plant litter deposition in grasslands can result in immobilization of N and limit availability for plant growth (Wedin, 1996).
These results are in accordance with Berg and Staaf (1981), which described a three-phase conceptual model for N release from residues, including (i) initial rapid release of labile nitrogenous compounds, (ii) N concentration and even absolute amount of N increasing in the decomposing material due to microbial immobilization of exogenous N, and (iii) N loss due to mineralization.
The greater values of N-recovery observed in the second evaluation period was a result of N-recovery from the N applied in the first experimental period, when the addition of N-fertilizer probably increased the microbial community, which may have absorbed the added N. The added N was not lost but rather temporarily immobilized and later released by mineralization process.
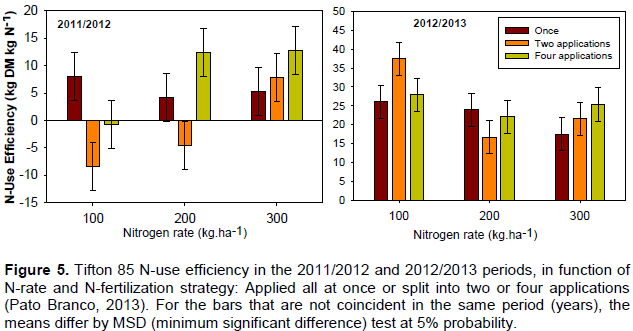
Nitrogen use efficiency
In the first experimental period (2011/2012), Tifton N-use efficiency was low and even negative when 100 kg ha-1 of N were split and when 200 kg ha-1 of N were split twice (Figure 5). Splitting small amounts of N-fertilizer probably affected initial plant growth, since there was not enough N to allow for initial plant regrowth and the increasing microbial community. Moreover, under low N-availability, there is competition between the microbial community and plants for this N, which tends to be used by the microbial community since it is more efficient in absorbing nutrients than plants. Furthermore, NUE of smaller N-fertilizer rates applied once were positive, demonstrating the importance of greater N-fertilizer rates in the initial periods. In the first period (2011/2012), splitting N-fertilizer rates was a successful strategy only for greater N-rates (300 kg ha-1). In the second period (2012/2013), in general, NUE increased showing a lower immobilization process compared to the first experimental period.
Soil mineral nitrogen
Soil nitrate levels were affected by N-levels. Higher differences were noticed in the first period of evaluation, when nitrate levels reached 250 mg kg-1 (18 days after N-application) at the 0-5 cm soil layer depth for the N-levels of 200 and 300 kg ha-1. Probably, a low microbial population at the time of N-application associated with an immediately low capacity of N-absorption resulted in higher nitrate levels in the soil (Figure 6).

When comparing the 2nd period in relation to the 1st one, it is noticed that soil nitrate levels were lower at the 0-5 cm soil layer (Figure 6). This may indicate an increased microorganism population caused by previous N-fertilization. The microorganism population and the Tifton plants were more efficient in absorbing N from the soil. The highest value of nitrate was observed when N-fertilizer was applied all at once in the 0-5 cm soil layer.
In this period, an effect of N-rate over soil nitrate concentration (P=0.0389) was also noticed. For each Kg of N applied, soil nitrate levels increased 0.11 mg kg-1 with the highest level (70 mg kg-1) being found at the 0-5 soil layer in the treatment with 300 kg ha-1 of N.
The results were similar to the early findings of Costa et al. (2008), which reported an increase of 68% in soil nitrate values with increasing levels of N on Brachiaria. However, based on N-recovery rate and N-use efficiency it is possible to affirm that there was no nitrate leaching. Primavesi et al. (2006) affirm that the application of N doses up to 500 kg ha-1 split in up to five times does not present risk of nitrate leaching to the groundwater, even during the rainy period.
CONCLUSION
Splitting small rates of N (less than 200 kg ha-1) reduces fodder N-concentration in the initial growth phase, which could impair performance of plant growth and biomass accumulation. The result of the study suggest that Tifton dry matter yield increased as N levels were increased up to 300 kg N ha-1, however, there was no significant effect in relation to the nitrogen management. Thus, it is not recommended to split N-application in pasture that historically receives no N or low levels of N fertilization.
CONFLICT OF INTERESTS
The authors have not declared any conflict of interests.
REFERENCES
|
Alvim MJ, Xavier DF, Verneque RS, Botrel MA (1999). Resposta do tifton 85 a doses de nitrogênio e intervalos de cortes. Pesq. Agropec. Bras., Brasília 34(12):2345-2352. |
|
|
Cantarella H, Marcelino R (2008). Fontes alternativas de nitrogênio para a cultura do milho. Informações Agronômicas 122:12-14. |
|
|
Berg B, Staaf H (1981). Leaching, accumulation and release of nitrogen in decomposing for- est litter. p. 163163ccumulation and release Rosswall (ed.) Terrestrial nitrogen cycles: Processes, ecosystem strategies, and management impacts. Ecological Bulletin Book Series. Munksgaard Publ., Stockholm, Sweden. |
|
|
Comissão de Química e Fertilidade do Solo RS e SC (CQFS)- RS/SC (2004). Manual de adubação e de calagem para os Estados do Rio Grande do Sul e de Santa Catarina. 10. ed. Porto Alegre 394 p. |
|
|
Cecato U, Santos GT, Machado MA, Gomes LH, Damaceno JC, Jobim CC, Ribas NP, Mira RT, Cano CCP (2001). Avaliação de cultivares do gênero Cynodon com e sem nitrogênio. Acta Scientiarum Agronomy 23:781-788. |
|
|
Coelho AM (2007). Manejo da adubação nitrogenada na cultura do milho. Embrapa, Sete Lagoas, MG, circular técnica 96. |
|
|
Costa KA, Faquin V, Oliveira IP, Rogrigues C, Severiano EC (2008). Doses e fontes de nitrogênio em pastagem de capim-marandu. I- Alterações nas características químicas do solo. R. Bras. Cience. Solo 32:1591-1599. |
|
|
Dynia JF, Souza MD DE, Boeira, RC (2006). Lixiviação de nitrato em Latossolo cultivado com milho após aplicações sucessivas de lodo de esgoto. Pesq. Agropec. Bras 41(5):855-862. |
|
|
EMBRAPA. Empresa Brasileira de Pesquisa Agropecuária (2006). Sistema Brasileiro de Classificação de Solos. 2.ed Rio de Janeiro: Embrapa solos 306 p. |
|
|
Greenwood DJ, Neeteson JJ, Draycott A (1986). Quantitative relationships for the dependence of growth rate of arable crops to their nitrogen content, dry weight and aerial environment. Plant Soil 91:281-301. |
|
|
Lemaire G, Gastal FN (1997). N uptake and distribution in plant canopies. In: Lemaire G. (Ed.) Diagnosis on the nitrogen status in crops. Berlin: Springer pp. 3-43. |
|
|
Lemaire G, Gastal F, Salette J (1989). Analysis of the effect of N nutrition on dry matter yield of a sward by reference to potential yield and optimum N content. In Proceedings of the XVI International Grassland Congress pp. 4-11. |
|
|
Liu K, Sollenberger LE, Silveira ML, Vendramini JMB, Newman YC (2011).Grazing Intensity and Nitrogen Fertilization Affect Litter Responses in "Tifton 85" Bermudagrass Pastures: II. Decomposition and Nitrogen Mineralization. Agronomy Journal 103:163-168. |
|
|
Monteiro FA (1995). Nutrição mineral e adubação. In: Simpósio sobre manejo da pastagem. Anais Fealq 12:227. |
|
|
Primavesi O, Correa LA, Primavesi AC, Cantarella H, Armelin MJA, Silva AG, Freitas AR (2001). Adubação com ureia em pastagem de cynodon dactylon cv. Coastcross sob manejo rotacionado: eficiencia e perdas. São Carlos- Embrapa Pecuária Sudoeste 42 p (Circular Técnica, 30). |
|
|
Primavesi O, Primavesi AC, Corrêa LA, Silva AG, Cantarella H (2006). Lixiviação de nitrato em pastagem de coastcross adubada com nitrogênio. Revista Brasileira de Zootecnia 35(3):683-690. |
|
|
Quaresma JPS, Almeida RG, Abreu JG,Cabral LS, Oliveira MA, Carvalho DMG (2011). Produção e composição bromatológica do capim-Tifton 85 (Cynodon spp.) submetido a doses de nitrogênio. Acta Sci - Animal Science 33:145-150. |
|
|
Queiroz DS, Menezes MAC, Oliveira RA de, Viana MCMM, Silva EA (2012). Nitrogen fertilization strategies for xaraes and tifton 85 grasses irrigated in the dry season. Revista Brasileira de Zootecnia 41(8):1832-1839. |
|
|
Sartor LR, Assmann TS, Soares AB (2014). Assessment of the nutritional status of grassland: nitrogen nutrition index. Seminário de Ciências Agrárias 35:449-456. |
|
|
Sartor LR, Assmann TS, Brugnara AS, Adami PF, Assmann AL, Pitta CSR (2011). Nitrogen fertilizer use efficiency, recovery and leaching of an alexandergrass pasture. Rural Brasilian Cience Solo 35:899-906. |
|
|
Tedesco MJ, Gianello C, Bissani CA, Bohnen H, Volkweiss SJ (1995). Análise de solo, plantas e outros materiais. UFGRS: Departamento de Solos, Porto Alegre 174 p. |
|
|
Yan X, Ti C, Vitousek P, Chen D, Leip A, Cai Z and Zhu Z (2014). Fertilizer nitrogen recovery effi-ciencies in crop production systems of China with and without consideration of the residual effect of nitrogen. Environmental Research Letters 9:1-9. |
|
|
Wedin, DA (1996). Nutrient cycling in grasslands: An ecologist's perspective. In: R.E. Joost and C.A. Roberts (ed.) Nutrient cycling in forage systems. PPI/FAR, Columbia, MO. pp. 29-44. |
|
Copyright © 2024 Author(s) retain the copyright of this article.
This article is published under the terms of the Creative Commons Attribution License 4.0


