ABSTRACT
The aim of this paper was to quantify and evaluate the spatial distribution of soil chemical properties in different grid sampling sizes using descriptive statistics and geostatistics. The study was carried out in Bom Sucesso City, Paraná State, Brazil. Using GPS, a 50 x 50 m grid sampling size was set, comprising four samples per hectare. In each grid point positioned on the field, soil samples at a depth of 00 to 0.20m were extracted, resulting in 203 sampling points in a 51.15 ha area. Calcium, magnesium and potassium quantity were determined. Grid sampling size, with lower number of samples per area, were established from the first grid, removing randomly, soil samples, resulting in: 70.8 x 70.8 m (2 samples/ha), 100 x 100 m (1 sample/ha), 141 4 x 141.4 m (1 sample/2 ha), 173.3 x 173.3 m (1 sample/3 ha) and 200 x 200 m (1 sample/4 ha) grid sampling sizes. Each soil chemical properties in each grid sampling size were subjected to descriptive statistical and geostatistical analysis. An experimental semivariogram was developed to understand the spatial dependence structure. The attributes calcium, magnesium and potassium showed spatial correlation in almost all grids sampling, except for the 200 m grid sampling for calcium and magnesium.
Key words: Spatial distribution of attributes, spatial dependence, descriptive statistics, geostatistics.
Brazilian agriculture, in recent decades, has undergone constant changes and technological advances, fast automation by the introduction of agricultural machinery and implements, with the aid of computer controls and global positioning technology (GPS), plant breeding, new active principles and positioning of pesticides, technology of controlled liberation of fertilizers, in order to increase yield number and reduce negative impacts on the environment (Silva, 2013). Although, several studies have been conducted regarding the spatial variability, especially in the soil-plant relationship, they have not reached the appropriate dissemination among technicians and engineers in agriculture.
Information regarding agricultural production are fairly disclosed, but little is known about their spatial behavior. Some teaching characterizations as "production environment” are constantly recommended in the agricultural sector, but they are also too subjective to who set the criteria, evaluation and production components (Silva, 2013).
In the quest of trying to understand and characterize the spatial distribution of production variables, establishing best parameters and criteria to classify "production environments", projects and research are needed so that they can contribute and assist agronomic practices and decisions.
Further studies regarding the spatial variability of physical, chemical and biological soil attributes are necessary since the management of agricultural practices depends on this variability, with direct impact on agricultural yield and on the environment. It seems to be the most elaborate way to understand the production of variables related to the soil-plant system. Knowledge of these variations is essential to the survey and classification of areas with productive potential, assessment of their fertility, development of appropriate systems of sampling, experimental design and definitions of appropriate management practices and recovery of agricultural areas. The number of samples required to represent the variability of the field has been a subject of discussion since at least, 1920 (Linsley and Bauer, 1929).
Systemic sampling is suggested by many researchers as the most widely used method to prove a field (Peck and Nelsted, 1973). Wisconsin research has shown that the sampling density needed depends on the variability of the field, but generally recommends a grid fitting of 200 m, depending on historical fertility and management of the soil (Wollenhaupt et al., 1994). Regular grid samplings are typically used in soil sampling processes for the development of fertility maps and located fertilization, but samples may also be collected and used at different systematic strategies. An alternative to grid soil sampling is management zone sampling (also called directed or smart sampling). Nowadays, management zones are established using a variety of resources and/or datasets. This includes soil surveys, previous yield data, remote sensing imagery, landscape/topography, elevation, electrical conductivity, and/or previous knowledge of field characteristics (Thompson et al., 2004; Gelderman et al., 2006; Agricultural Research and Extension Council of Alberta, 2010). Franzen (2011) showed better adjustment in 1 acre grid sampling.
Therefore, this paper aimed to evaluate the soil spatial distribution and behavior of chemical attributes calcium, magnesium and potassium, providing subsidies for management of sugar cane crop area.
Characterization of the study area
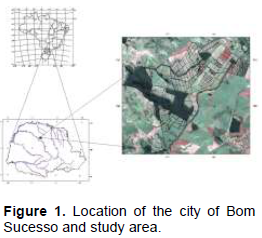
The area chosen for the studies is located in Bom Sucesso, northwest of Parana State, Brazil, between the coordinates 23° 39.890’ S and 51° 46.558’ W. The city of Bom Sucesso (Figure 1), founded in 1954, has a total area of 323 km2 and an average altitude of 580 m with altimetry as reference, the tide gauge of Imbituba.
Geology
The study area is located in the Serra Geral Formation belonging to the São Bento group, which appears in about 53% of the territory of Paraná (Leinz and Amaral, 1987). This formation consists predominantly of successive spills of toleithic basalts and, secondarily, by fine sandstones to interthreshold siltstones and breccias in continuous beds with varying thickness, and very rarely by small interleaved silt-sandy dykes (Gimenez Filho, 1993). These spills are cut by dykes and diaphragm sills with ophthalmic texture, having as essential minerals andesine and pigeonite feldspars, as well as potassic feldspars, chlorites, serpentines and quartz, and small portions of other minerals. Magnetite and ilmenite predominate in opaque minerals.
Data analysis
To perform the laboratory activities, the following computer programs were used: Excel (Microsoft), for assembly of data sheets; the System for Georeferenced Information Processing (SPRING version 5.2.2, 2012) to prepare the database and all the manipulation of geo-referenced information; VARIOWIN2.2 Pannatier (1996), to carry out the spatial dependence analysis and STATISTICA 8 (Statsoft) for descriptive statistics and geostatistical module/validation SPRING 5.2.2 (INPE) for the interpolation of soil attributes by kriging interpolation.
The work was initiated by map preparation CAD system in AutoCAD software and worked in the cartographic information system to enter it in a database. This map has been reconfigured within the geocoded Information Processing System - SPRING developed by INPE. According Câmara et al. (1998), SPRING is a state of the art GIS system designed for object-oriented programming, with multiple functions and algorithms for database processing georeferenced.
Sample collection
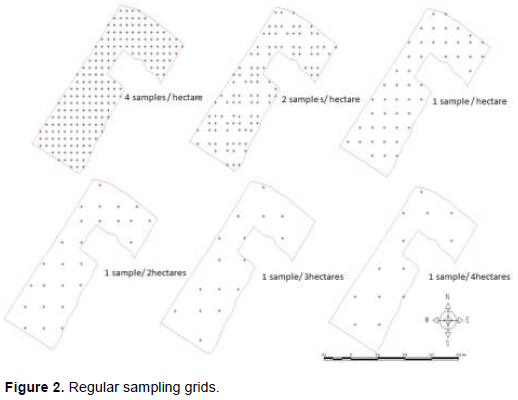
For sampling of soil, a regular grid was established (Figure 2) sampling distance of 50 in 50 m as a base grid (reference), comprising four samples per hectare in an area of 51.14 ha. Other grids were established by this decreasing the amount of sample points (Nanni, 2011): 70.8 x 70.8 m comprising 2 (two) samples per hectare; 100 x 100 m comprises one sample per hectare; 141.4 x 141.4 m comprising a sample every two acres; 173.3 x 173.3 m comprising a sample every three acres; 200 x 200 m a sample comprising the four acres (Figure 2).
Sampling was collected in depth 00-0.20 cm in the surface of soil horizon for 50x50 m grid one sample per point without subsample. The depth of 00-0.20 cm was chosen for analysis because it was considered the most effective depth explored by the roots of the culture of cane sugar, and represents the diagnostic horizon correction/fertility.
For the collection of soil samples, the points were located by GPS system, facilitating the process of exploration, as provided to coordinate all the locations of the points to be visited, reducing the possibility of errors and allowing the possibility of returning to the same new point collections for confirmation.
The samples were placed in plastic bags, identified and taken to the Rural Agronomy Laboratory Maringa for macro nutrient chemical analysis. The chemical elements analyzed were: calcium and magnesium (Ca + Mg) and potassium (K), using the methods developed by Embrapa (2010).
In order to analyze and compare the spatial distribution of attributes: Ca + Mg and K, showed the best regular sampling grid (50, 70.8, 100, 141.4, 173.3 and 200 m) from the set that best characterizes the spatial distribution of the attribute in the soil which faithfully portrays local conditions.
Statistical analysis
For each chemical attributes of the studied soil, descriptive statistical analysis and the comparison of average by the Tukey test at 5% significance were done, with the aid of the Statistica software. Descriptive statistics calculated the mean, median, minimum, maximum, variance, asymmetry, kurtosis, the coefficient of variation (CV), standard deviation (SD) and the type of distribution. The Lilliefors test (P-value) at 5% probability was used to test the hypothesis of normality.
The Ca + Mg and K attributes were normally distributed in all regular grids sampling, being an important feature for later perform geostatistical study. It was, in this work, that the data meets the intrinsic stationarity condition that occurs when hope (E) Z (xi) is constant, μ (x) = μ and the variance (VAR) of the increment between Z (xi) and Z (xi + h) is finite and independent of the position in space, depending only on the separation distance h, since the data is symmetrical with respect to normal Gonçalves et al. (1997), Vieira et al, (1997) and Webster and Oliver (1990). This level of stationarity of data is sufficient for the application of geostatistics.
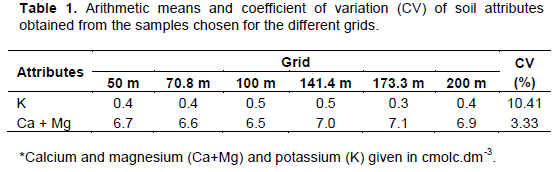
To better understand the distribution of attributes in different sampling grids evaluated in the study area, the values of the arithmetic mean of the attributes for each grade were established, as shown in Table 1. According to EMBRAPA et al. (2010), the mean values of soil chemical properties in the layer 00 to 0.20 cm (Table 1), was used to classify their fertility as high for Ca + Mg and K,
According Vanni et al. (1998), if the coefficient of variation is less than 35%, the data series can be regarded as a homogeneous medium and can present significant, can be used as representative of the series from which it was obtained.
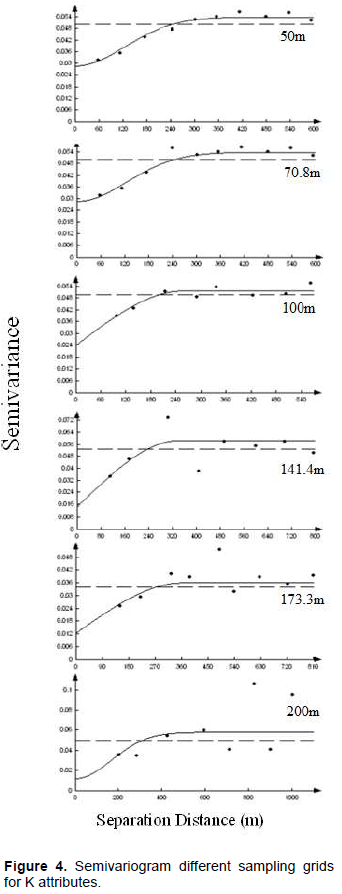
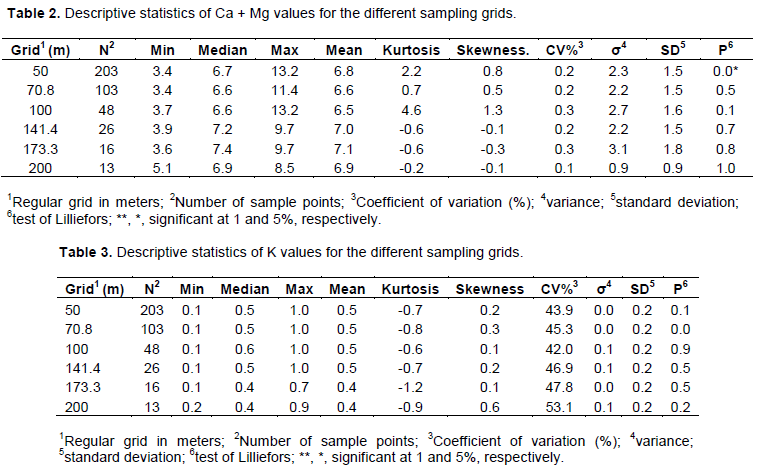
For all the regular grids, CV's presented lower values probably due to the same soil management and cultural practices (fertilization) established for the area. The results of the descriptive analysis of soil chemical properties are shown in Tables 2 and 3 separately. The application of the normality test to the data set reveals that the attributes: Ca + Mg and K normal distribution. Analyzing the results obtained in the descriptive statistics (Table 2), it is observed that the values of Ca + Mg and K demonstrated and maintained low CV in all the regular grids sampling (<12%), according to the criteria proposed by Warrick and Nielsen et al. (1980). The attribute K (Table 3) also showed normal distribution, CV and SD low on different grids, given normal, as reported by Nanni et al. (2011). However, different results were obtained by Cavalcante et al. (2007). The variogram analysis indicated that soil attributes analyzed (Figures 3 and 4) separately in different sampling regular grids spatial correlation, except for Ca + Mg attribute in 200 m grid.


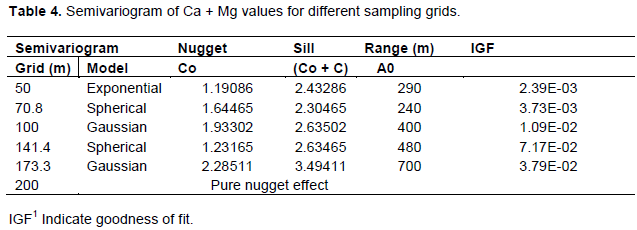
The Ca + Mg attribute maintained a greater distance between the nugget and semivance values, with moderate spatial dependence structure, with a range of about 290-700 m in the sampling grid (Table 4). Values of Ca + Mg (200 m grid) showed that the data sets in grids of lower sample intensities tend to behave where spatial dependence cannot be quantified, and the information that best represents the data set in these regular grids is the arithmetic mean, as also observed by Souza et al. (2014).
The attribute Ca + Mg showed moderate spatial dependence structure, with reach corresponding to the zone of influence of the spatial dependence around 700 m in sampling grids (Table 4).
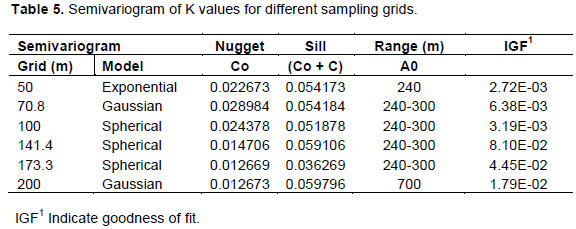
The K attribute presented structure of the semivariogram with moderate spatial dependence in all established regular grids (Table 5), in agreement with results obtained by Salviano et al. (1998) and Souza et al. (1998).
The K presented a range around 240-700 m, with spatial continuity greater than the other attributes of the study area. Some authors attribute the spatial variability of Ca + Mg and K to their soil mobility. In this case, this condition is probably due to the form of fertilizer distribution (K) which, in the case of sugarcane, occurs in the planting line, that is, in a localized way, stabilizing the values with the Ca and Mg, which is distributed over a total area.
The semivariogram of Ca + Mg and K, spherical model best fitted the experimental semivariograms for the soil chemistry parameters measured. Similar results were found by Barbieri et al. (2008). The range of values for the Semivariograms play a significant role in determining the limit of the spatial dependence can also be indicative of the interval between soil map units (Grego and Vieira, 2005), and moderate spatial dependence of the class can be attributed to intrinsic factors (mineralogy and texture), whereas extrinsic (soil management) is attributed to weak dependence.
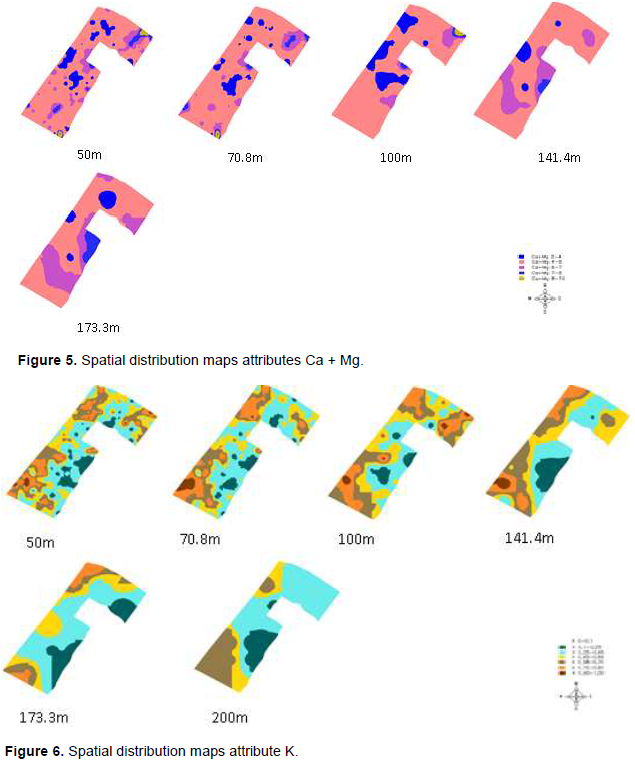
The moderate spatial dependence would be due to soil homogenization, confirmed this hypothesis when analyzing the range of variation of the chemical attributes Ca + Mg and K that have low CV, a similar situation was observed by Cavalcante et al. (2007) studying the use and management systems soil. Spatial distribution maps of the chemical attributes Ca + Mg and K were generated from the kriging interpolation bars that had spatial dependence Figures 5 and 6. Analyzing the results obtained the details of patterns of map variations become increasingly degraded as the decrease in sampling intensity. Similar results were observed by Kerry and Oliver (2008) and Nanni et al. (2010, 2011).
When using kriging with variograms calculated from much spaced samples, as in grids above 1 sample per 2 ha, thematic maps of the soil used to determine the classes of the attribute in space do not reflect the main patterns of variation present (Kerry and Oliver, 2008).
Descriptive statistics of the study area attributes analyzed together with different regular grids sampling showed chemical homogeneity, in other words, if the option is the central tendency, all the grids showed very similar results, regardless of the sampling rate. In the semivariogram analyzes, all the attributes presented spatial dependence: Ca + Mg and K with exceptions: Ca + Mg 200 m grid.
The results obtained in separately semivariogram for each attribute in their regular grids sampling established regular grid with lower density samples, the attribute can be characterized in a satisfactory way and representative geostatistics: Ca + Mg regular grids of 173.3 m (1 sample in 3 hectares) and K 173.3 m regular grids or 200 m (1 sample in 3 hectares or 1 sample in 4 hectares).
The authors have not declared any conflict of interests.
The authors thank CNPq (National Council for Scientific and Technological Development) and CAPES (Coordination of Improvement of Higher Education Personnel) for research grants awarded; and the reviewers and editors for their valuable comments and contributions to improve the manuscript.
REFERENCES
|
Agricultural Research and Extension Council of Alberta (2010). "Precision Farming and Variable Rate Technology: A Resource Guide."
|
|
|
|
Barbieri DM, Marques Júnior J, Pereira GT (2008). Variabilidade espacial de atributos químicos de um Argissolo para aplicação de insumos à taxa variável em diferentes formas de relevo. Engenharia Agrícola 28:645-653.
Crossref
|
|
|
|
|
Câmara G, Davis C, Monteiro AMV (1998). Conceitos Básicos em Ciência da Geoinformação. Disponível em:
View
|
|
|
|
|
Cavalcante EGS, Alves MC, Souza ZM, Pereira GT (2007). Variabilidade espacial de atributos químicos do solo sob diferentes usos e manejos. Rev. Bras. Ciência do Solo 31(6):1329-1339.
Crossref
|
|
|
|
|
EMBRAPA (2010). Centro nacional de Pesquisa de Solos. Manual de métodos de análise de solo. 2. ed. Rio de Janeiro 212 p.
|
|
|
|
|
Franzen DW (2011). "Collecting and Analyzing Soil Spatial Information Using Kriging and Inverse Distance." Chap. 4 in GIS Applications in Agriculture, edited by David E. Clay and John F. Shanahan, Boca Raton, FL: CRC Press pp61-80.
Crossref
|
|
|
|
|
Gimenez Filho AG (1993). Evolução do Complexo Três Córregos a noroeste de Apiaí - SP. São Paulo, Dissertação (Mestrado) - Instituto de Geociências, Universidade de São Paulo. 118 p.
|
|
|
|
|
Gonçalves ACA (1997). Variabilidade espacial de propriedades físicas do solo para fins de manejo da irrigação. Piracicaba. 118p. Tese (Doutorado) - Escola Superior de Agricultura "Luiz de Queiroz", Universidade de São Paulo.
|
|
|
|
|
Grego RG, Vieira SR (2005). Variabilidade espacial de propriedades físicas do solo em uma parcela experimental. Rev. Bras. Ciência do Solo 29(2):169-177.
Crossref
|
|
|
|
|
Gelderman R, Gerwing JR, Reitsma K (2006). "Recommended Soil Sampling Methods for South Dakota." College of Agricultue and Biological Life Sciences, South Dakota State University.
|
|
|
|
|
Linsley CM, Bauer FC (1929). Test your soil for acidity. Univ. of Il. Col. of Ag. and Ag. Exp. Sta. Circ. P 346.
|
|
|
|
|
Leinz V, Amaral SE (1987). Geologia Geral. São Paulo: Companhia Editora Nacional; 10ªed. 397p.
|
|
|
|
|
Nanni MR, Povh FP, Demattê JAM, DE Oliveira RB, Chicati ML, Cezar E (2011). Optimum size in grid soil sampling for variable rate application in site-specific management. Sci. Agric. 68(3):386-392.
Crossref
|
|
|
|
|
Pannatier Y (1996). Variowin: software for spatial data analysis in 2D. New York: Springer-Verlag 90 p.
Crossref
|
|
|
|
|
Peck TR, SW Melsted (1973). Field sampling for soil testing. In:Soil Testing and Plant Analysis. Second edition. SSSA, Madison, WI pp. 67-75.
|
|
|
|
|
Salviano AAC, Vieira SR, Sparovek G (1998). Variabilidade espacial de atributos de solo e de Crotalaria juncea L. em área severamente erodida. Rev. Bras. Ciênc. Solo 22(1):115-122.
Crossref
|
|
|
|
|
Silva AA (2013). Estudo de diferentes grades regulares de amostragem para avaliação de atributos químicos do solo e mapas de fertilidade em área de cultivo de cana de açucar. Maringá-PR. 5 p. Dissertação de mestrado – Universidade Estadual de Maringá.
|
|
|
|
|
Souza LS, Cogo NP, Viera SR (1998). Variabilidade de fósforo, potássio e matéria orgânica no solo, em relação a sistemas de manejo. Rev. Bras. Ciênc. Solo 22(3):77-86.
Crossref
|
|
|
|
|
Souza ZM, Souza GS, Marques Junior J, Pereira GT (2014). Number of samples in geostatistical analysis and kriging maps of soil properties. Ciênc. Rural Santa Maria 44(2):261-268.
Crossref
|
|
|
|
|
Kerry R, Oliver MA (2008). Determining nugget:sill ratios of standardized variograms from aerial photographs to krige sparse soil data. Precision Agric. Netherlands 9(1-2):33-56.
Crossref
|
|
|
|
|
Thompson AN, Shaw JN, Mask PL, Touchton JT, Rickman D (2004). Soil Sampling Techniques for Alabama, USA Grain Fields. Precision Agric. 5(4):345-358.
Crossref
|
|
|
|
|
Vanni SM (1998). Modelos de regressão: Estatística aplicada. SãoPaulo, Legmar Informática 177 p.
|
|
|
|
|
Vieira SR (1997). Variabilidade espacial de argila, silte e atributos químicos em uma parcela experimental de um latossolo roxo de Campinas (SP). Bragantia 56(1):1-17.
Crossref
|
|
|
|
|
Warrick AW, Nielsen DR (1980). Spatial variability of same physical properties of the soil. In: Hill, D. ed. Aplications of soil physics, New York: Academic Press Cap. 13:319-344.
|
|
|
|
|
Webster R, Oliver MA (1990). Statistical methods in soil and land resource survey. Oxford: Oxford University Press 316 p.
|
|
|
|
|
Wollenhaupt NC, Wolkowski RP, Clayton MK (1994). Mapping soil test phosphorus and potassium for variable-rate fertilizer application. J. Prod. Agric. 7:441-448.
Crossref
|
|