Full Length Research Paper
ABSTRACT
Climate change poses a major threat to agricultural production and food security in Ethiopia. Temperature rise and variability in rainfall patterns have had serious consequences on crop and livestock production. Climate-Smart Agriculture (CSA) is one of the solutions that simultaneously address the issues of food security, climate change and agricultural productivity. The objective of this study was to examine trends and variability of temperature and rainfall, identify local CSA practices and their implications to food security. The study was conducted using mixed methods approaches, in which 368 randomly selected households were surveyed, 10 key informants were interviewed, and 6 focus group discussions participants were held. The analysis was based on survey data and a binary logistic regression model was used. Findings revealed that highly adopted CSA practices were conservation agriculture, integrated soil fertility management, small scale irrigation, and improved livestock management. Factors determining CSA practices were also explored such as household size, farming system, off-farm income, access to irrigated farm, distance to market, farm size, and access to agricultural credit. It was evident that CSA practices had a great potential to solve challenges and highest implication to food security. The maximum and minimum annual temperature of the study area has increased by 0.98 and 0.46ºC while the trend of average annual temperature has increased by about 0.72ºC. Annual rainfall has increased significantly by 153.73 mm, in small rainy season (Belg) has decreased by 30.78 mm, and in main rainy season (Kiremt) has increased significantly by 120.96 mm in the past three decades. The study also concludes that a large proportion of respondents were aware of most of the practices, but adoption of CSA practices examined was very low. Therefore, as a recommendation, sensitization of farmers on reality of climate change and the need to adopt CSA practices towards reduction of adverse effect of climate change should continue. Policy and support program should focus on dissemination of CSA practices to a larger proportion of smallholder farmers.
Key words: Climate smart agriculture, climate change, food security
INTRODUCTION
Climate change is a threat to food security systems and one of biggest challenges in the 21st century (FAO, 2013). It is widely accepted that the ability to contain the pace of climate change by keeping change in temperature rise within 2°C threshold in the long run is now limited and the global population will have to deal with its consequences (IPCC, 2014). Agriculture is the backbone of the Ethiopian economy. This particular sector determines the growth of all other sectors and consequently, the whole national economy. On average, crop production makes up 60% of the sector’s outputs, whereas livestock accounts for 27% and other areas contribute 13% of the total agricultural value added. The sector is dominated by small-scale farmers who practice rain-fed mixed farming by employing traditional technology, adopting a low input and low output production system. The land tilled by the Ethiopian small-scale farmer accounts for 95% of the total area under agricultural use and these farmers are responsible for more than 90% of the total agricultural output. Agriculture accounts for 49% of GDP, 85% of exports, and 85% of employment (UNDP, 2016).
Climate smart agriculture (CSA) is an approach to guide the management of agriculture in the era of climate change. CSA aims to provide globally applicable principles on managing agriculture for food security under climate change that could provide a basis for policy support and recommendations by multilateral organizations, such as UN’s FAO. The major features of the CSA approach were developed in response to limitations in the international climate policy arena in the understanding of agriculture’s role in food security and its potential for capturing synergies between adaptation and mitigation (Lipper and Zilberman, 2018).
A study conducted by Melaku et al. (2016) at country level in Ethiopia has identified that the adoption rate of CSA practices is low. To support the facilitation for adoption, different key opportunities and challenges were identified and strategic measures were recommended. The study also indicated that there is a gap in research at local level regarding CSA considering the bio-physical, socio-economic and developmental context. These situations call for the need to conduct research at local context in order to strengthen the evidence based decisions for adoption and dissemination of improved technologies. Hence, there were insufficient empirical studies based on climate smart agriculture practices in Siyadebrina Wayu district, North Shewa, Ethiopia. So, in order to fill the research gap the objective of this study was, therefore, to identify factors affecting the adoption of CSA practices, local CSA practices, and determine trends and variability of temperature and rainfall in the study area.
CSA provides tools for assessing different technologies and practices implications to national development and food security objectives under the site-specific effects of climate change. The overall aim of CSA is to support efforts from the local to global levels for sustainably using agricultural systems to achieve food security for all people at all times, integrating necessary adaptation and capturing potential mitigation. Three objectives are defined for achieving this aim: sustainably increasing agricultural productivity to support equitable increases in incomes, food security and development; adapting and building resilience to climate change from the farm to national levels; and developing opportunities to reduce GHG emissions from agriculture compared with past trends (FAO - UN, 2013).
MATERIALS AND METHODS
Description of the study area
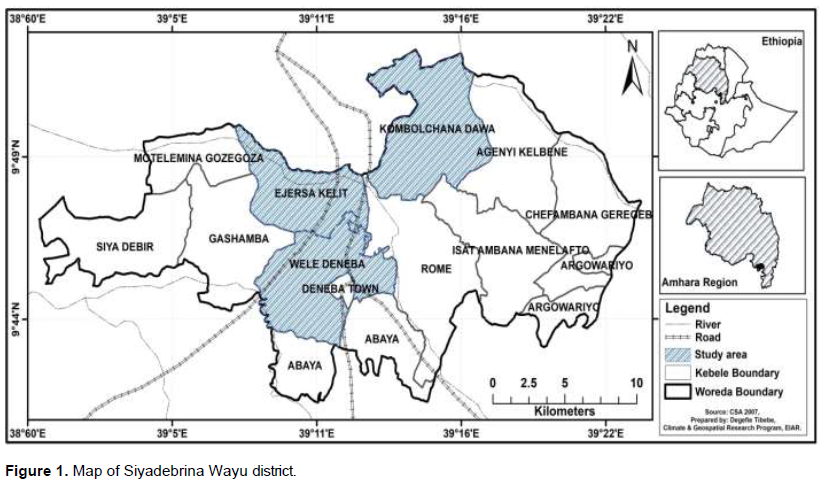
The study was conducted in smallholder farmers in Amhara National Regional State (ANRS) of Ethiopia, North Shewa zone, Siyadebrina Wayu district. It is far about 175 km away from Addis Ababa, and located between 9° 42’ to 9° 53’ N latitude and 39° 08’ to 39° 17’ E longitude (CSA, 2007). It has 13 rural kebeles and one urban center (Deneba town). Based on CSA (2013) population projection of Ethiopia for all regions at district level from 2014 – 2017 report, this district has a total population 73,166 of whom 37,397 (51.11%) are males; 35,769 (48.89%) are females; and 7,884 or 10.78% are urban inhabitants (Figure 1).
Approach and design
In this study, mixed approach was followed to triangulate the interpretation of data and results to enhance the reliability and validity of findings. In qualitative approach, in-depth key informant interview (KII) guide, focus group discussions (FGD) guide, and field observations were tools for data collection. In the quantitative approach, household survey on the basis of structured questionnaire interview was conducted by researcher and enumerators. Explanatory research design was appropriately applied in this research. The binary logistic regression model as an explanatory research design was used to determine the magnitude of relationship among the dependent and independent variables under study.
Sampling and sample size determination
Purposive sampling technique was employed to select the district and the three targeted study kebeles based on their crop and livestock production potential area to show the climate change variability and effect of CSA practices on food security. These kebeles are Ejersa Kubeti, Wele Deneba, and Kombolchana Dawa. The sampling frame was 4,569 in the three kebeles. Yamane (1967) provides a simplified formula to calculate the sample size. Thereafter, we applied it and determined the number of sample households to be about 368. The respondents were selected by simple random sampling method.
Data sources and collection tools
Primary information were gathered by using different approaches, that includes a household survey, an interview with key informants, focused group discussion and field observations. Secondary data were collected from existing sources that are, intensive desk review of published and unpublished literatures such as peer reviewed journals, books, conference paper, dissertations and research reports. Comprehensive and realistic numerical data, ideas, viewpoints, concepts, definitions, arguments and suggestions were collected so as to enhance the analytical frameworks, and come up with profound research outputs and thoughtful recommendations. The research employed household survey questionnaire, FGD, KIIs and field observation as a tools.
Statistical data analysis
Descriptive statistics which includes frequency distribution, percentage, mean, standard deviation and cross-tabulation were used to summarize and presents demographic, socio-economic and institutional factors. Binary logistic regression model was used to identify and interpret main socio-economic factors affecting adoption of climate smart agriculture practices and its implication to food security in the study area. The model specification is a generalized linear model and can be written as:
Logit (π(xi )) = log (π(xi )/1 − π(xi )) = β0 + β1x1i + . . . + βpxpi or
ln (p/1-p) = β0 + β1x1 + β2x2 + . . . + βpxp
Where, p = probability of event occurring, p/1-p = odds ratio
Description of variables
In this study, the response (dependent variable) Y represents the CSA practices. Farmers perceived that the adopted CSA practices contributed to both farm income and household food availability. It is measured as a dummy variable, a numeric value 1, if number of farmers adopts CSA, and, if no adopters. The explanatory (independent variables) in the regression model are hypothesized to affect the smallholder farmers’ adoption of CSA practices and combined effects of various factors such as household demographic characteristics, socio-economic characteristics, and institutional characteristics. Based on the review of related literatures, and past research findings, fourteen potential explanatory variables (sex of the household head (HH), age of the HH, household size, education, farm size, farming experience, farming system, access to irrigation, farm income, off-farm income, access to credit, distance to market, and access to weather information) were considered in this study and examined for their effect on adoption.
RESULTS AND DISCUSSION
Socio-economic and demographic characteristics of the households
The socio-economic and demographic status of households in three kebeles was presented in Table 1. In this study, out of the 368 respondents in both kebeles, 35 (9.5%) were female-headed and 333 (90.5%) were male-headed households. Therefore, male-headed households were in a better position to pull more labor force than the female-headed ones and they also made decisions on farming activities. Age determine CSA practices and adoption rate among the farming households. Accordingly, the respondents age was classified based on the Santrock (2011) age group classification from 20-40 young, 41-60 adult and >60 are elders. In this regard, the age distribution of the respondents ranged from 21- 65 years and the average age was 44 years. However, over 90% of the respondents were still in active age group between 20-60 years. So, productive age groups are higher than the non-productive age groups, the probability of a household to be in shortage of food would be less, provided that the area provides good working atmosphere and production potential.
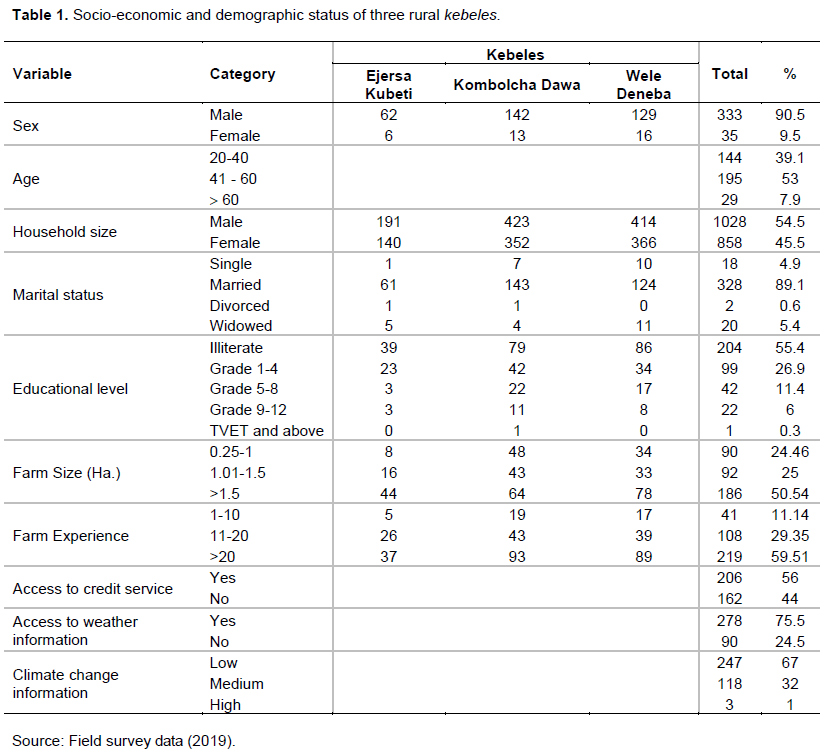
The average household size of the respondents is 5 and the absolute size of the respondents ranged from 1-12 members. The marital status of the household head showed that over 80% of the respondents were married and in terms of religious composition, over 90% was Orthodox Christianity. The educational level showed that 55.4% of the respondents from both kebeles had never attained any level of education, 44.3% of the respondents have attained primary and secondary school and almost 0.3% has attended Technical, Vocational and Educational Training (TVET) and above. Thus, this indicates that most of smallholder farmers have appreciable formal knowledge to understand and implement climate-smart agricultural technologies promoted in the area as compared to illiterate ones. The educational level of farmers has a direct link with the perception to climate variability. Farmers with relatively higher education levels have opportunities to get information from schools, environmental clubs and other sources of information. Thus, farmers with higher educational level have better perception than farmers with lower levels of education.
The data collected from both kebeles indicated that about 50.5% of the respondents had > 1.5 ha of farmland and 59.5% of the respondents have >20 years in farm experience in the study area. The average farm experience of the respondents is 23 years and the experience ranged from 2-45 years. The result also showed that 56% of the respondents obtained access to credit service from various sources. Access to credit services enhances the probability of a smallholder farmer to adopt CSA practices that improve food security and income. This result related with the findings of Amao and Ayantoye (2015), who proved that access to credit, can be used to expand farm production through creating the financial capacity to purchase and use of modern improved agricultural inputs.
About 75.5% of the respondents had access to weather information and 67% of the respondents have low climate change information in the study area. According to Kalungu et al, (2013) farmers’ perception on climate changes and its impacts on the agricultural production have resulted in the adjustment of agricultural calendar and adoption of different adaptation strategies. The perception of household’s climate change information influenced different economic and livelihood attributes.
Reducing of crop production and livestock, drought, high temperature, high or low rainfall, food insecurity, disturbance of eco-system, crop pests and diseases, lack of awareness on agricultural practices and increase in land degradation were factors influencing the climate change in the study area.
Climate Smart Agriculture (CSA) practices in the study area
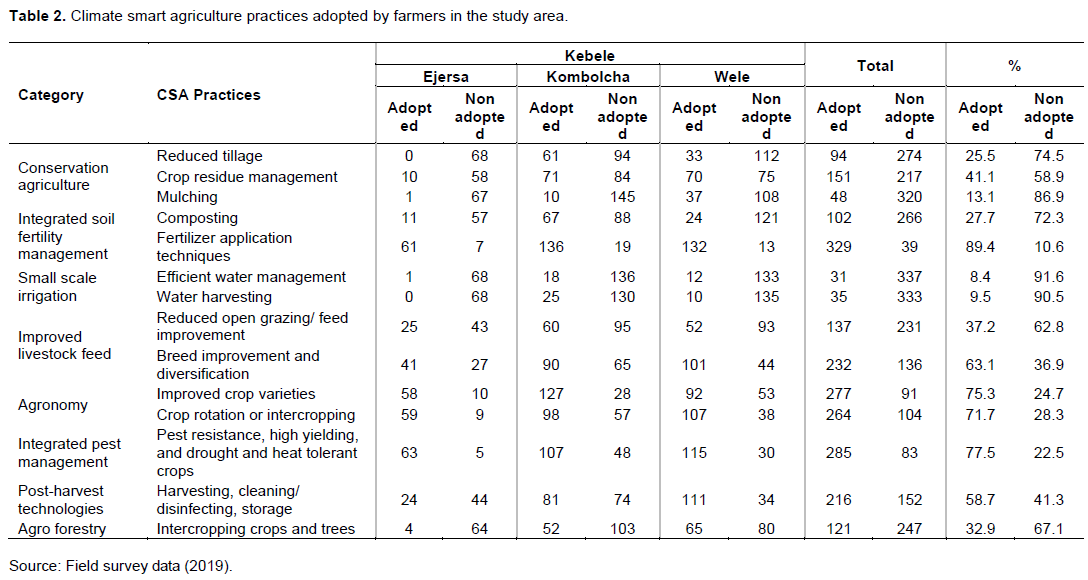
Data were analyzed using descriptive statistics to identify local climate smart agriculture practices in the study area including mean and percentage. According to Saguye (2017), the following criteria were used to rank the rate of adoption based on the percentage of the respondents in the total sample. Adoption rate greater than 70% was ranked very high, 60 to 70% high, 50 to 59% fairly high, 40 to 49% fairly low, and below 40% very low. According to Branca et al. (2013), FAO (2016) and Saguye (2017), the following climate smart agricultural practices were categorized: agronomic practices are (improved seed varieties, crop rotation, intercropping, and cover crop); integrated soil fertility management (composting, organic fertilizer and efficient use of inorganic fertilizer); conservation agriculture (tillage and residue management); irrigation (water management, bunds, terracing, contouring, and water harvesting); integrated pest management (blend of cultural, biological and chemical control); agro-forestry (intercropping crops and trees, live fencing); post-harvest management (harvesting, cleaning or disinfecting, storage); improved livestock feed (grazing, feed improvement, breed improvement).
Climate smart agriculture practices adopted by farmers in the study area presented in Table 2. The results of the study revealed that CSA practices such as fertilizer application techniques (89.4%), livestock breed improvement and diversification (63.1%), improved crop varieties (75.3%), crop rotation or intercropping with cereals and legumes (71.7%), pest resistance, high yielding, and drought and heat tolerant crops (77.5%) were highly adopted. Post-harvest technology practices (58.7%) were also fairly adopted while other components of CSA practices conservation tillage (25.5%), crop residue management (41.1%), mulching (13.1%), compost and manure management (27.7%), water management (8.4%), water harvesting (9.5%), improved livestock feed and feeding practices (37.2%), and agro-forestry (32.9%) were low. Generally, farmers’ adoption rates of the climate smart agricultural practices in the study area were very low. Key informants and focus groups reported that feed shortage occurs during the period between February to May and conservation feeding is one of the feeding strategy used to reduce the shortage during this time. Conservation and concentrate feeding is common and adopted practice by most farmers mainly during feed shortage. This finding is in line with CSA (2017) who reported that identified livestock feed resources in Ethiopia are mainly obtained from natural and improved pastures, feed conservation (hay making, silage making, and crop residue), forage crops, agro-industrial by-products and non-conventional feeds.
Therefore, based on this analysis, the local CSA practices were identified such as crop rotation, fertilizer application, popularization of new technology crop varieties, using pest resistance, high yielding, tolerant to drought and short season varieties; also, breed improvement and post-harvest technologies are highly adopted in the study area.
In a similar way, Aweke (2017) finds that adoption levels of some CSA practices and technologies, such as conservation agriculture and agroforestry, among smallholder farmers remain low. FAO (2016) also indicated in the broader Ethiopian context, CSA practices and technologies are being implemented within the framework of integrated watershed management, which incorporates a broad range of practices in crop and livestock production including agroforestry, crop rotation and intercropping, soil and water conservation. In terms of adoption, most of the CSA practices and technologies identified have low to medium on-farm adoption rates, despite their potential benefits to adaptation, productivity increase and mitigation efforts.
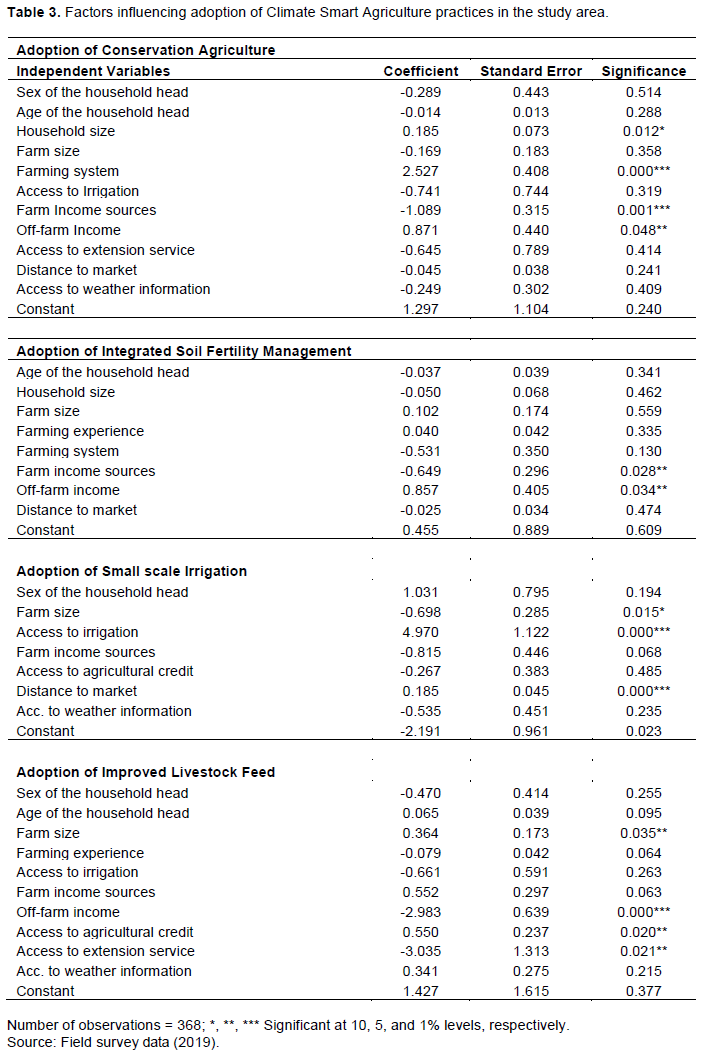
Factors influencing adoption of Climate Smart Agriculture practices
The results of binary logistic regression model as shown in Table 3, four variables (household size, farming system, farm income source and off-farm income) are statistically significant (p£0.05) and influences the adoption of conservation agriculture. A farm income source is a factor that adversely affects adoption of conservation agriculture, while household size, farming system, and off-farm income have positive relationship. Regarding adoption of integrated soil fertility management, farm income source and off-farm income are statistically significant variables at p= 0.028, and 0.034 levels, respectively. Farm income sources are factors that adversely affect integrated soil fertility management, while off-farm income has positive relationship. In another case, factors that affect the adoption of small scale irrigation are farm size, access to irrigation, and distance to market and they are statistically significant at p=0.015, 0.000, and 0.000 levels, respectively. A farm size is a factor that adversely affects adoption of small scale irrigation, while access to irrigation and distance to market variables has positive relationship. Factors that influence adoption of improved livestock feed are farm size, off-farm income, access to agricultural credit, and access to extension services, and they are statistically significant at p=0.035, 0.000, 0.020, and 0.021 levels, respectively. Off-farm income and access to extension service are factors that adversely affect the adoption of improved livestock feed, while farm size and access to agricultural credit have positive relationship, and significantly enhance the adoption of improved livestock feed.
In summary, the major factors that influence the adoption of CSA practices were identified in this study. The results showed that there were significant differences with regards to explanatory variables such as household size, farming system, farm income source, off-farm income, farm size, access to irrigated farm, distance to market, access to extension service, and access to agricultural credit. Factors such as household size, farming system, off-farm income, access to irrigated farm, distance to market, farm size, an access to agricultural credit have positive relationship; and farm income source, off-farm income, and access to extension service have negative relationship.
Therefore, crop and livestock production would have higher productivity that factors of household size, farming system, off-farm income, access to irrigated farm, distance to market, farm size, and access to agricultural credit are more likely to adopt climate smart agriculture practices and its implication to food security in the study area.
Analysis of climate variability
Ethiopian agriculture is highly exposed to climate variability, and in particular, to drought and related heat stress. There are close correlations between changes in rainfall, agricultural productivity, GDP and broader human well-being. Global circulation models predict an increase in temperature of 1.7 to 2.1°C by 2050 (Collins et al., 2013). The combination of higher temperatures and more unpredictable rains has negative implications for the length and reliability of the growing season (World Bank, 2011).
Trends of temperature
According to the National Meteorological Agency (2007) in Ethiopia, climate variability and change in the country is mainly manifested through the variability and decreasing trend in rainfall and increasing trend in temperature. Besides, rainfall and temperature patterns show large regional differences. The Ethiopian climate is also characterized by a history of climate extremes, such as drought and flood, and increasing and decreasing trends in temperature and precipitation, respectively. The average annual minimum temperature over the country has increased by about 0.37°C, whereas, average annual maximum temperature has increased by about 0.1°C every decade (NMA, 2007).
Temperature distribution in the study area was characterized by a general trend of increased and annual variability. Temperature is one of the elements that determine weather conditions as well as climate of an area. It is recorded as maximum and minimum daily, monthly and annual temperatures. According to the data obtained from NMA (2018), the maximum annual average temperature ranges between 20.76 and 22.09ºC and the minimum annual average temperature ranges between 8.89 and 10.09ºC in the past three decades, while the average temperature of the district under study ranges between 14.80 and 16.0ºC. The annual range of temperature ranges between 11.49 and 12.64ºC showing the existence of high variability of temperature in the study area. The warmest year was in 2013 (22.09ºC), while the coldest year was in 1990 (8.89°C).
Generally, the trend of maximum and minimum temperature shows slight increment from year to year in between 1987-2017. As indicated in Figure 2, the maximum and minimum annual temperature of the study area has increased by 0.98 and 0.46ºC in the past three decades respectively. On the other hand, the result showed that the trend of average annual temperature has increased by about 0.72ºC in the past three decades.
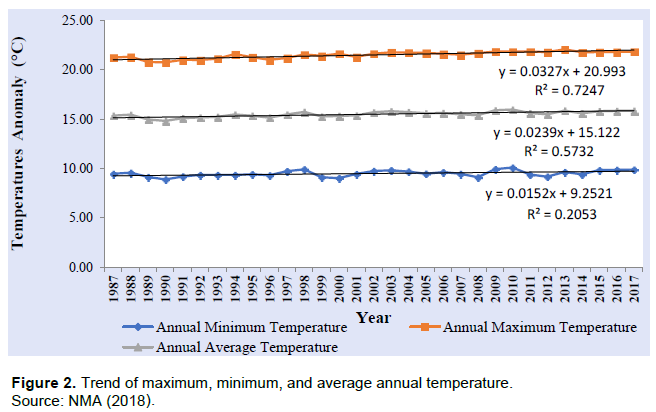
Annual maximum/day time temperature has increased faster than the minimum temperature in the study site. The highest minimum temperature increment was observed in the first decades whereas the highest maximum temperature increment took place in the third decade. Therefore, the effect of increased temperature will depend on the crop's optimal temperature for growth and reproduction. In some areas, warming may benefit the types of crops that are typically planted there, or allow farmers to shift to crops that are currently grown in warmer areas. However, in the study area, factors that affect agricultural production, such as changes in farming practices and yields will decline.
Trends of annual and seasonal rainfall
According to NMA (2015), there are three seasons in Ethiopia; Belg (spring), Kiremt (summer), and Bega (winter). Belg (February-May) is the small rainy season in Ethiopia. Much of the northeastern, central southern, eastern and south eastern parts of the country receive considerable amount of rainfall during this season. Kiremt (June-September) is the main rainfall season for most parts of the country except for the lowlands of southern and south eastern Ethiopia. Bega (October-January) is mostly a dry season for most parts of the country except for southwestern as well as the lowlands of south and southeast Ethiopia. The annual rainfall of the study area ranges between 735.1 mm as a minimum, and 1187.1 mm as a maximum, for the past 30 years. Data analysis result shows annual rainfall has an increasing and decreasing trend in the past three decades. The trend of Annual, Belg, and Kiremt rainfall of the study area is indicated in Figure 3. Annual rainfall has increased significantly by 153.73 mm; in small rainy season (Belg) rainfall has decreased by 30.78 mm and insignificant; and in main rainy season (Kiremt), rainfall has increased significantly by 120.96 mm in the past three decades. In the first decade, the study area annual rainfall, main rainy season rainfall and small rainy season rainfall shows very high decreased trend whereas a significant increased trend of annual rainfall, and main rainy season rainfall took place in the third decade.
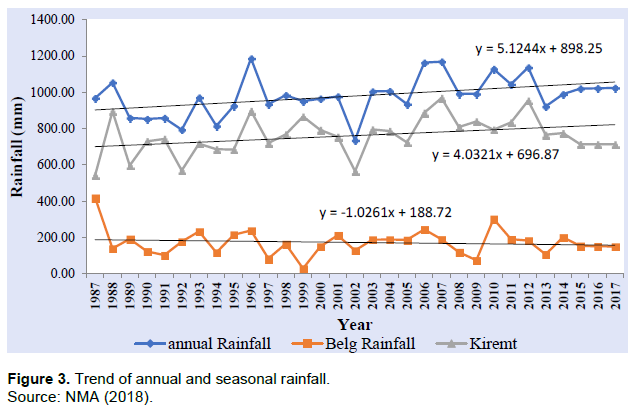
The long term annual and seasonal rainfall variability (1987-2017) shows that average mean for annual rainfall, small rainy season (Belg) rainfall, and main rainy season (Kiremt) rainfall was computed as 980.24, 172.30, and 761.38 mm with standard deviation of 108.82, 72.54 and 106.16, respectively. Similarly, the coefficient of variation in Annual, Belg, and Kiremet season rainfall is 11.10, 42.10, and 13.94% respectively, which means this much amount of rainfall is deviated from the mean. Ethiopian agriculture is mostly rain-fed, whereas inter-annual and seasonal rainfall variability is high and drought is frequent in many parts of the country. Rainfall variability has historically been a major cause of food insecurity and famine in the country (Bewket, 2009). Therefore, changes in rainfall conditions have a direct and immediate impact on the performance of agricultural sector as well as in the country’s total GDP (FAO, 2006).
The precipitation concentration index (PCI) was used to calculate rainfall variability at annual scale across different parts of the world. To analyze climate variability, PCI and Coefficient of variation were used highly in Ethiopia (Seleshi and Zanke, 2004). The coefficient of variation (CV) can be calculated by dividing the standard deviation to the long term mean precipitation (NMA, 1996). Precipitation was characterized by a typical annual pattern with low rainfall totals during Belg and Bega seasons and high during Kiremt season in the study area. According to Oliver (1980), analysis of rainfall variability in the study area shows the precipitation concentration index (PCI) for annual scale is greater than 20 (21.07) which indicates a strong irregularity (highly variable) distribution in annual rainfall. According to NMA (1996) classification of the rainfall variability of an area, the coefficient of variation in annual rainfall variability is less than 20% (11.10%) which shows less variation. The coefficient of variability in Belg season rainfall is greater than 30% (42.10%) which indicates highly variable, and in Kiremt season rainfall is less than 20% (13.94%) indicating less variable in the past three decades.
CSA implications to food security
There is a consensus that climate change and agriculture have cause and effect relationships. Increases in the frequency and intensity of extreme events such as drought, rainfall intensity, hotness, and coldness have the potential to adversely affect agricultural production and the food system, worsen food insecurity and deepen poverty. Agricultural activities such as application of chemical fertilizer, crop production and ruminant animals, land use, land cover change, and deforestation contribute significant amount of greenhouse gases. Hence, adjustment of the traditional way of farming practices to absorb these shocks and minimize emission of greenhouse gases is not an option (IPCC, 2014). Therefore, the promotion and adoption of context specific socioeconomic and environmental friendly practices have paramount importance to increase production and ensure food security. In turn, this could help to build the resilience of the farming community. It is with this premise that CSA has been introduced to increase agricultural production and productivity in sustainability. CSA practices can be adopted in a wide range of different combinations, and this has implication on household’s food security status.
CSA identifies synergies and trade-offs among food security, adaptation and mitigation as a basis for informing and reorienting policy in response to climate change. CSA pathways result in higher resilience and lower risks to food security, whereas business as usual leads to higher risks of food security and lower resilience of food and agricultural systems (McCarthy et al., 2011). The overall aim of CSA is to support efforts from the local to global levels for sustainably using agricultural systems to achieve food and nutrition security for all people at all times, integrating necessary adaptation and capturing potential mitigation. Climate change alters agricultural production and food systems, and thus the approach to transforming agricultural systems to support global food security and poverty reduction (Porter et al., 2014).
Adoption of CSA could help to positively affect all dimensions of food security and hence food system. Food security provides implications of changes in agricultural production patterns, impacts on the production of food and will affect food supply, and higher yields. Impacts on all forms of agricultural production will affect livelihoods and access to food. Producer groups that are less able to deal with climate change, such as the rural poor, risk having their safety and welfare compromised. Other food system processes, such as food processing, distribution, acquisition, preparation and consumption, are important for food security as food and agricultural production. The role of agricultural production in food security receives more emphasis than other aspects. The Green Revolution of the 1960s increased the total amount of food produced by applying technologies to improve yields per hectare and by expanding the area under production. This approach increased the availability of food globally both total agricultural production and per capita food availability. Food availability is concerned with the production and supply of crops. Food accessibility focuses on economic and physical access to food and relates to the issue of affordability. Food utilization is also the importance of non-food inputs. It takes into consideration the quality of food people eat and its nutritional value. It also encompasses the process of preparing the food, distribution, health-care, water supply and sanitation conditions. Stability increases supply of sufficient food at all times.
The identified local CSA practices crop rotation; fertilizer application; popularization of new technology crop varieties; pest resistance, high yielding, tolerant to drought and short season varieties; and post-harvest technologies are highly adopted in the study area. Thus, these practices are a means to reduce the agricultural sector sensitive to climate variability and climate change and improve food security components like food availability in broad-spectrum; food accessibility in obtaining households’ access to food connected mainly to national food production and allocated through markets and non-market distribution mechanisms; utilization of food which includes existence of suitable food processing, proper storage practices, sufficient knowledge application and implications of food security. Farming communities vary in their asset background such as human capital, natural capital, physical capital, financial capital, information capital. These are determinant factors to CSA adoption and practices. Accordingly, in this empirical study we identified that household size, farming system, off-farm income, farm size, access to irrigated farm, distance to market, and access to agricultural credit are determinant factors to CSA adoptions and more responsibility for food security.
CONCLUSIONS
The study examined the extent of farmers’ adoption of climate smart agricultural practices as baseline for intervention on climate mitigation measures. The results indicate that a large proportion of respondents were aware of most of the practices, but adoption of most of the practices examined was very low. Local CSA practices such as crop rotation and intercropping; efficient fertilizer application techniques; popularization of new crops and improved crop varieties; pest resistance, high yielding, and drought tolerant crops were highly adopted while adoption of other components of CSA practices were very low.
The result shows the determining factors of adoption of climate smart agriculture practices in the study area. Those factors are household size, farming system, off-farm income, access to irrigated farm, distance to market, farm size, and access to agricultural credit.
The key finding is that CSAs have the potential to alleviate food insecurity among small scale farmers if used in combinations and to a larger extent. Thus in conclusion, improved adoption of these practices could help reduce food insecurity for small scale farmers.
As regards demand for CSA practices, farmers should be motivated to join and participate in farmer organizations so that they could share farming information. Further, farmers could also stand a chance to be linked conveniently with extension service providers and farm financing agents. Crucially, off-farm income improves farm liquidity which provides an alternative means of financing farm operations.
Farmers should be encouraged to incorporate in all CSAs as much as possible to have a higher effect on food security status. Also, sensitization campaign on reality of climate change and the need to adopt climate smart agriculture practices towards reduction of adverse effect of climate change should be intensified.
Research, policy and supportive programs should focus on adoption of CSA practices especially those ones that were not highly adopted by farmers.
CONFLICT OF INTERESTS
The author has not declared any conflict of interests.
REFERENCES
|
Amao JO, Ayantoye K (2015). Correlates of Food Insecurity Transition and its Determinants among Farming Households. North Central, Nigeria: Journal of Economics and Sustainable Development 6(24):230-244. |
|
|
Aweke M (2017). Climate Smart Agriculture in Ethiopia. Climate Smart Agriculture Country Profiles for Africa Series. Feed the Future. USAID. |
|
|
Bewket W (2009). Rainfall Variability and Crop Production in Ethiopia: Case Study in the Amhara region. In Proceedings of the 16th International Conference of Ethiopian Studies. |
|
|
Branca G, McCarthy N, Lipper L, Jolejole MC (2013). Food security, climate change and sustainable land management: a review. Agronomy for Sustainable Development 33(4):635-650. |
|
|
Collins M, Knutti R, Arblaster J, Dufresne JL (2013). Long term climate Change: Projections, Commitments and Irreversibility. Switherland. The Physical Science Basis. Contribution of Working Group I to the Fifth Assessment Report of the IPCC. Cambridge University Press, pp. 1029-1136. |
|
|
Central statistical agency (CSA) (2007). Population and Housing Census of Ethiopia. Summary and statistical report population size by age and sex. Federal Democratic Republic of Ethiopia, Population census commission. Central Statistical Agency, Addis Ababa. |
|
|
Central statistical agency (CSA) (2013). Population Projection of Ethiopia for All Regions at Woreda Level from 2014-2017. Addis Ababa, Federal Democratic Republic of Ethiopia. |
|
|
Central statistical agency (CSA) (2017). Agricultural Sample Surveys 2017/2018 (2010 E.C.), Volume 1. Report on area and production of major crops. Addis Ababa, Federal Democratic Republic of Ethiopia. |
|
|
Food and Agriculture Organization (FAO) (2006). The State of Food Insecurity in the World. Food and Agriculture Organization of the United Nations. Rome, Italy. |
|
|
Food and Agriculture Organization (FAO) (2013). Multiple Dimensions of Food Security. The State of Food Insecurity in the World. Rome, Italy. |
|
|
Food and Agriculture Organization (FAO) (2016). Ethiopia Climate-Smart Agriculture Scoping Study. United Nations, Addis Ababa, Ethiopia. |
|
|
FAO-UN (2013). Food and Agricultural Organization of the United Nations. Climate Smart Agriculture Sourcebook. Rome, Italy. |
|
|
IPCC (2014). Summary for policy makers. In. Climate change 2014: impacts, adaptation, and Vulnerability. IPCC Working Group II contribution to the Fifth Assessment Report of the Intergovernmental Panel on Climate Change. Cambridge University Press, Cambridge, United Kingdom and New York, NY, USA, pp. 1-32. |
|
|
Kalungu JW, Filho WL, Harris D (2013). Smallholder Farmers' Perception of the Impacts of Climate Change and Variability on Rain-fed Agricultural Practices in Semi-arid and Sub-humid Regions of Kenya: Journal of Environment and Earth Science 3:7. |
|
|
Lipper L, Zilberman D (2018). A Short History of the Evolution of the Climate Smart Agriculture Approach and its Links to Climate Change and Sustainable Agriculture debates. Natural Resource Management and Policy 52, |
|
|
McCarthy N, Lipper L, Branca G (2011). Climate-Smart Agriculture: Smallholder Adoption and Implications for Climate Change Adaptation and Mitigation. Mitigation of Climate Change in Agriculture Series No. 4. Rome, Italy. |
|
|
Melaku J, Sebastian G, Edward K (2016). Ethiopia Climate Smart Agriculture Scoping Study. FAO, Addis Ababa, Ethiopia. |
|
|
National Meteorology Agency (NMA) (1996). Climatic and Agro-climatic Resources of Ethiopia. Meteorological Research Report Series, 1(1). Addis Ababa, Ethiopia pp. 1-37. |
|
|
National Meteorology Agency (NMA) (2007). Final Report on Evaluation Criteria for Identifying High Priority Adaptation Activities prepared by B and M Development Consultants. Addis Ababa, Ethiopia. |
|
|
National Meteorology Agency (NMA) (2015). Hydro Meteorological Bulletin. February, 2015. Addis Ababa, Ethiopia. |
|
|
National Meteorology Agency (NMA) (2018). Long term Climate Data Description in Ethiopia. National Meteorological Agency. Addis Ababa, Ethiopia. |
|
|
Oliver HW (1980). Monthly Precipitation Distribution: A Comprehensive Index. The Professional Geographer 32:300-309. |
|
|
Porter JR, Xie L, Challinor AJ, Cochrane K, Howden M, Iqbal MM, Lobell DB, Travasso MI (2014). Food Security and Food Production Systems. Climate Change: Impacts, Adaptation and Vulnerability. Working Group II Contribution to the IPCC 5th Assessment Report, Geneva, Switzerland. |
|
|
Saguye TS (2017). Assessment of Farmers" Perception of Climate Change and Variability and its Implication for Implementation of Climate-Smart Agricultural Practices. Journal of Geography and Natural Disasters 7(191):1-9. |
|
|
Santrock JW (2011). Life-Span Development (13th Ed.). New York: McGraw-Hill. |
|
|
Seleshi Y, Zanke U (2004). Recent changes in rainfall and rainy days in Ethiopia. International Journal of Climatology 24:973-983. |
|
|
United Nations Development Program (UNDP) (2016). Strengthening National Capacities to Enhance Agricultural Production and Productivity. United Nations Development Program. |
|
|
World Bank (2011). Climate-Smart Agriculture: Increased Productivity and Food Security, Enhancing Resilience and Reduced Carbon Emissions for Sustainable Development. Opportunities and Challenges for a Converging Agenda: Country Examples. Washington, DC. |
|
|
Yamane T (1967). Statistics: An Introductory Analysis, 2nd Ed. Volume 10. A Harper International Edition. New York: Harper and Row. |
|
Copyright © 2024 Author(s) retain the copyright of this article.
This article is published under the terms of the Creative Commons Attribution License 4.0


