Full Length Research Paper

ABSTRACT
Mechanical sugarcane planters simultaneously perform ploughing, fertiliser application, seedling metering and furrow covering operations. This study aimed to evaluate the billet metering quality and uniformity of a sugarcane planter and the total damage to buds. The experimental design used was completely randomised in a 2 x2 factorial arrangement totalling four treatments, which consisted of two planting speeds (5.0 and 6.5 km h-1) and two conveyor belt rotation speeds (50 and 100%, which corresponds to 45 and 85 rpm, respectively, in the conveyor belt pulley), with 20 replicates per treatment. The following parameters were evaluated: number of billets m-1, total buds m-1, viable buds m-1 and damaged buds (%). The planter metering mechanism exhibited uniform billet metering with low bud damage (5.9%). The increase in working speed decreased the number of billets (9.7 m-1), total buds (22.9 m-1) and viable buds (18.5 m-1). Furthermore, the increase in conveyor belt rotation speed also increased these parameters.
Key words: Statistical process control, agricultural mechanisation, planting speed, Saccharum officinarum.
INTRODUCTION
Brazil is expected to produce 654.6 million tons of sugarcane in the 2015/2016 crop year in an area of approximately nine million hectares. The sugarcane production of the country is estimated to increase by 3.1% when compared with the previous crop year. An higher increase in production is precluded by the relatively small increase in planted area in Brazil (0.7%) and by the fact that the yield of sugarcane fields in São Paulo, the largest sugarcane-producing state, is recovering from drought in the previous crop year (Conab, 2015). The Brazilian sugarcane industry encompasses seven states, which are responsible for making Brazil the largest producer and exporter of sugarcane and ethanol in the world (Bottega et al., 2013).
The mechanical sugarcane planting system includes a planter that simultaneously conducts the ploughing, fertiliser application, seedling metering, pesticide application and furrow covering operations (Ripoli et al., 2007). This process follows conventional agronomic recommendations, with single-row spacing ranging from 1.0 to 1.60 m and double-row spacing with double rows 0.40 to 0.50 m apart from each other and with 1.40 m between double rows (Coleti and Stupielo, 2006).
The average bud density used is 12 buds per metre of furrow and varies among sugarcane farmers and varietal specifications (Beauclair and Scarpari, 2006). Many farmers use between 18 and 22 buds per metre of furrow seeking to improve the plant stand to ensure that the final seedling quality allows a ratio of 12 buds per metre of furrow, with the remaining buds becoming unviable during the process (Raveli, 2013).
Quality indicators of agricultural sugarcane operations have been used in Brazil since the 1990s through studies on tillage, pesticide application, liming, planting and harvesting. Campos et al. (2008), Silva et al. (2008), Barros and Milan (2010), Noronha et al. (2011), Cassia et al. (2014) and Ramos et al. (2014) listed several quality indicators of mechanical sugarcane operations. Monitoring through statistical process control may increase the operational quality levels.
Planting speed is a key factor because it increases working capacity (Melo et al., 2013), which is desired by farmers. Billet metering uniformity is affected by planting speed because the machine has to perform the operations correctly but without hindering performance or damaging vegetative organs during metering (Cebim, 2008).
Conveyor belt rotation speed and its metering uniformity are crucial because when changing the planting speed, the conveyor belt rotation speed must be adjusted to maintain the same billet and bud metering. Thus, the relationship between planting speed and conveyor belt rotation speed must be adjusted because the metering mechanism is the main determinant of the success of the billet planter operation (Cebim, 2008; Pauli, 2009; Barros and Milan, 2010).
Thus, this study aimed to evaluate the billet metering uniformity of a sugarcane planter and the damage to buds as a function of planting speed and conveyor belt rotation speed.
MATERIALS AND METHODS
The experiment was conducted in January 2013 in the municipality of Nova Europa, in the state of São Paulo (SP), Brazil, in an area located near 21°46'3.69" S latitude and 48°36'47.83" W longitude, with an average altitude of 545 m. The soil of the experimental area was classified as Eutrophic Red-Yellow Argisol (Ultisol in the USDA soil classification system), with medium to medium-clayey texture, according to the method reported in Embrapa (2013). The sugarcane variety used was CTC4.
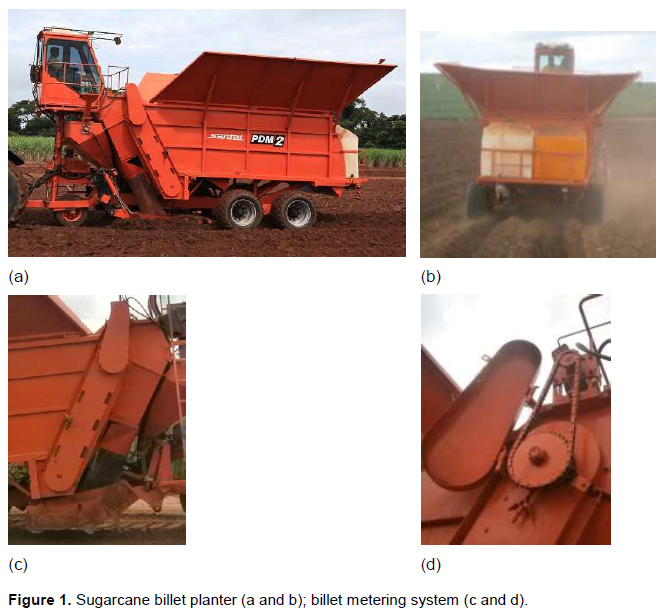
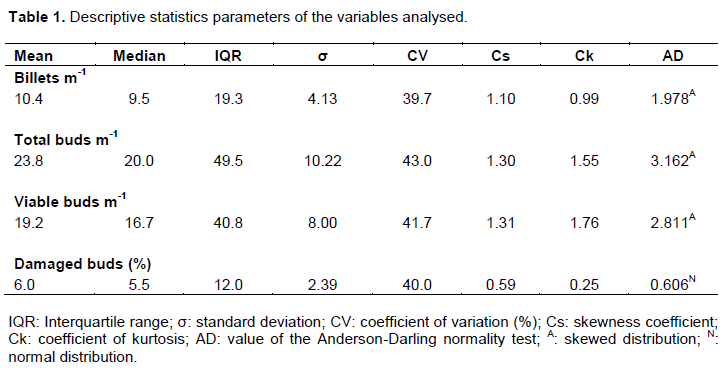
Mechanised sugarcane planting was conducted using a two-row sugarcane billet planter, Santal PDM 2 (Figure 1), which performs the planting operations (ploughing, fertiliser application, billet metering, insecticide application and furrow covering and compaction) in two rows simultaneously, operating without the furrow covering and compaction mechanism at the time of planting to facilitate measurement of variables. The planter was coupled to a Valtra BT 210 4x2 TDA tractor with a 2200 rpm engine with 154.4 kW horsepower (210 cv).
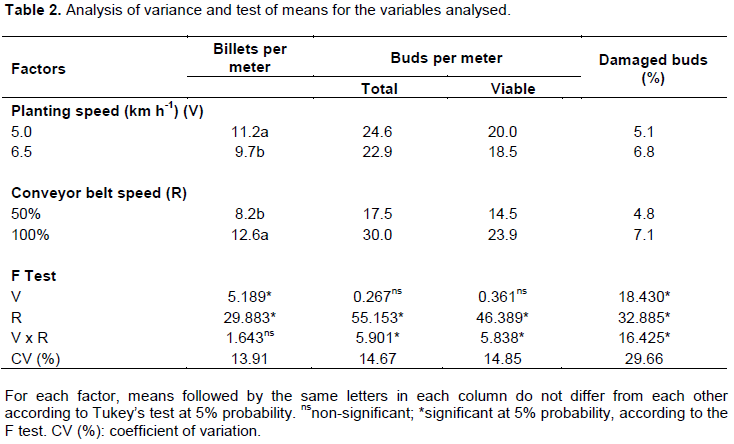
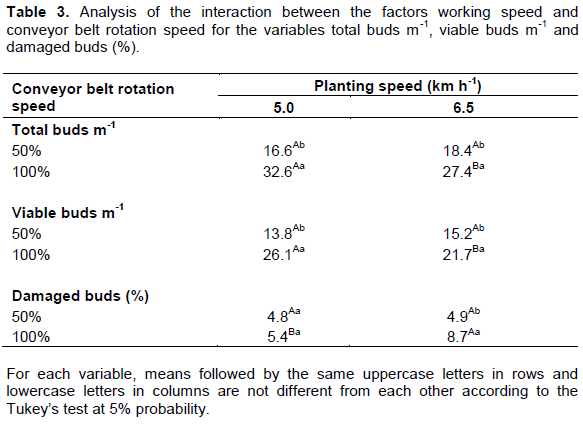
The sugarcane billet planter models available in the domestic market contain metering mechanisms consisting of one or two cleated conveyor belts equipped with a central deflector flap to direct the billet when metering. The model used has a new billet metering system that consists of a removable bottom, rotating metering container and single infeed conveyor belt of the outlet nozzle.
The experimental design used was completely randomised (completely randomised design, CRD), in a 2 x 2 factorial arrangement, totalling four treatments, which consisted of two planting speeds (5.0 and 6.5 km h-1) and two rotation speeds of the billet planter conveyor belt (50 and 100%, which corresponds to 45 and 85 rpm, respectively, in the conveyor belt pulley) with 20 replicates per treatment. Each replicate consisted of samples from both planting rows (right and left), separated by 30 m in row length.
The billets used were characterised by collecting 30 units inside the transport truck and planter; the billets averaged 433 mm in length, 25 mm in diameter, 212 g, and 2.3 buds per billet, with 89% viability. Bud damage was caused by the mechanised harvesting operation (10.9%), and the damage resulting from the transport to the planter was virtually zero (< 0.1%).
The number of billets was determined after planting, through direct count, in four meters of the evaluation furrows. Only one evaluator performed the count for each treatment (20 replicates) for increased experimental control. The number of total buds was determined by direct count in the same billets previously obtained, in the four meters of both evaluation furrows (left and right). The number of viable buds was determined by direct count in the same billets used to assess the total number of buds, in the four meters of both evaluation furrows. Buds were considered viable when they exhibited no damage caused by pests and diseases or any cuts, from harvest until the evaluation of the planting furrows. The number of unviable buds was obtained by the difference between total buds and viable buds, thereby calculating the percentage of damaged buds over total buds.
When operating the planter, the soil water content was measured according to the method reported by Embrapa (1997) at the tillage depth range reached by the furrowers; the soil water content was 9.9% in the 0-15-cm layer, 12.5% in the 15-30-cm layer, and 10.1% in the 30-45-cm layer.
Data were processed using Minitab® 16 software. A descriptive analysis was conducted to determine the measures of central tendency (mean and median) and the coefficients of variation, skewness and kurtosis to characterise the study variables. Dispersion was classified according to the magnitude of the coefficient of variation (CV), as per Pimentel-Gomes and Garcia (2002): “low” for a CV value lower than 10%; “medium” if it is between 10 and 20%; “high” if it is between 20 and 30%, and “very high” if it is higher than 30%. The data were subjected to the Anderson-Darling normality test, and the variables with skewed distribution were transformed. The following data fit models were used: Y’= lnY for the number of billets and  for the total buds and viable buds. The transformed data were subjected to analysis of variance using the F test at 5% probability. When the F test was significant, the means were compared according to Tukey’s test at 5% probability using Sisvar 4.3 software.
The variability analysis was performed by statistical process control using Minitab® 16 software. The tools used were variable control charts using the variables previously described as indicators, with non-normalised data. The mean values and the upper (UCL) and lower (LCL) control limits were defined on the charts using the overall mean of the variable ± three times the standard deviation. The LCL was considered null when its value was negative because negative values have no physical significance for the study variables.
RESULTS AND DISCUSSION
The number of damaged buds m-1(Table 1) exhibited a normal distribution. The other variables exhibited a skewed probability distribution. The mean and median values of the variables number of billets m-1, total and viable buds m-1, and damaged buds (%) were different from each other, indicating high data dispersion. The values of interquartile range, standard deviation and coefficient of variation, with the latter being classified as very high (Pimentel-Gomes and Garcia, 2002), also differed from each other.
The skewness coefficients indicated that the data distributions were skewed to the right with a high degree of skewness, except for the variable damaged buds, which exhibited a moderate degree of skewness. That information is confirmed by the kurtosis coefficients, which indicate that the data follow a leptokurtic distribution, that is, a more elongated curve than normal. There is an association between the kurtosis and skewness coefficients to predict the behaviour of data over time. They may affect the variability and/or distribution of logical results of a particular process or operation (Bai and Ng, 2005).
Although, the coefficient of variation of damaged buds is very high, such skewness was insufficient to render the data distribution non-normal, which may be confirmed by the Anderson-Darling test. Similar results were found by Voltarelli et al. (2013), thus characterising quality indicators of mechanised agricultural operations in which the data variation is high. The analysis of variance indicated that a higher billet-metering rate is obtained with increased conveyor belt rotation speed. However, this relationship is not directly proportional; that is, doubling the conveyor belt rotation speed does not double the number of billets m-1, which increases by 53% (Table 2). When the conveyor belt operates at maximum rotation speed, the number of billets m-1 decreases with increasing planting speed, which underscores the need for conveyor belt speed adjustments to be dynamic; that is, as the operator changes the planting speed, the conveyor belt rotation speed must be set to compensate for this variation and maintain the desired billet metering rate. Interaction between working speed and conveyor belt rotation speed was observed or the following variables: total buds, viable buds and damaged buds (Table 3).
The number of total buds increases when doubling the metering speed of the conveyor belt, both at 5 (96% increase) and 6.5 km h-1 working speeds (48% increase; Table 3). The number of buds decreases when maintaining a constant conveyor belt rotation speed (100%) and increasing the working speed, which again highlights the need to adjust the conveyor belt speed. The same trend is observed for the number of viable buds (Table 3) because it is related to the number of total buds.
The mean bud density currently adopted in mechanised sugarcane plantations is 12 buds m-1 furrow, depending on the sugarcane variety and vegetative growth (Beauclair and Scarpari, 2006). The means of the present study were higher, reaching the closest value to the mean (16.6 buds m-1) at 5.0 km h-1 working speed with the conveyor belt at 50% rotation speed (Table 3). The number of damaged buds (Table 3) was higher when the planting speed was increased at 100% conveyor belt rotation speed because the high rotation speed damaged a higher number of buds. No increase in bud damage occurred when increasing the conveyor belt rotation speed at 5 km h-1 planting speed. Conversely, the increase in rotation speed at 6.5 km h-1 planting speed caused a 3.8% increase in damaged buds. However, the percentage of damaged buds resulting from the planting operation is low and thus will not hinder sugarcane sprouting because seedling quality is essential in this process (Noronha, 2011). This low damage is attributed to the variety used (CTC4), which is suitable for mechanical planting, and has a good quantity of straw in the stalks, thus protecting the buds from damage, particularly from billet metering mechanisms.
Mechanical harvesting is the main cause of decreased rates of viable buds intended for sugarcane planting operations (Lai et al., 2011). Through virtual simulation analysis, the authors found that a new design of the basecutter support mechanism (vehicle and field system) that provides higher quality to the operation must be used to ensure lower damage rates in mechanical harvesting.
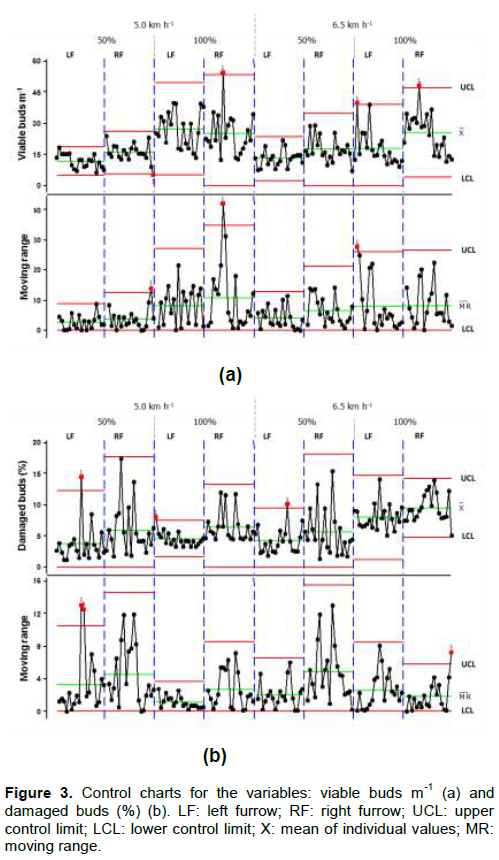
Uniformity analysis (Figures 2 and 3) of billet metering exhibits uniformity between the right and left furrows in all treatments. Process variation was significantly changed with the increase in the conveyor belt rotation speed of the planter, as indicated by the increase in interquartile range upper and lower limits (100% conveyor belt rotation speed). However, such variation did not affect operational uniformity because the results only extrapolated the control limits at one point, thereby indicating that the planter maintains a consistent billet metering pattern (Figure 2a).
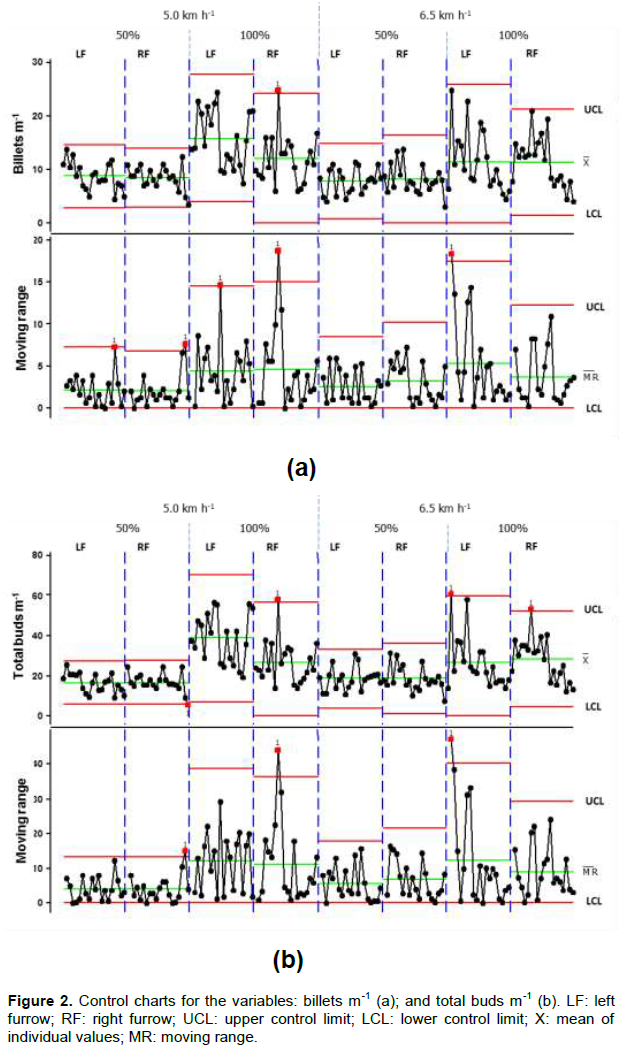
Metering uniformity was maintained throughout the planting time. Therefore, no type of metering-hampering trend was observed with the decrease in seedling load inside the planter, which highlights the ability of the billet bin to meet the metering rate of the conveyor belt satisfactorily.
The data distribution interquartile range, although within the control limits, exhibits deficient metering mechanisms, which is the greatest challenge to sugarcane planters given the billet size variability (Ripoli and Ripoli, 2010). The authors evaluated five sugarcane planters and observed the same limitation in all machines. A wider interquartile range of total buds (Figure 2b) was observed when changing the conveyor belt rotation speed to 100%, with points occurring above and below the control limits. This exemplifies the effect of externalities on this variable, which may result from factors such as the lack of pressure in the tractor hydraulic systems or the lack of uniformity in bud number per billet. However, those observations are isolated instances within a large number of samples, and the focus should stay on the increased vulnerability of the operation as long as the metering uniformity achieved by the planter is not hindered. Similar results were also observed for the variable viable buds (Figure 3a).
The quality of sugarcane planting using seedlings derived from mechanical harvesting can be reduced given the number of buds planted in the planting furrows (Orgeron et al., 2007). This situation can occur if continuous planting monitoring is not performed thoroughly. The data for the variable damaged buds (Figure 3b) contain points outside the control limits for the 5 km h-1 working speed in the left planting furrow. These points are subjected to the action of natural causes only. These results indicate the need for greater control of sugarcane planting speed, which may be achieved by controlling the following factors: (raw) materials, method, measurement and machine. These factors are included in the “6 M’s”, as they are known in statistical process control studies.
Seedling quality is essential for sugarcane sprouting. Thus, the low average rate of damaged (or unviable) buds contributed to maintaining the planting operation under control, as also observed by Noronha (2011).
CONCLUSIONS
The planter metering mechanism exhibited uniform billet metering with low bud damage. The increase in working speed reduced the number of billets and total and viable buds. In turn, the increase in conveyor belt speed increased these parameters.
CONFLICT OF INTERESTS
The authors have not declared any conflict of interests.
REFERENCES
|
Bai J, Ng S (2005). Tests for skewness, kurtosis, and normality for time series data. J. Bus. Econ. Stat. 23(1):49-60. |
|
|
Barros FF, Milan M (2010). Operational quality of sugar cane planting. Bragantia. 69(1):221-229. |
|
|
Beauclair EGF, Scarpari MS (2006). Noções fitotécnicas. In: Ripoli TCC, Ripoli MLC, Casagrandi DV. Plantio de cana-de-açúcar: estado da arte. Piracicaba: Livroceres. Cap. 4:80-91. |
|
|
Bottega EL, Muniz RL, Galan GL, Guarido RC, Piazzetta HL (2013). Estimate of time cost field operations in two systems sugarcane planting. J. Agro. Sci. 2(2)251-259. |
|
|
Campos CM, Milan M, Siqueira LFF (2008). Identification and analysis of the critical variables in the sugar cane production process. Engenharia Agríc. 28(3)554-564. |
|
|
Cassia MT, Silva RP, Paixão CSS, Bertonha RF, Cavichioli FA (2014). Basecutter blades wear in quality of mechanized harvesting. Ciênc. Rural. 44(6):987-993. |
|
|
Cebim GJ (2008). Plantio Mecânico de cana de açúcar (Sccharum spp.): desempenho operacional e econômico. Dissertação (Mestrado em Agronomia) – Escola Superior de Agricultura Luiz de Queiroz. 101 p. |
|
|
Coleti JT, Stupielo JJ (2006). Plantio de cana-de-açúcar. In: Segato SV, Pinto AS, Jendiroba E, Nóbrega JC (Ed). Atualização em produção de cana-de-açúcar. Piracicaba: CP 2. Cap 4:139-153. |
|
|
Conab (2015). Acompanhamento da safra brasileira de cana-de-açúcar, v.2 - Safra 2015/16, n.1. Brasília: Embrapa 28 p. |
|
|
Embrapa (1997). Serviço Nacional de Levantamento e Conservação do Solo. Manual de métodos e análise de solo. Rio de Janeiro: Embrapa 212 p. |
|
|
Embrapa (2013). Sistema brasileiro de classificação de solos. Bras. Embrapa 353 p. |
|
|
Lai X, Li SP, Ma FL, Qin ZW, Zhou JH, Zheng GP (2011). Simulation and experimental study on sugarcane field excitation to the cutter. Adv. Mater. Res. 156-157:1105-1108 |
|
|
Melo RP, Albiero D, Monteiro LA, Souza FH, Silva JG (2013). Quality in the distribution of corn seed by planters in a soil of the Ceará. Rev. Ciênc. Agron. 44(1):94-101. |
|
|
Noronha RHF (2011). Qualidade da operação de plantio mecanizado de cana-de-açúcar em sistema meiosi. 38 pp. Dissertação (Mestrado em Agronomia) – Universidade Estadual Paulista, Faculdade de Ciências Agrárias e Veterinárias. |
|
|
Noronha RHF, Silva RP, Chioderoli CA, Santos EP, Cassia MT (2011). Statistical control applied in the process of mechanical sugar cane harvest in the diurnal and nocturnal periods. Bragantia. 70(4):931-938. |
|
|
Orgeron AJ, Gravois KA, Bischoff KP (2007). Planting rate effects on sugarcane yield trials. J. Am. Soc. Sugar Cane Technol. 27:23-34. |
|
|
Pauli DG (2009). Planejamento da qualidade do plantio mecanizado de cana de açúcar. 79 pp. Dissertação (Mestrado em Agronomia) – Escola Superior de Agricultura Luiz de Queiroz. |
|
|
Pimentel-Gomes F, Garcia CH (2002). Estatística aplicada a experimentos agronômicos e florestais: exposição com exemplos e orientações para uso de aplicativos. Piracicaba: FEALQ 309 p. |
|
|
Ramos CRG, Lanças KP, Lyra GA, Milani TM (2014). Quality of sugar cane mechanized harvest as function of the forward speed and engine rotation of the harvester. Energia Agric. 29(2):87-94. |
|
|
Raveli, MB (2013). Controle de Qualidade no plantio de cana de açúcar. Dissertação (Mestrado em Agronomia) – Universidade Estadual Paulista, Faculdade de Ciências Agrarias e Veterinárias. 66 p. |
|
|
Ripoli MLC, Ripoli TCC (2010). Evaluation of five sugar cane planters. Engenharia Agrícola. 30(6):1110-1122. |
|
|
Ripoli TCC, Ripoli MLC,Casagrandi DV, Ide BY (2007). Plantio de cana-de-açúcar: estado da arte. 2. ed. Piracicaba: Edição dos autores 722 p. |
|
|
Silva RP, Corrêa CF, Cortez JW, Furlani CEA (2008). Statistical control applied in the process of mechanical sugar cane harvest. Engenharia Agríc. 28(2):292-304. |
|
|
Voltarelli MA, Silva RP, Rosalen DL, Zerbato C, Cassia MT (2013). Quality of performance of the operation of sugarcane mechanized planting in day and night shifts. Aust. J. Crop Sci. 7(9)1396-1406. |
|
Copyright © 2024 Author(s) retain the copyright of this article.
This article is published under the terms of the Creative Commons Attribution License 4.0


