Full Length Research Paper

ABSTRACT
This study was undertaken to determine the factors that influence the output of aquaculture production and the profitability of three production systems (concrete tank, earthen pond, and mobile tank) in Southern Agricultural Zone of Cross River State. A multi-stage stratified random sampling technique was used to select 140 farmers from three LGAs in the study area. Structured questionnaire was used for data acquisition. Descriptive and inferential statistics alongside budgeting techniques were used in data analysis. ANOVA results indicates that there was significant difference (P<.01) among the mean output of fish per pond from the three production systems, with earthen pond having the highest value (2163.65), followed by concrete tank (1515.77), and mobile tank (263.05). The mean values of the gross margins in the three production systems indicated that earthen pond had highest values (₦1,138,682.35), followed by concrete tank (₦935,326.18)), and mobile tank (₦792,385.00). Years of experience, quantity of feed, stocking density and labour had positive influences on output for concrete tank, while quantity of feed, labour and years of experience had positive and significant influence on output for earthen pond. Educational level and quantity of feed had positive and significance influences on mobile tank output. The profitability ratios; return on investment and return on sales indicate that there was no significant difference (P>.01) among the fish farming systems. Establishment of fish farm estates in the study area to enable fish farmers operate in clusters for efficient utilization of government facilities for enhanced productivity is recommended.
Key words: Aquaculture production systems, gross margin, profitability ratios, return on investment and return on sales.
INTRODUCTION
Aquaculture also known as fish farming is the production of fish under a controlled environment which involve some farming activities. Such farming activities are stocking water with seed (fingerlings), fertilizing the water in fresh, feeding the organisms and maintaining water quality. Fish farming is one of the vital sectors that are being explored as it is the best and cheapest source of animal protein for human consumption (Dauda et al., 2017). Fish demand is intensifying as world’s population increases. In Nigeria, fisheries contributed 0.88% to the Agriculture GDP and contribution of Agriculture to Nigeria GDP is 22%. FDF (2018) also stated that the subsector provides employment for 8.632 million people in the primary sector and 19.55 million people in the secondary sector. Nigeria population is about 200 million (FAOSTAT 2019). With an estimated annual per caput fish consumption of 17.5 kg by FAO, Nigeria projected fish demand for 2018 is 3.6 million metric tons (FDF, 2018). Nigeria is the largest consumer of fish products in Africa. Fish demand is intensifying as world’s population increases; it is an important source of animal protein and has no religious taboo or any cultural limitation affecting its consumption unlike pork and beef. It offers the best and cheapest source of good quality protein, macronutrients like vitamin A, lron, zinc, calcium, selenium and essential fatty acids, providing important diet of many poor people in Nigeria. The dependence on fisheries by million of people around the world, coupled with increased consumer demand for aquatic food and the depletion of global fisheries has created an impetus to expand fish production through aquaculture or fish farming (Adeogun and Alimi, 2014). Fish farming can be reared in earthen pond, concrete or mobile tanks. Each system has its unique features.
The earthen pond system is the oldest form of fish farming system in Nigeria. The system involves the development of ponds with close proximity to water bodies or along the course of a gentle flowing stream, or the excavation (creation of a cavity or void) of a marked portion of land where water level is close to the ground.
Concrete ponds are made both of vibrated hollow blocks filled with concrete mix or with reinforced concrete slab. It can be of varying sizes and shapes. This production system is common particularly where land is not available or suitable for earthen pond construction.
Mobile tanks are portable fish pond constructed with collapsible tarpaulin material, stretch or prove and resistance to stripping. The materials are non- toxic, UV resistant and anti-oxidative. The tank can be folded when empty, very durable and easy to transport. There are various sizes of the tank and can be used equally where land is limited or on rented apartments. Fish farming is an enterprise that aims at profit maximization and to attain this, every element of production must be put together. To choose the type of production systems to culture in, its demerit must be minimal, hence, this study evaluated and compared three aquaculture production systems (concrete tanks, earthen ponds and mobile tanks) used in the production of fish in southern Calabar, Cross River State, Nigeria to determine which production system would boost production in terms of output, increased profit and sustained production for fish farmers in order to bridge the gap between the supply and demand of fish in the study area.
METHODOLOGY
Description of study area
The study was conducted in Southern Agricultural Zone of Cross River State, Nigeria consisting of six Local Government Areas (LGAs) namely, Calabar Municipal, Calabar South, Bakassi, Akpabuyo, Akamkpa, Odukpani and Biase. (CRADP, 2010). The zone lies between latitudes 5â—¦ 25â—¦ N and longitude 25â—¦ 0â—¦ E. of the meridian. The town is flanked on its eastern and western border by two large perennial streams viz: the Great Kwa River and the Calabar River respectively. The zone has a population of 371,022 as at 2006 census. It features a tropical monsoon climate with lengthy wet season spanning ten months and a short dry season covering the remaining two months. The Southern Agricultural zone of Cross River State, covers an area of 406 km2 (157 m2) with a density of about 910 km2 (2400 m2). Temperature is relatively constant in the area ranging from 25 to 28°C. The soil is fertile, well drained and aerated for cultivation of various crops which includes rice, maize, plantain, banana, cassava, pineapple, oil palm and rearing of homestead poultry, aquaculture etc. its coastal mangroves support an economically important national fishery. Majority of the people living in the area are engaged in artisanal fishing, subsistence farming and local trading (Agbor, 2007).
Sampling technique and sampling size
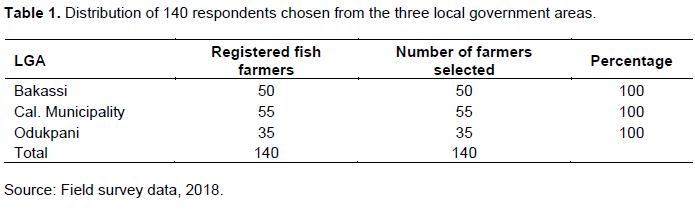
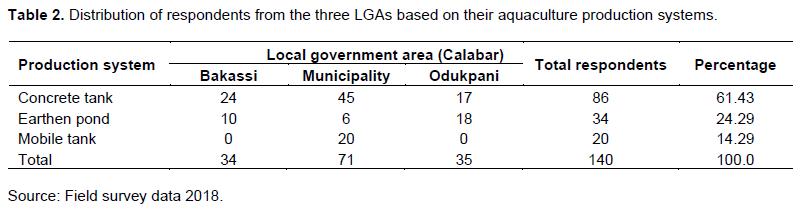
A total of 352 fish farmers registered with the State Fisheries Department, Ministry of Agriculture were involved in fishing of which 140 respondents were purposively selected for participation in this study because of the prevalence of the fish farmers in the study area. A multi-stage stratified random sampling technique was adopted. Firstly, purposive selection of one agricultural zone was achieved, then three out of seven Local Government Areas (Bakassi, Calabar Municipality and Odukpani) were randomly selected. The next stage was to choose all registered farmers involved in fishing from the three selected LGAs, which constitutes 40% of the entire population in the southern Agricultural Zone of the State. The fish farmers selected were further stratified into three different fish production systems. The distribution of the sample is presented in Table 1, while Table 2 shows the distribution of respondents for each production system.
Sources of data and method of collection
Data for the study was obtained through primary sources with use of structured questionnaire supplemented with oral discussions. The questionnaire was designed based on the study objectives and divided into two main sections. Section one contained information on the socio-economic characteristics of the respondents, while section two covered responses to address the research questions and objectives. The questionnaire was administered to selected fish farmers in the study area for responses of suitable information on socio-economic data, production data and output data.
Analytical techniques
The data was analyzed using descriptive, inferential statistics and budgeting techniques. Descriptive statistics was used to analyze socio-economic characteristics of the fish farmers in the study area which include tables, means, and percentages. Inferential statistics was used to analyze comparison of the mean output of fish/pond using one way analysis of variance (ANOVA), multiple regression analysis was used to analyze factors influencing output of fish/pond in the different production system, Turkey t-test was used to compare the means and the budgeting technique. The SPSS V22-64-bit version was used for the analysis.
Model specification
Multiple regressions
The multiple regression analysis was estimated using the ordinary least squares (OLS), to determine factors that influence output of fish from the various systems and four functional forms was estimated; the linear, semi-log, double-log and exponential were tried, and the one that gave the best fit was chosen as the lead equation.
The aquaculture production function model was stated implicitly as:
Y = F (X1, X2, X3, X4, X5, X6, X7, X8, U) (1)
Where, Y = output of fish/pond (Kg/m2); X1 = stocking density (No/m2); X2 = quantity of feed (Kg); X3 = Type of fertilizer used (dummy, organic=0, inorganic=1); X4 = educational level (years of schooling completed); X5 = Farming experience (no. of years involved in farming); X6 = extension visit (dummy, 0=No visit, 1= Yes visit); X7 = labour (man days); U = error term.
The following are the four functional forms estimated:
Linear:
Y= b0+ b1X1 + b2X2 + b3X3 + b4X4 + b5X5+ b6X6+b7 X7 +U (2)
Semi-log:
Y = b0 + b1lnX1+b2lnX2 + b3lnX3 + b4lnX4 + b5InX5 + b6InX6 + b7X7 + U (3)
Double Log:
In Y = b0 + b1lnX1 + b2lnX2 + b3lnX3 + b4lnX4 + b5lnX5 + b6lnX6 + b7X7 + U (4)
Exponential:
In Y = b0 + b1X1+ b2X2 + b3X3+ b4X4 + b5X5 + b6X6+ b7X7+ U (5)
Where Y= output/pond, X1- X7 and U are as defined in (1); b0= intercept; b1 – b7 are coefficients of the explanatory variables to be estimated.
These models were estimated for each production system.
Budgeting technique, cost and return analysis
Budgeting technique was used to ascertain the cost, revenue and gross margins of the various systems. The cost and return analysis was used to determine the cost and revenue structure in the three production systems; earthen pond system, concrete tank and mobile tank system. Total Cost (TC) = total fixed cost (TFC) + total variable cost (TVC).
Total variable cost (TVC) consists of all the operating cost incurred by the farmer throughout the period of farming from stocking to harvest. It includes costs of fish seed (fingerlings/ juveniles), lime, fertilizer, fish feeds, hired labour, medication, fuel, transportation, and miscellaneous.
Total revenue (TR) consists of receipts from total sales. It is simply the quantity harvested multiplied by price of fish per kg.
Gross Revenue = Quantity Harvested (kg) × Price of fish.
Gross margin (GM)
Gross margin is obtained by subtracting the total variable cost from the total revenue. Olukosi and Erhabor (1989) stated it thus;
GM = TR – TVC (6)
Where GM = Gross margin (₦); TR = Total Revenue (₦); TVC = Total variable cost (₦).
Analysis of variance (ANOVA)
The analysis of variance for one-way ANOVA was used to compare output of fish and profitability of the three production systems and is based on the F-distribution. Thus the test statistics for one-way classification is the F-test, which is given as:
F= MSTR/MSE
Where:
MSTR= Treatment mean square, and MSE= Error mean square.
Profitability ratios
Rate of return on investment (ROI)
Rate of return on investment (ROI) is used to evaluate the improvements made by a number of different investments. It is obtained by dividing the firm’s net income by its total cost and is calculated as:
ROI = NI/TC (7)
Where NI = Net income and TC=Total cost.
Return on sales (ROS)
It is the profit (or earnings) as a percentage of sales, and examines performance in relation to the profit earned. Higher ROS indicates increase in sales. It is calculated thus:
ROS=NI/R (8)
Where NI= Net income and R= Revenue.
RESULTS AND DISCUSSION
Output of fish per pond in the three aquaculture production systems in the study area
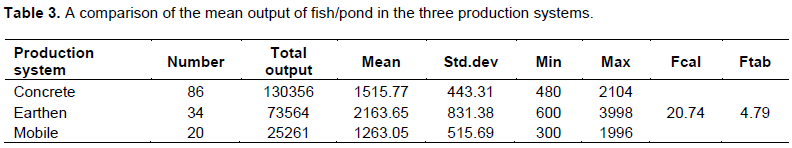
The mean output of fish in the concrete, earthen, and mobile tank production systems were 1515.77, 2163.65 and 1263.05 kg, respectively (Table 3). There is a significant difference (P<.01) among the mean output of fish per pond from the different production systems. The result further shows that the output of fish from the earthen pond was significantly higher than the output from the other production systems. This result agrees with Adebayo and Adesini (2008), as well as Ugwumba and Okoh (2010), who ascertained that fishes thrive well in earthen pond because it is perceived by fish as a close approximate of their natural habitat. This better performance, according to Nwuba and Onuoha (2006), could also be because earthen ponds are devoid of noise and enriched with natural feed items that promote the growth of fish.
Factors influencing output of fish/pond in the different production systems
Concrete tank
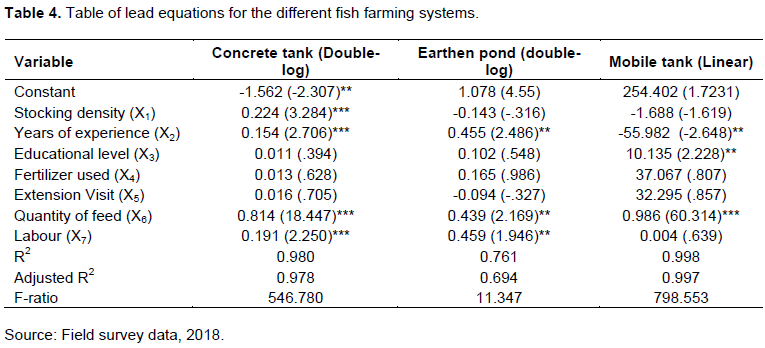
A multiple regression analysis was done in four functional forms (linear, semi-log, double log and exponential forms). Based on the statistical significance of the coefficients and the economy theory that support production concept, the double log functional form was best in terms of the coefficient of determination (R2), Adjusted R2, statistical significance of the estimated regression coefficients. The regression result is significant at the 1 and 5% levels and the coefficient of determination, adjusted R2 = 0.978. The F-ratio was 546.780 and significant at 1% level, implying that the joint effects of all the included variables were significant.
Of seven variables, four variables (quantity of feeds; labour, years of experience and stocking density) were significant. The quantity of feed had a positive coefficient, and is significant at 1% level. This means that output of fishes is influenced by quantity of feed given them (Tsue and Lawal (2012). This result is in line with Adikwu and Yusuf (1997) who noted that ‘diets (feeds) should supply all the essential nutrients and energy in adequate proportion to satisfy the requirement for growth’. Labour had a positive relationship with output and is significant at one percent level, implying that the higher the quantity of labour employed, the greater the influence on output of fish. This is in line with Adewuyi et.al. (2010) who reported that increase in the number of labour employed, would influence the level of output. The result reports that the number of years of experience was positive and significant at 1% level implying that fish farming is technical and requires minimum years of experience to go into the business. This agrees with Omotosho and Fagbenro (2005) who ascertained ‘that the management practice of the farmer improves as he gains more experience in farming.’ Stocking density was positive and significant at 1% level. The implication is that fingerlings stocked per pond determine growth rate of fishes and influences output. This result corroborates with Jamabo and Keremah (2009), Rowland et al. (2004), and Schram et al. (2006) who reported that ‘overstocking lowers growth rate, increases mortality and influence output negatively’.
Earthen pond system
The coefficient of determination (R 2) was 0.76 (Adjusted R2= 0.69). This implies that the included variables were able to explain about 76% of the total variations in fish output in earthen pond. The F-ratio was 11.35 and significant at the 1% level, implying that the joint effects of all the included variables were significant.
From the result, three of the seven variables were significant at 5% level. The variables were; quantity of feed, labour and years of experience. Quantity of feed had positive coefficient, implying that increase in the quantity of feed consumed at any given time increases weight of fishes and attracts quick market value. This agrees with Ideba et al. (2013) who reported that quantity of feed had significant effect on output levels of fish. Equally, labour was positive and significant at 5% level, indicating that increase in the quantity of labour employed (either family or hired) influences output and increases productivity. This corroborates with Olagunju et al. (2007) and Adenuyi et al. (2010). In addition, years of experience had a positive relationship with output level. This implies that as year of experience in fish farming increases, better management practices are adopted and output is positively influenced (Ideba et al., 2013).
Mobile tank system
For mobile tank system, the linear functional form was chosen as the lead equation based on its econometric and statistical procedures. The coefficient of determination (R 2) was 0.998 (Adjusted R2 = 0.997). This implies that the included variables were able to explain about 98% of the total variations in fish output in mobile tank. The F-ratio was 798.55 and significant at 1% level implying that the joint effects of all the included variables were significant.
From the result, three of seven variables were significant. The variables were quantity of feed, educational level and years of experience. Quantity of feed had positive coefficient and significant at 1% level.
This implies if fishes are properly fed with appropriate quantity of feed at any given time, weight of fishes increases as well as market value for fish. This is in line with Ideba et al. (2013). Years of experience and educational level were significant at 5% level, implying that years of experience and educational level had positive relationship with output. Fish farmers with longer years of experience would be early adopters of innovation and will be willing to pass on innovation to intending farmers (Igoche et al., 2019). Educational level had positive coefficient and relationship with output, implying that farmers with good education can be more creative, innovative and imbibe good record keeping in farm business. This is in line with Olasunkanmi et al. (2012). This result corroborates favourably with the work of Dey (2002) and Lawal and Idega (2004), who reported that education improves the drive for new innovations and to a large extent increase farmer’s profit.
Average revenue, variable cost, gross aquaculture production systems in the study area
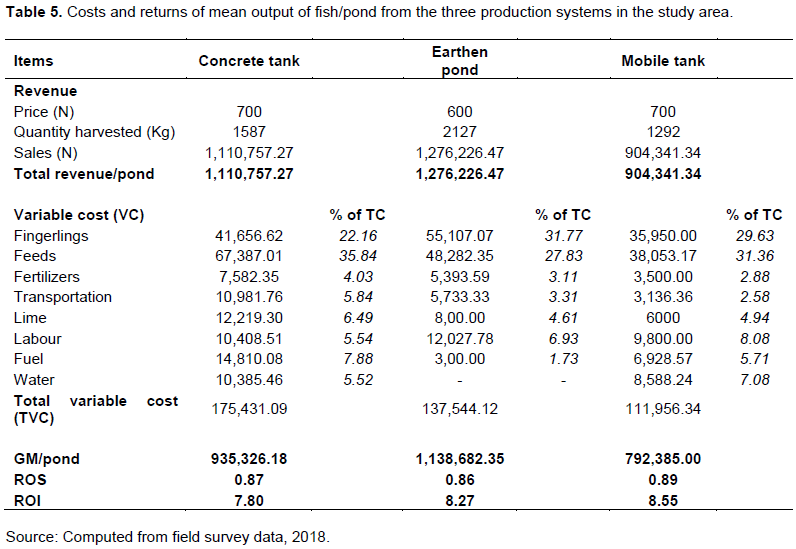
The study examines the average costs and returns /pond from the various production systems. The costs and return analysis is presented in Table 4. The result shows that the cost of feeds accounted for the largest proportion (35.84 and 31.36%) for concrete and mobile tank farmers due to high cost of feed. The reason could be that concrete and mobile tank farmers need complete feed supplies which contains all the nutrients require for optimal growth and therefore more money was spent on feeds. This result is in line with Adewumi (1994) and agrees with Igoche et al. (2019) who reported that the cost of feeds consumed more than half of the total cost of production in catfish farming, fishes require less artificial or supplementary feed.
From Table 5, it is observed that an average total variable cost (TVC) of N175,431.09; N137,544.12 and N111,956.34 per pond were incurred by the farmers, while mean revenue/pond of N1110, 757.27, N1,276,226.47 and N904,341.34 were realized with an average gross margin/pond of N935,326.18; N1,138,682.35 and N792,385.00 for the aquaculture production systems.
Profitability of fish per pond in the study area
Gross margin per pond size
The mean gross margin in the concrete, earthen and mobile production systems were N935,326.18, N1,138,682.35 and N792,385.00 (Table 5). The ANOVA result shows that there is a significant difference (P > .01) among the mean gross margin per pond size from the different production systems at the 1% level of significance (Table 6).
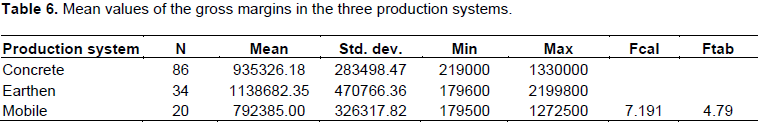
Equally, the result shows that the gross margin from the earthen pond was significantly higher than the gross margins of other production systems. The higher gross margin could be as result of lowest operating cost in the earthen pond system. This result is in line with Ugwumba and Okoh (2010) who ascertained that the low cost of operation in the earthen pond system could be as a result of earthen pond farmers minimizing the cost of feeds and employing family labour for their enterprise. In addition, the result confirms the findings of Adewuyi et al. (2010), Ogbe et al. (2018) and Olagunju et al. (2007), who found that gross margin was highest in earthen pond than concrete tank because earthen pond farmers had minimum variable cost of production.
Rate of return on investment per pond
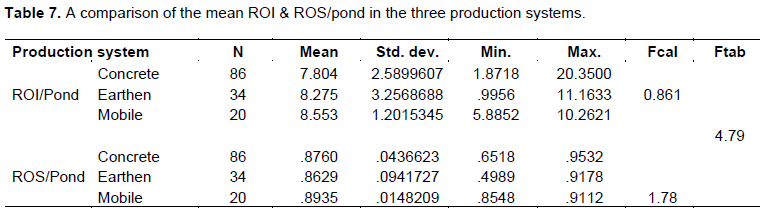
The mean rates of return on investment (ROI) in the concrete, earthen and mobile tank production systems were 7.80; 8.27 and 8.45 respectively (Table 7). This implies that on every one naira invested in fish production the farmer would make a return of ₦7.8, ₦8.2, and ₦8.4 from the different production systems however the mean ROI of fish per pond from the three aquaculture production systems were not significantly different (Fcal 0.861<4.79).
From the result, all the production systems had reasonable return; and no production system was higher in terms of ROI. This suggests that all the production systems showed considerable levels of profitability. This is in line with Ugwumba and Okoh (2010) who reported that catfish production using either the concrete or earthen pond system is profitable, and confirms the findings of Emokaro and Ekunwe (2010).
Return on sales
The mean return on sales (ROS)/pond is 0.87, 0.86 and 0.89, which implies that on every one naira earned from sales, the farmer would have 87, 86 and 89k respectively for concrete, earthen and mobile tank. The returns on sales/pond among the three production systems in the study area were not significantly different (Table 7), and therefore indicate profitability in fish farming among the three production systems. This result is in line with Ekine et al. (2019), and corroborate with the work of Emokaro and Ekunwe (2010), who reported that catfish farming is a profitable business.
CONCLUSION
On the basis of the findings, the study concluded that aquaculture production is economically viable and profitable to fish farmers in the study area irrespective of the type of production system used. The major challenges facing the farmers are high cost of feeds and fingerlings for stocking the ponds. Recognizing the contribution of fish production in alleviation of rural poverty, livelihood improvement, provision of household income and improvement in nutritional value, there is need to utilize and explore untapped potentials in the sector to address factors hindering its expansion. It is therefore pertinent to say that government and relevant stakeholders create an enabling environment to enhance fish production in the study area which will lead to a multipliers effect across the state.
RECOMMENDATION
The following recommendations are advanced:
1. Since the output of fish and gross margin in earthen pond was higher than concrete and mobile tank systems, government should establish fish farm estates in areas suitable for earthen pond production to efficiently utilize the available natural resources for expansion of fish production in the state.
2. Government should build functional hatcheries and feed mill in fish farm estates and encourage farmers to operate in clusters for effective and efficient utilization of common good element for massive production of fish.
3. Aggregation centers is recommended in fish farm estates to encourage off-takers and out-growers scheme.
CONFLICT OF INTERESTS
The authors have not declared any conflict of interests.
REFERENCES
|
Adebayo IA, Adesini SA (2008). Comparative assessment of the profit margin of catfish reared in concrete tank and earthen Pond. African Journal of Agricultural Research 3(10):677-680. |
|
|
Adeogun OA, Alimi TA (2014). Comparative Analysis of Profitability and Technical Efficiency of Fish Farming using Different Rearing Techniques in Nigeria. Asian Journal of Agricultural Extension, Economics and Sociology 3(5):405-418. |
|
|
Adewumi MO (1994). Productivity and efficiency in fish farming enterprise: the case of Kwara State of Nigeria. Journal of Rural development and administration 26(5):26-40. |
|
|
Adewuyi SA, Philip BB, Ayinde IA, Akerele D (2010). Analysis of profitability of fish farming in Ogun State, Nigeria. Journal Human Ecology 31(3):179-184. |
|
|
Adikwu IA, Yusuf AY (1997). Use of waste of agro and agro-allied activities in the nutrition of african catfish-clarias gariepinus'. Proceedings of 28th Nutritional Conference of Society of Nigeria pp. 65-68. |
|
|
Dauda AB, Ibrahim HI, Bichi AH, Adenike ST (2017). Assessment of Fish Farming Practices, Operations, Water Resource Management and Profitability in Katsina State, Nigeria. Journal of Northeast Agricultural University 24(4):89-96. |
|
|
Ekine DI, Ewubare DB, Ogu PI (2019). Profitability Analysis of Concrete and Earthen Ponds Catfish Production Systems in Rivers State, Nigeria. International Journal of Economics and Financial Management 4(1):2545-5966. |
|
|
Emokaro CO, Ekunwe PA (2010). Profitability and viability of catfish farming in Kogi State, Nigeria. Research Journal of Agricultural and Biological Sciences 6(3):215-219. |
|
|
Food and Agriculture Organization (FAO) (2003). Supplement part presented at the workshop and Exchange of views in fiscal reforms for fisheries. To promote growth, poverty Eradication and sustainable management, Rome fisheries report P 732. |
|
|
FAOSTAT (2019).Food and Agriculture Organization of the United Nations. |
|
|
Ideba EE, Otu WI, Essien AA, Okon IE, Udoh ES (2013). Economic Analysis of Fish Farming in Calabar, Cross River State, Nigeria. Greener Journal of Agricultural Sciences 3(7):542-549. |
|
|
Igoche LE, Makwin F, Akpenseun TT, Kaye J, Oyedapo FA (2019). Assessement of Fish Farming in Plateau State, North Central Nigeria. Asian Journal of Fisheries and Aquatic Research 4(1):1-10. |
|
|
Ikeh SE (2007). Fish Farming in Ponds: A Farmer's Guide. Enugu: Jonemal Creations. |
|
|
Lawal WL, Idega EO (2004). Analysis of fish marketing in Benue State. Paper presented at meeting of Annual Conference of the Association of Agricultural Economist (NAAE) Ahmadu Bello University, Zaira on 3-5th November, (2004). |
|
|
Nwuba LA, Onuoha E (2006). Fish Farming in the Tropics: A Functional Approach. Awka, Nigeria. Maxi Print. |
|
|
Ogbe FO, Idoko DA, Ani DP (2018). Comparative Analysis of Technical Efficiency of Fish Farmers using Concrete and Earthen Pond Systems in Makurdi Metropolis of Benue State, Nigeria. International Journal of Business Management and Economic Review 1(5):2581-4664. |
|
|
Olagunju FI, Adesiyan IO, Ezekiel AA (2007) Economic viability of catfish production in Oyo State, Nigeria. Journal of Human Ecology 21(2):121-124. |
|
|
Olasunkanmi JB, Omitoyin BO, Ipinmoroti MO (2012). Social Structure of Fish Farmers in Osun State, South-Western Nigeria. Biological and |
|
|
Olukunle O (2004). Homestead Pond Management John Arches (publishers) Ltd, Ibadan Nigeria: 978-36421-89. |
|
|
Omotosho FO, Fagbenro OA (2005). The Role of Aquaculture in Poverty Alleviation in Nigeria. World Aquaculture 36(3):19-23. |
|
|
Schram E, Van der Heul JW, Kamstra A, Verdegem MCJ (2006). Stocking density-dependent growth of Dover sole (Solea solea). Aquaculture 252(2):339-347. |
|
|
Tsue PT, Lawal WL, Ayuba VO (2012). Profit Efficiency among catfish farmers in Benue state, Nigeria. African Journal of Food, Agriculture, Nutrition and Development 12(6):120-142. |
|
|
Ugwumba CO, Okoh RN (2010). A comparative profitability analysis of African (crariid catfish farming in concrete and earthen pond. Journal of Research in National Development 8(2):233-240. |
|
Copyright © 2024 Author(s) retain the copyright of this article.
This article is published under the terms of the Creative Commons Attribution License 4.0


