ABSTRACT
The annual yield of kernels in a population of macadamia (Macadamia integrifolia MAIDEN and BETCHE) were assessed with the aims of identifying the best genotypes relative to this trait to establish a base population for breeding program and focusing in the macadamia crop yield increase. Kernel production from 46 plants of 23 genotypes at different ages was analyzed using mixed models with REML/BLUP methodology by WOMBAT software. Age of the plant has direct and significant association with the production during the juvenile period. Estimated heritability was low. The genotypes IAC-920, HAES 741-MAUKA, HAES 344-KAU and AFRICANA are highlighted by different selection strategies, weighted by genotypic and/or phenotypic value. By the first criterion it was also stand out the genotypes HAES 791, GUARANI I, HAES 816, PALMEIRAS, IAC-412-B, GUARANI II, 772, DOROTHY and FLOR ROSA MG and the genotype IAC-412-B by the second criterion of selection. These results of this study demonstrate the importance of using BLUP predictors as a tool for breeding programs in this case study.
Key words: Macadamia integrifolia, genotypic value, yield, kernel, REML/BLUP.
Macadamia (Macadamia integrifolia) is an arboreal species belonging to the Proteaceae family. The natural habitat is the east coast of Australia distributed in Queensland and New South Wales (Johnson, 1954; Smith, 1956). The macadamia geographical distribution includes Australia, USA, Hawaii, Africa, Guatemala, Costa Rica, Colombia, Paraguay and Brazil (Dierberger and Marino, 1985). The main commercial product of macadamia is the kernel, which are classified into different grading for different consuming markets. The refined flavor of kernels has aroused the interest of international markets for consuming in natura, roasted as snack or as a fine ingredient in the chocolate industry. The second grade quality kernels from the processing line are destined for oil extraction to be used in the cosmetics and pharmaceutical, its highly valued
(Stephenson, 2005). Macadamia was introduced into Brazil in 1931 by Henrique Jacobs (Simão, 1998).Since then it has spread throughout the country to become an important agribusiness commodity due to international demand of the different consumers markets. In 2012, Brazil assumed the 7th position among producers of macadamia in the world, with largest production situated in São Paulo State (Poltronieri et al., 2005). Macadamia breeding program began in Brazil in the 1940’s as an initiative of Instituto Agronômico de Campinas (IAC) using seed imported from Hawaii (Sobierjaski et al., 2006).
Although macadamia breeding began more than 70 years ago there is little information available on the characterization of genetic variability of the genotypes used in Brazil. One of these initial actions in the current breeding program is the evaluation and characterization of superior genotypes. However this task is slow and arduous when working with a perennial tree crop like macadamia with a long juvenile period. Macadamia species have a long (12 years) juvenile period (Pimentel, 2007), which together with a lack of genetic information motivates breeders to study the relationship between agronomical and genetic traits for developing breeding strategies. Breeding programs commonly employ repeated cycles of selection and recombination of genotypes from existing breeding populations and germplasm collections (Peace et al., 2003). In the beginning of the macadamia breeding program is necessary to establish genotypes which will be used as potential parents in new recombination. The second stage is clonal the selected candidate cultivars from the progeny trials. Another selection of parents for mating to produce the next breeding generation is established, maintenance and assessed for selecting cultivars for commercial release (Hardner et al., 2009). Breeding programs commonly employ repeated cycles of selection and recombination of genotypes from existing breeding populations and germplasm collections (Peace et al., 2003).
For development of new cultivars, the knowledge of interest genetic characteristics is crucial. One of the ways to identify the individuals carrying desirable genes is the genetic evaluation of selection candidates, which must be grounded in their additives genetic values, for use in recombination, and in genotypic values to be reproduced. This requires the estimation of additive and non-additive genetic variance, for the sexual and asexual reproduction respectively (Cruz and Carneiro, 2003). ANOVA (Analysis of Variance) and technique REML/BLUP (Restricted Maximum Likelihood/ Best Linear Unbiased Prediction) are the main procedures to estimate genetic parameters in testing and predicting of progenies. When unbalanced data sets are used, such as genetic selection procedure, the classical ANOVA models are inadequate, because estimated differences are biased (Mcgilchristt, 1994; Henderson, 1975).
Henderson (1973) has introduced the mixed models methodology, which includes fixed and random effects, serving both to estimate averages of blocks by the Generalized Least Squares (GLS) method, and to predict additive genetic values, in tests of half-sib progeny. The restricted maximum likelihood method in the mixed models is very important by generate unbiased estimates of parameters (Henderson, 1973). The REML/BLUP method estimates fixed effects as the Best Linear Unbiased Estimator (BLUE) and, simultaneously, predict the value of random genetic effects (BLUP) and random effects uncorrelated included in this model (Resende, 2002), without the necessity of a classical statistical design.
The objective of this study was to identify the best genotypes relative to the annual yield of kernels in a population of macadamia germplasm, using mixed models, for grouping individuals aiming to establish a base population for breeding program and to improve results in the production systems based on vegetative propagation.
For this study the nut tree crops were used from a commercial orchard managed by the Macadamia Brasilis Industry. The annual yield for each tree was expressed in kilograms (kg) during the three years of the study. The harvest data was recorded from an orchard, four kilometers from Itapira in the subtropical region of São Paulo State, Brazil. Average annual temperature is 26°C, 72% relative humidity and 1390 mm rainfall. The trial consisted of 46 individuals of different ages grafted onto selected root stocks, located at six different sites on the orchard, from the germplasm collection, comprising 23 genotypes. Each orchard was installed in different year. 344, 920, 920x, 246, 412B, 741 at Velha/Coqueiro was planted in 2000. In 2001 was established the orchard Chanflora with the genotypes: 920x, 246, 741, 920, Camp B and 344. The Organica orchard was implanted in 2002 with the genotypes: 344, 741, 920 and Camp B. In 2003 the Porteira orchard was planted with 695, Cannon, Africana and Guarani I. The Mangueira Esquerda orchard was set up in 2004 with 772, 791, 814, 849, Camp B, 920-x, 920, 816 genotypes. 842, 920, 344, Camp B, 849, 920x was established in 2004 at Mangueira Direita orchard. In 2005, Guarani II, 788, Dorothi, F. Rosa MG was planted at Porteira orchard, 741 Edson in 2005 at Velha/Coqueiro and Palmeiras in 2008.
Information was recorded from harvests (January to Last June/First week of July) of 2009, 2010 and 2011, including plant identification, location (planting site), planting date and, for each picking, date and weight of harvest. The last two items were used to determine the annual kernel production and the number of pickings. Environmental effects on phenotypic expression were reduced by: standardizing tree spacing (6 m between plants and 8 m between rows) in all locations; pruning side branches or inside the canopy for better lighting and aeration (held during the month of June) and spraying in pre-bloom for preventing pests and diseases. The collected data are unbalanced due to several factors: starting year of harvesting for each plant, replication of the experiment subjects, presence of the genotypes at the sites and numbers of pickings per year per individual.
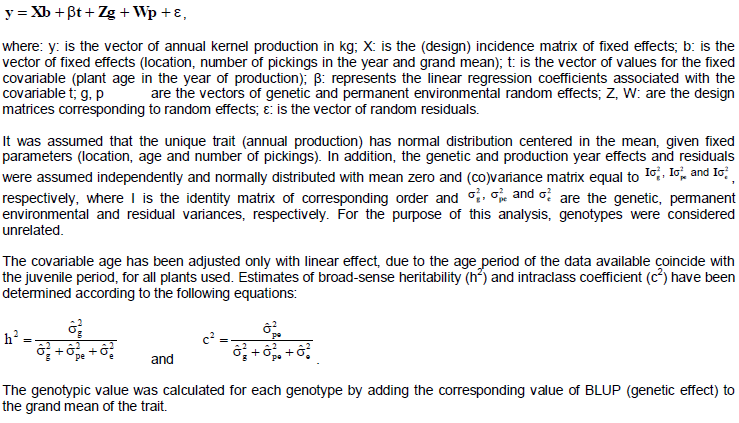
The trait annual production was analyzed by mixed linear model methodology using REML implemented by WOMBAT software (Meyer, 2007), assumed the following model:
In the present study, the variance components, the means of annual individual production and corresponding tree age, the indicators of the Logarithm of the Likelihood function (Loge L), the Akaike’s Information Criterion (AIC) and Bayesian Information Criterion (BIC), were estimated (Table 1).
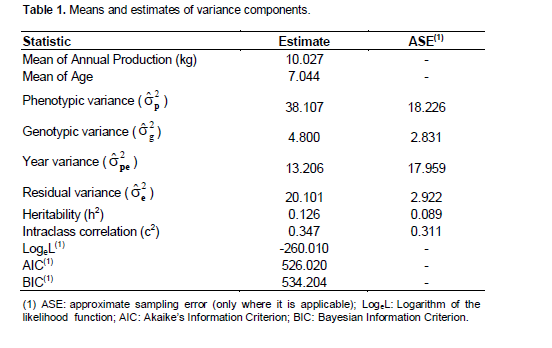
The heritability coefficient estimated by genetic parameter was low (12.60%) which shows that much of the variation of the characteristic among individuals is due to environmental differences and interactions among genotypes and environments. The estimate for the intraclass correlation coefficient (c2 = 34.6) was relatively moderate (Resende, 2002). Hardner et al. (2002) reported low heritability in a broad sense for the production of plants (6% < H2 < 22%). There is little published works about studies assessing macadamia heritability in relation to production. However studies conducted on characteristics that influence the final factor production, such as fruit size and nut size, reported that the heritability is high for these traits (Hardner et al., 2001; 2009). In these studies, difference among cultivars was reported, confirming the existence of genetic variation which is difficult to appraise. This is attributed to the major selection objective, usually on the basis of phenotypic performance, without the control of environmental variation, implying low accuracy in the estimation of the genetic effects, especially for traits of low heritability like kernel production.
The 23 genotypes are classified in decreasing order of genotypic performance (Table 2) by BLUP of random effects represented in the model. Predictors for relative genetic effect are shown in Table 2 and predictors for relative effect of production year match to 2.328 kg in 2009, 1.4 kg in 2010 and -3.728 kg in 2011. The knowledge of the genetic and phenotypic variance has a significant effect in the premature selection (Carvalho et al., 2008). By adopting this order, each genotype can be checked in relation to phenotypic value (average annual production) and genotypic value (BLUP), along with genotypic and phenotypic relative performance.

A comparative approach between the genotypic and phenotypic values is shown in Figure 1. The first quadrant highlights the five genotypes that simultaneously represent the best performances with respect to genotypic and phenotypic values. The contradictory results between the genotypes 246 (fourth quadrant) and AFRICANA (first quadrant) can be used to emphasize the differences revealed by BLUP usage, given that although both of them presented good phenotypic performance, its genotypic values are opposite. The superior phenotypic value produced by the interaction genotype versus environment does not guarantee to know the genetic value for these individuals. Thereby, the genotypic value predictor obtained by BLUP allows the breeder to select the superior genotypes which will maximize the possibility of a genetic progress in the selection (Sölkner et al., 2008).

An exploratory analysis using the Spearman correlation among the observed means (phenotypic value) and BLUP obtained for genotypes (genotypic value) showed low correlation coefficient (r=0.2065) and low level of reliability of this association (t test not significant at 5%). This represents the absence of a strong association between the phenotypic and genotypic values in this evaluated population and strongly demonstrates the importance of using the BLUP for the prediction of genetic values. Three groups of interest are presented in Table 3 to explore the best genotypes, correlating them to equivalent groups with highest phenotypic means, by composition and order. In the highlighted central columns are included the elements related to criteria for group formation and correlations among the selection criteria. The resulting classes are shown in two columns left and right, including the group average phenotypic value and the relative degree of performance corresponding to the selection criterion (genotypic or phenotypic). For each criterion, the groups were composed by seven, 10 and 13 genotypes with the best performances, determined by BLUP or average production, respectively. Comparing equivalent groups between the two selection criteria in terms of composition, result in coincidences of 57, 50 and 54% of its members, respectively. These degrees of coincidence are obtained both in the overall assessment of the three years, as the separate assessment for each year of production, except for the comparison of groups of seven individuals in the first crop, with only 29% of coincidence. Selection based only on individual phenotypes can lead to discarding genotypes that have a high genotypic value for the trait. In the case of the group of top 10 elements, individuals such as 791, GUARANI I, HAES 816, PALMEIRAS and GUARANI II would be discarded. Analyzing the results for genetic value (Table 3), it can be observed that the groups selected have average rates of relative performance (70 to 75%) higher than the equivalent rates of selected groups by phenotypic value (30-50%).
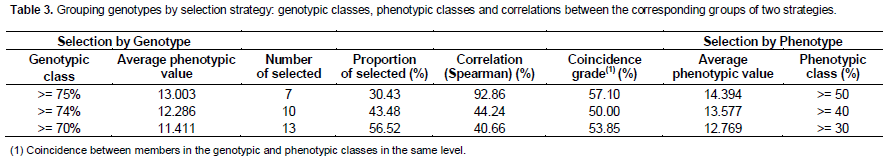
Two approaches must be considered to advise the selection of the best genotypes in this study: (a) the selection for vegetative propagation (SelecVP) and (b) the selection for establishment of a base population (SelecBP). Species that can be vegetative propagated allow increasing the efficiency of the selective process (Maia et al., 2011). This facility factor in the breeding program is essential for accelerate the propagation of superior genotypes and its variance, in special, for species which has a long time to obtain results about aimed characteristics. In the SelecVP case, aimed at formation of production orchards or its improvement, it is recommended the selection of individuals regarding the genotypes whose relative performances were estimated 75% or more (first genotypic class as characterized in Table 3). This strategy represents the selection of approximately 30% of the evaluated genotypes and results in the following top seven genotypes (Table 2): IAC-920, HAES 741-MAUKA, HAES 344-KAU, AFRICANA, HAES 791, GUARANI I and HAES 816. Among these it is found two of the mostly cultivated genotypes: HAES 344 and HAES 741 (Wallace, 2012).
For the SelecBP case, aimed at implementation of a breeding program, the selected group should be expanded because the genetic variability is highly important for any breeding program, implying in a necessary reduction of the selection differential. Therefore, in the present case study, it is recommended to select genotypes by adopting the relative performance of 70% at least (third genotypic class as characterized in Table 3). With this strategy, the 13 top genotypes are indicated, representing approximately 57% of the evaluated genotypes. This includes those seven already listed and over the following six (Table 2): PALMEIRAS, IAC-412-B, GUARANI II, 772, DOROTHY and FLOR ROSA MG. In a study with a similar purpose and circumstances, but using big number of plants from 312 clones of Eucalyptus spp, Garcia and Nogueira (2005) has adopted a greater selection differential for representative clones from the best genotypes. Thus, the relative performances were bounded to 80%. The less restrictive selecting factors adopted in this macadamia study were fixed due to the small number of plants assessed.
Considering that the available data have limitations to get a better level of accuracy related to exclusively genotypic selection, a mixed strategy, more parsimonious, is also applicable, taking as criterion the combination of genotypic and phenotypic best performances simultaneously. Using this strategy, as noted earlier (Figure 1), the top five genotypes are: IAC-920, HAES 741-MAUKA, HAES 344-KAU, AFRICANA and IAC-412-B.
According to U.S. International Trade Commission (1998), the macadamia has its first crop economically viable between six to eight years after planting. Topp et al. (2012) emphasize the high cost for assessing macadamia yield and tried to develop a breeding strategy for reducing it for the macadamia breeding program. All plants used in this study were aged between six and 11 years in the final harvest of the evaluation period, except of the single individual of the genotype PALMEIRAS, three years old. For all plants, the harvest periods coincide with the juvenile period, when it is expected a direct relationship between increasing age and production growth. It is possible clearly infer the occurrence of this relationship in this study (Figure 2a). This finding was confirmed in the applied model by the highly significant (P=0.01) coefficient of 0.737 in the regression between covariable "age" and the trait "production". All plants suitable for group selection SelecVP were aged between seven and 11 years in the last year of harvesting and most aggregated to the formation of group SelecBP were younger, indicating that the results obtained are strongly related with the trait production.
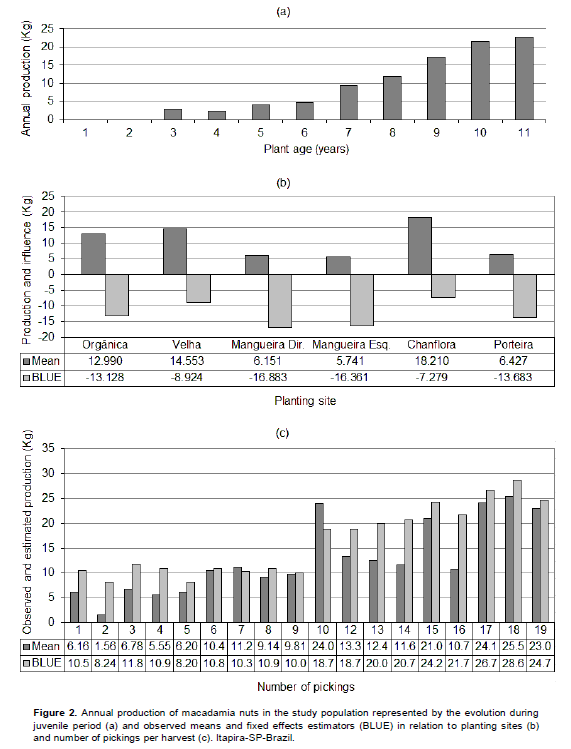
Although, the management practices have been identical in all locations (planting sites), the estimators for the influence of this component (Figure 2b) highlighted CHANFLORA and VELHA as the locations in the orchard with best performances for macadamia production. It was observed that both the locations, CHANFLORA and VELHA, had a high incidence of the best individuals, both in relation to the phenotypic mean and in relation to genotypic predictor (BLUP), highlighting the presence of the three best BLUP (IAC-920, HAES 344-KAU e HAES 741-MAUKA). Figure 2c allows checking the relationship between the effect of number of pickings per harvest in the average of production and in the used model. It is emphasized that, for this fixed effect, the model has presented estimators with production levels higher than the observed means, for nearly all the 18 layers of number of pickings.
The genotypes IAC-920, HAES 741-MAUKA, HAES 344-KAU and AFRICANA are highlighted by different selection strategies, weighted by genotypic and/or phenotypic performance. The genotypes HAES 791, GUARANI I, HAES 816, PALMEIRAS, IAC-412-B, GUARANI II, 772, DOROTHY and FLOR ROSA MG were the genotypes with the greater genetic value. The genotype IAC-412-B also stands out by the criterion of greater phenotypic value.
The age of the plant has direct and significant variation in production during the juvenile period, with an estimated average increase of 0.737 kg per year of age. The results obtained by mixed model methodology (REML/BLUP) and the correlation between genotype and phenotype demonstrate the importance of using BLUP predictors for genetic values in the selection of macadamia genotypes in the population studied.
The authors have not declared any conflict of interest.
To the Postgraduate Program in Plant Physiology of UFPel and CAPES, institutions that developed and funded the project, respectively. To the Company Macadamia Brasilis, by using their orchards and data collection to develop this study.
REFERENCES
Carvalho ADF, Neto RF, Geraldi IO (2008). Estimation and prediction of parameters and breeding values in soybean using REML/BLUP and Least Squares. Crop Breed Appl. Biotechnol. 8:219-224.
Crossref |
|
|
|
Cruz CD, Carneiro PCS (2003). Modelos biométricos aplicados ao melhoramento genetic, Viçosa, UFV. |
|
|
|
Dierberger JE, Marino NL (1985). Noz macadâmia: uma nova opção para a fruticultura brasileira. 1ª Ed. São Paulo, Nobel. |
|
|
|
Garcia CH, Nogueira MCS (2005). The application of the REML/BLUP methodology for eucalypt clones selection. Sci. Forestalis. 68:107-112. |
|
|
Hardner C, Peace C, Lowe A, Neal J, Pisanu P, Powell M, Spain C, Williams K (2009). Genetic Resources and Domestication of Macadamia. In: JANICK, J. (Ed.). Hort Rev. Wiley and Sons. 35:1-128.
Crossref |
|
|
Hardner C, Winks C, Stephenson R, Gallagher E (2001).Genetic parameters for nut and kernel traits in macadamia. Euphytica 117(1):151-161.
Crossref |
|
|
Hardner C, Winks C, Stephenson R, Gallagher E, McConchie, C (2002). Genetic parameters for yield in macadamia. Euphytica 125(2):255-264.
Crossref |
|
|
|
Henderson CR (1973). Sire evaluation and genetic trends. In: Animal Breeding and Genetics Symposium in Honor of J. Lush. American Society of Animal Science, Champaign, III, pp. 10-41. |
|
|
Henderson CR (1975). Best Linear Unbiased Estimation and Prediction under a selection model. Biometrics pp. 423-447.
Crossref |
|
|
|
Johnson LAS (1954). Macadamia ternifolia F. Muell. and a related new species. Proc. Linnean Soc. NSW 79:15-18. |
|
|
|
Maia MCC, Resende MDV, Álvares LCOVS, Maciel VT, Lima AC (2011). Selection of experimental clones of cupuaçu for the agro industry using mixed models Revista Agro@mbiente On-line. 5(1):35-43. |
|
|
|
Mcgilchristt CA (1994). Estimation in Generalized Mixed Models. J. R. Statist. Soc. B. 56(1):61-69. |
|
|
Meyer K (2007). WOMBAT – A tool for mixed model analyses in quantitative genetics by restricted maximum likelihood (REML). J. Zhejiang Uni-Sci B. 8(11):815-821.
Crossref |
|
|
Peace CP, Vithanage V, Turnbull CGN, Carroll BJ (2003). A genetic map of macadamia based on randomly amplified DNA fingerprinting (RAF) markers. Euphytica 134:17-26.
Crossref |
|
|
Pimentel LD, Santos CEM, Júnior AW, Silva VA, Bruckner CH (2007). Study of economical viability of the culture of macadamia nut in Brazil. Rev. Bras. Frutic. 29(3):500-507.
Crossref |
|
|
|
Poltronieri CF, Lourenzani AEBS, Silva AL (2005). Desafios e Potencialidades do Agronegócio da Macadâmia no Estado de São Paulo. In: XLIII CONGRESSO DA SOBER "Instituições, Eficiência, Gestão e Contratos no Sistema Agroindustrial", 2005, Ribeirão Preto. Anais. Sociedade Brasileira de Sociologia e Economia Rural. |
|
|
|
Resende MDV (2002). Genética biométrica e estatística no melhoramento de plantas perenes. Brasília. Embrapa Florestas. |
|
|
|
Sobierajski GR, Francisco VLFS, Rocha P, Ghilardi AA, Maia ML (2006). Noz-macadâmia: produção, mercado e situação no Estado de São Paulo. Inform. Econôm. 36(5):25-36. |
|
|
|
Simão S (1998). Tratado de fruticultura. Macadâmia. Piracicaba. FEAOLQ. |
|
|
|
Smith LS (1956). New species and notes on Queensland plants. Proc. Royal Soc. Queensland 67:29-40. |
|
|
Sölkner J, Grausgruber H, Okeyo AM, Ruckenbauer P, Wurzinger M (2008). Breeding objectives and the relative importance of traits in plant and animal breeding: A comparative review. Euphytica 161:273-282.
Crossref |
|
|
|
Stephenson R (2005). Macadamia: Domestication and commercialization. Chronica Hortic. 45(2):11-15. |
|
|
Topp BL, Hardner CM, Kelly A (2012). Strategies for breeding macadamias in Australia. Acta Hortic. 935(1):47-53.
Crossref |
|
|
|
U.S. International Trade Commission (1998). Macadamia Nuts: Economic and Competitive Conditions Affecting the U.S. Industry. Publication 3129, September. |
|
|
|
Wallace H (2012). Domesticating of Rainforest: Commercial Nuts from Rainforest Trees. Chron. Hortic. 52(2):16-18. |