ABSTRACT
Eighteen ISSR primers (between Simple Repeated Sequences) were used to estimate the genetic diversity of Angolan cassava populations in order to identify genetic variabilities and their potential to be used in the diversification of cassava crops in Angola. In order to do so, three populations from three Angolan provinces were analyzed (Cuanza Norte, Uige and Malanje), which totaled 40 genotypes. In total, 116 bands were amplified with 93.24% polymorphism and 6.4 markers per ISSR primer, on average. Nei’s gene diversity (H) and Shannon indices (I) applied to the analyzed accessions presented values ranging from H = 0.20 to 0.24 and I = 0.29 to 0.50 which are intermediate values. The total gene diversity (HT) was 0.3113, and it showed high heterozygosity in Manihot populations; this outcome indicated that these populations presented gene variability. ANOVA showed 10.41% total variance between populations and 89.59% within them. Molecular featuring revealed gene diversity in each of the assessed populations; there was gene structuring between populations.
Key words: Gene diversity, molecular markers, gene flow, polymorphism.
Cassava (Manihot esculenta Crantz) follows rice and maize in the rank of calories and is the third source of the most important calories in Africa, Asia and Latin America. The species is featured as food safety culture in these regions, since small farmers are responsible for most of its cultivation, mostly in marginal lands (FAO, 2014). Cassava is cultivated in more than 60% of the territory used for agriculture in Angola (Muondo, 2013). It is also part of the Brazilian historical context in food, social, economic and cultural plans. Subsistence cultures
mitigate starvation among the poorest populations in Brazil, mainly in family farms in the vast Northwestern semiarid region (Afonso et al., 2014).
Cassava can become the main raw material for a series of products manufactured with its shoots and roots, which can increase the demand for this species and help agricultural transformation and economic growth in developing countries (FAO, 2018). It is common to consume young cassava leaves in Africa; this dish is called quizaca in Angola; in Mozambique, it is known as matapa, the most popular Mozambican dish. In Brazil, cassava leaves are consumed in a dish called maniçoba (Afonso et al., 2014), its roots are boiled and fried, or eaten in the form of flour and crumbs, in filling and pirão (Oliveira, 2011).
The genetic structure of a species can be defined as the distribution of the genetic variability between and within, populations (Brown, 1978; Loveless and Hamrick, 1984). According to Hamrick (1982), genetic structure refers to the homogeneous distribution of alleles and genotypes in space and time. This process results from the action of evolutionary processes (migration, mutation, selection and genetic drift) that act in species and populations. Cruz et al. (2011) highlight that the knowledge about the genetic structures of a population enables predicting, or even clarifying, the ecological and genetic phenomena acting in it.
Studies on the genetic diversity of populations evidence that markers can be used for different means, such as to evaluate the potential of the genetic resources available, to generate connection maps and to detect quantitative trait loci (QTLs), in its association with agronomic features (Benko-Iseppon et al., 2003), as well as to detect polymorphism between genotypes in order to help plant enhancement programs (Ferreira and Grattapaglia, 2008).
Microsatellite and allozyme markers were the ones, among the many existing genetic markers, presenting mendelian inheritance mechanism and codominant expression. This process allows identifying the heterozygous and homozygous genotypes of individuals and became the main information to estimate different parameters of genetic interest (Ferreira and Grattapaglia, 1998; Grattapaglia, 2001; Souza, 2001). However, the most important difference between the two categories of markers refers to their levels of polymorphism. According to Estoup et al. (1998), microsatellite markers are more polymorphic than isoenzymes in natural populations showing more alleles and overall heterozygosity higher than 0.5.
Knowing the polymorphic information content (PIC) is extremely useful to determine the number and size of families adopted for QTL mapping, PIC is the probability of a parent to be a heterozygous in a locus and of the other parent to have a different genotype. Families can be chosen based on parental heterozygosity in order to improve marker information by selecting the most informative markers (Zhu et al., 2001). Accordingly, based on the scarcity of information about studies on the genetic structure of cassava populations in Angola, the aim of the present study was to estimate the genetic diversity of cassava populations in Angola through ISSR molecular markers. It was done in order to identify their genetic variability and potential to be used in cassava cultivation diversification in Angola.
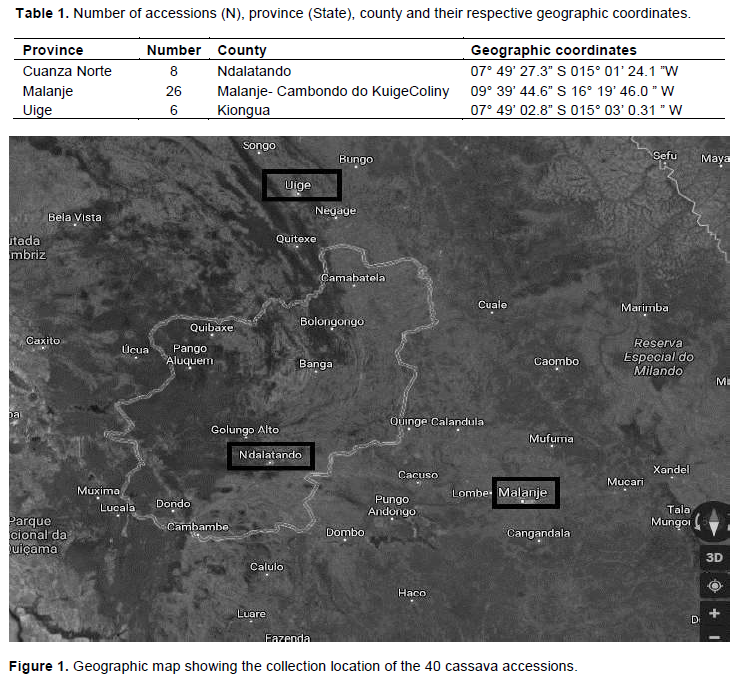
Leaf samples of 40 genotypes from three Manihot populations were collected in the Experimental Station of Malanje Food Company, located at latitude 8° 49’ South and longitude 13° 13’ West (IGCA, 2016), altitude 368 m and total area 8960 m2. According to the INAMET classification (2004), the climate in the region is sub-tropical humid with mean annual temperature of 26°C, thermal amplitude of 14°C, relative humidity between 80 and 85%, and mean annual rainfall between 1000 and 1200 mm.
Genotypes collected in each one of the three provinces (States) were the populations taken into account: Cuanza Norte (Ndalatando), Malanje and Uíge (Table 1 and in Figure 1). The collected samples were stored in aluminium paper, labeled and sent to Embrapa Cassava and Fruits Molecular Biology Laboratory in Cruz das Almas City, Bahia State, Brazil. Next, they were stored in freezer at -20°C until DNA extraction.
DNA was extracted through the CTAB method by Doyle and Doyle (1987), with modifications. The protocol encompassed 0.1 M of Trisat pH 8.0; 1.7 M of NaCl at 5 M; 20 m Mof EDTA at 0.5 M; 2.4% CTAB; 2.0% (p/v) PVP-40 and 0.4% (v/v) of pre-heated β-mercaptoethanol at 65°C in water bath. The DNA stock was stored in freezer at -20°C after its extraction. Total DNA concentration was estimated in 1% agarose gel stained in Blue Juice. Next, DNA was diluted and stored in gelatin until its use. Polymerase Chain Reaction (PCR) was conducted with 32 Embrapa ISSR primers. The PCR mix (Promega Kit) was composed of 2.5 mM MgCl2 (25 mM); 200 mM dNTP (2.5 mM); 1.0 X Go Taq 5X; primer (0.4 µM); 2.0 U Taq (1 U/ 0.2 µl); DNA (15 ng) and milli-Q water at final volume 15 μL per sample. PCR reactions were generated in automatic thermocycler Applied Biosystems with 96-well blocks, when samples were initially denatured at 94°C for 3 min. This process was followed by 39 amplification cycles, each sample was subjected to 94°C cycles for 40 s, to 72°C for 1 min and 72°C for 5 min. The process was over after the cycles at 72°C for 5 min and cooled at 4°C. PCR products were subjected to electrophoresis in horizontal cube, in 3% agarose gel (p/v) buffer and stained in ethidium bromide (1.5 ng/µL) and in reaction buffer 15 ng of DNA, 0.4 primer, 200 mM dNTP 2.5 mM, 1.0 X Go Taq 5X, 2.5 mM MgCl2 25 mM, 2.0 U Taq (1 U/0.2 µL) and milli-Q water in order to complete the reaction volume at 100 V for 3.5 h; 1Hb molecular weight markers were used (Ladder Invitrogen Norgen). The gels were removed from the cube and photographed under ultraviolet light to reveal DNA fragments stained in Blue Juice after the electrophoresis. Primers presenting the largest number of fragments and good resolution were selected; results of primers that showed low intensity or low definition bands were discarded. A binary matrix was elaborated based on the presence (1) and absence (0) of loci.
Initially, the potential of markers to estimate the genetic variability of genotypes was examined by measuring marker information through band counting. Band features of indicators such as total number of bands (TNB), number of polymorphic bands (NPB) and the percentage of polymorphic bands (PPB) were obtained. Three indices were used to determine the most informative ISSR primers: polymorphic information content (PIC), marker index (MI) and resolution power (RP).
Polymorphic information content (PIC)
PIC values for each ISSR locus were calculated through:
PICi = 2ƒi (1 – fi)
Where PICi is the polymorphic information content of primer i, fi is the sequence of amplified loci (presence of bands) and 1-fi is the frequency of null alleles (Roldan-Ruiz et al., 2000).
Marker index (MI)
MI was calculated based on Varshney et al. (2009), wherein:
MI = PIC × EMR
The effective multiple relation (EMR) was calculated as follows:
EMR = n × β,
Where n= total of indicator amplification fragments / total no. of assessed fragments; β = number of polymorphic fragments/total number of amplified fragments.
Resolution power (RP)
RP was calculated according to Prevost and Wilkinson (1999):
RP = ∑Ib,
Where, Ib represents the polymorphic loci, Ib can be turned into a 0-1 scale through the following formula:
Ib = 1 - (2 × |0.5 - p|)
Where, p is the proportion of genotypes presenting the locus.
Firstly, 10 primers presenting higher values for each one of the calculated indices (PIC, MI and RP) were identified to allow the selection of the 10 best ISSR primers for genetic studies focused on cassava varieties. Primers were selected after this identification by using the following criteria: (1) coincident primers among the three best ones for the three indices (PIC, MI and RP); (2) coincident primers among the three best ones for the two indices (MI and RP); (3) primers presenting the highest RP values; (4) primers presenting the highest MI values.
Genetic diversity parameters such as number of effective alleles (Ne), number of observed alleles (Na), genetic diversity of Nei (H) and Shannon index (I) were calculated in the POPGENE software version v.1.32 (Yeh et al., 1997). The analysis of variance was performed in order to check the existing genetic relation between populations and between accessions within each population in the Manihot collection. The significance test of the analysis of variance (ANOVA) was conducted with 1000 permutations calculated in the ARLEQUIN software Ver. 3.1 (Excoffier and Lischer, 2005).
The Bayesian grouping analysis was conducted in the STRUCTURE software, v. 2.3.4 (Pritchard et al., 2000) in order to find the number of genetic groups. The tested K number ranged from 1 to 10. The ΔK method by Evanno et al. (2005) was used to find the best K, as implemented in the Structure Havervester (Earl and Vonholdt, 2011).
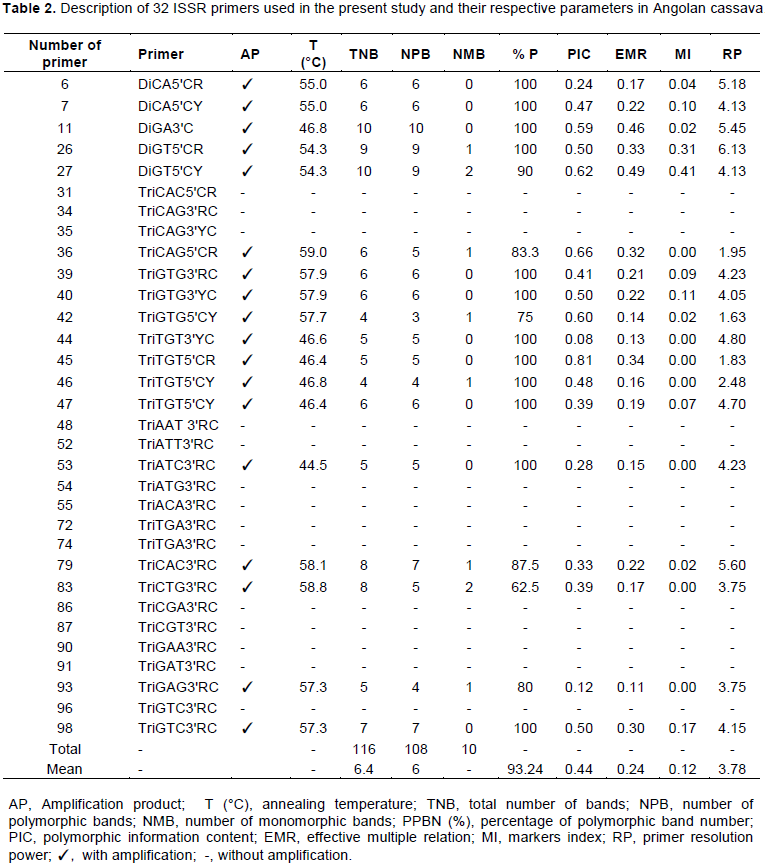
Thirty-two primers were tested and 18 of them were selected for the genetic diversity study (Table 2), since they were the most informative ones (high polymorphism indices and resolution adequate for the analyses). The selected primers generated 116 bands in total, bands ranged from 4 to 10, thus totaling 6.4 (93.24%) bands per primer, on average; this number indicated increased genetic variability (Table 2). Primers 11 and 27 were the most informative ones and recorded 100 and 90% polymorphism, respectively, and the largest number of bands (10). Primers 42 and 46 (with four bands each) showed the lowest number of bands (Table 2).
PIC recorded mean value of 0.44, with variation ranging from 0.08 (primer 44) to 0.81 (primer 45) (Table 2). MI values of the primers used in the present study ranged from 0.00 (primer 36) to 0.41 (primer 27); mean value of 0.12 (Table 2). Primers 26 and 27 recorded the highest MI values, although primer 27 recorded the highest MI value and was not selected in this study based on moderate PIC values. RP values ranged from 1.63 (primer 36) to 6.13 (primer 26). Primers 6, 7, 11, 26, 27, 36, 39, 44, 53 and 79 presented the highest RP values.
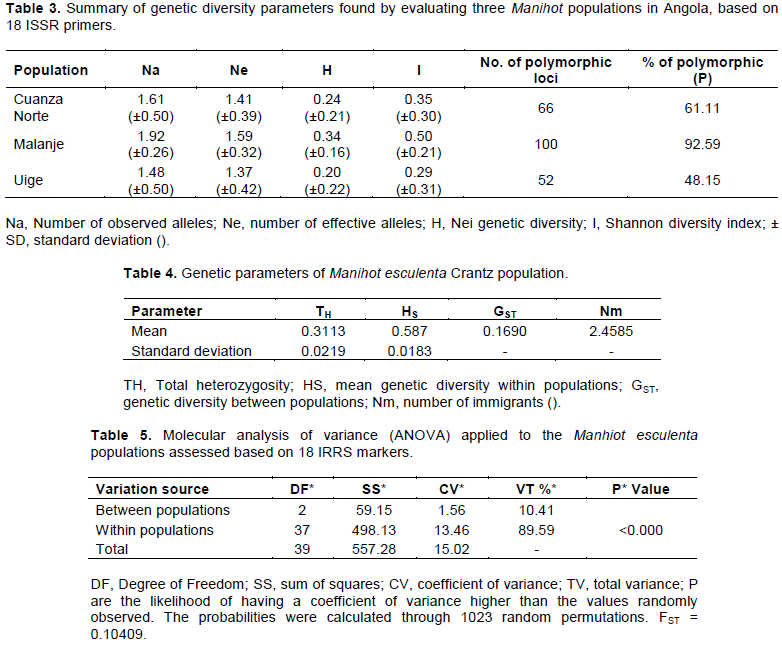
The estimated values of genetic diversity indices in M. esculenta populations are shown in Table 3. The percentage of polymorphic loci (P) was high and recorded 48.15% in the Uíge population, 61.11% in Cuanza Norte and 92.59% in Malanje. The number of alleles (Na) in the assessed populations ranged from 1.48 to 1.92 and the effective number of alleles (Ne) ranged from 1.37 to 1.59. The Shannon index (I) ranged from 0.29 to 0.50 (Table 3). The distribution of genetic variability between and within, populations was calculated based on Nei (1973) (Table 4). The genetic divergence was 0.1690 and it showed that 16.90% of the genetic variability is observed between populations and that 83.10% of the total genetic diversity (HT) calculated through Nei (1973) reached the estimated mean 0.3113. The observed gene flow value in this study reached 2.4585 (Table 4).
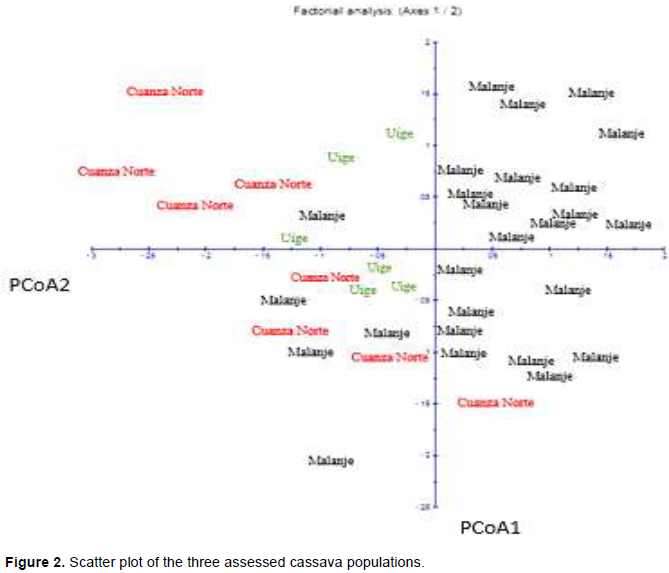
The molecular analysis of variance (ANOVA) applied to the three populations confirmed that most of the genetic variation is within populations (89.59%), 10.41% of the genetic variation was between populations (Table 5). There was significant genetic differentiation (P <0.001) between populations. The inter-population genetic divergence value (FTS) observed in the current study (Table 5) was 0.1041. FST values between 0.05 and 0.15 suggested moderate genetic differentiation between populations (Wright, 1978). The analysis of the main coordinates (PCoA) was calculated based on coefficients of dissimilarity; its result is graphically presented in Figure 2. The two axes presented 51% total variation, the first axis (PCoA1) recorded 28.54% total variation and the second one (PCoA2), 22.46% of it.

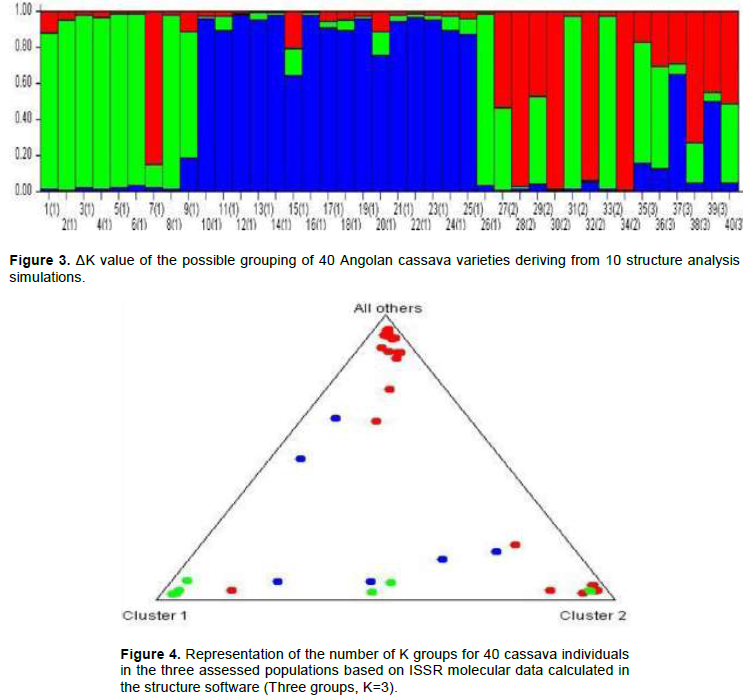
Based on Figure 4, when K=1, genotypes from regions Cuanza Norte, Malanje and Uìge were formed by three great ancestor groups, basically: green, blue and red. Materials from Ndalatando County belonged to group green; group blue was formed by genotypes from Kalandula and Quizenga counties and from Cambondo Colony, whereas Quitoque and Kiongua colonies provided the genotypes in group red. The green group was formed by eight genotypes, group blue by 12 genotypes and the red one by five genotypes. When K=2, it was possible observing that the population in Malanje region basically remained in the Blue group, which is composed of eight genotypes. Although the marker is dominant, there is allelic richness when K=3, and there is allele sharing between one and multiple populations. This group was composed of genotypes from the Malanje and Uíge region and it allowed observing the formation of two ancestor groups: blue and red. Materials from Cambondo do kuige, Comuna do Lombe and Santa Maria colonies belonged to group blue, whereas genotype Mpelo from Quitoque colony belonged to group red. However, the Cambondo do kuige colony and the Lombe commune were formed by two genotypes: Gueti (39) and Kapumba (40), Muringa (36) and Kinzela (37), respectively, whereas Santa Maria and Quitoque colonies by one genotype, Ngana Yuculu (35) and Mpelo (38).
The descriptive analysis between M. esculenta populations was based on the amplification of ISSR markers. The selected primers generated 116 bands and this number indicated high genetic variability. Tiago et al. (2015) found 23 polymorphic bands (67.65%) by selecting 34 cassava ISSR primers presenting variation ranging from 1 to 10 and mean band 5.75 bands per primer. Turyagyenda et al. (2012) found 154 polymorphic bands by selecting 26 SSR primers for cassava grown in Uganda, which presented variation ranging from 3 to 11, and mean variation of 5.92 bands per primer. Hu et al. (2010) also observed high polymorphism and relative difference between populations in a study about the genetic variation among 13 Rheum tanguticum populations in China with 13 SSR markers by associating genetic distance with geographic distances. Costa (2010) assessed the molecular techniques applied to genus Hypericum and found high genetic polymorphism based on SSR markers.
The polymorphic information content represents the likelihood of finding the marker in its two states: absence and presence (Roldan-Ruiz et al., 2000). According to Xie et al. (2010), the PIC value of little informative markers ranges from 0 to 25 in little informative markers, from 0.25 to 0.5 in moderately informative markers and it is above 0.5 in markers presenting highly informative content. This value helps ranking the primers based on polymorphism-detection efficiency, which worked as a parameter to select the primers (Costa et al., 2015). Thus, as for the present study, it is possible considering that primer efficiency in indicating polymorphism between genotypes was moderate.
Similar results to those recorded in the current study were observed by Gonçalves et al. (2017), who found moderate PIC value (0.48) in sweet cassava populations by using ISSR markers. Kawuki et al. (2009) observed PIC values between 0.358 and 0.759 and mean value 0.571 by using ISSR markers in cassava germplasm from Africa, Asia and America. In a study about native Prunus armeniaca L. (Rosaceae) populations in Northeastern China, Li et al. (2013) found PIC values ranging from 0.15 to 0.27, and mean value 0.21 by using ISSR markers; primers were considered little informative. Costa et al. (2015) assessed natural mangaba populations (Hancornia speciosa Gomes) by using ISSR markers and found PIC values ranging from 0.26 to 0.44; primers were considered moderately informative.
Polymorphic information content (PIC) is taken into consideration and multiplied by the index that takes into account the effective multiple relations to calculate the marker index (MI). Primers 26 and 27 recorded the highest MI values. Although primer 27 recorded the highest MI value, it was not selected in the present study through the PIC values of markers. According to Tatikonda et al. (2009), there is no ideal specific MI value; thus, it is possible analyzing results recorded for this index by comparing the values of each primer used in the study, the best indices will always be the ones presenting the highest values.
Resolution power (RP) is a parameter that indicates the discriminating power of the marker (Tatikonda et al., 2009). Just as MI, there is no maximum RP value, since it concerns a sum of values. It was observed that primers presenting the best RP values also showed the largest number of fragments. It happens because the formula used to calculate these indices take into account the sum of lb values. Thus, primers capable of amplifying a large number of bands tend to present higher RP values than the ones amplifying a smaller number of bands.
Primer 26 also presented high PIC and MI values and this outcome indicates that this marker is quite informative for cassava. It stood out for its high PIC, MI and PR values. The highest MI and RP values were observed in primers 26 and 27, which were the most informative ones. Thus, the discrimination of all accessions can be conducted by the smaller number of primers through the adoption of the most informative primers: 26 and 27. Reduction in the number of primers not only leads to reduction in the time adopted for the analysis, but also to cost reduction (Varshney et al., 2007). According to Smith and Pham (1996), genetic diversity estimates based on dominant markers are sometimes lower than estimates made for co-dominant markers. However, Ge and Sun (2001) state that the general standard lies on detecting higher genetic-diversity levels through dominant markers in comparison to co-dominant markers.
Results about the number of observed alleles found in the present study evidenced that values ranged from 1.48 to 1.92. Agre et al. (2017) observed Na values from 0.23 to 1.0 and mean value 0.66 by using ISSR markers in cassava grown in the Republic of Benin. The Shannon index (I) was considered an intermediate value; according to Giustina et al. (2014), Shannon indices (I) vary from 0 to 1, wherein 0 means null gene diversity and 1 is the maximum gene diversity. Silva et al. (2016) assessed the genetic diversity estimated through microsatellite markers in commercial Cupuaçu crops and observed lower Nei diversity values (0.11) and Shannon index (I) (0.17) in comparison to values recorded in the current study. Nei genetic diversity index (H) values ranged from 0.20 to 0.24. Pádua (2011) assessed a Eremanthus erythropappus population by using ISSR markers and observed genetic diversity indices ranging from 0.26 to 0.38.
Genetic variability results showed that the highest genetic production was observed within populations (83.10%) and this result complied with Hamrick et al. (1991), who stated that there is more intra-specific diversity than inter-specific diversity due to factors affecting the geographic distribution. Genetic diversity, or heterozygosity, is the most used factor to estimate genetic variety since it is less sensitive to variations in sample size. Therefore, sample size becomes the most important parameter when it is compared to other parameters such as the percentage of polymorphic loci and the mean number of alleles per locus, besides its easy genetic interpretation (Brown and Weir, 1983). The result of total genetic diversity (HT) found through the Nei Index (1973) reached estimated mean 0.3113, and this outcome points towards high heterozygosity in Manihot populations. These values were considered high and they indicated that the variability between and within populations would contribute 31.13 and 68.87%, respectively. This value was close to that found by Teixeira et al. (2012), who worked with Campomanesia species populations by using ISSR markers. These authors observed mean value 0.365, and it confirmed that the populations presented genetic variability.
According to Loveless and Hamrick (1984), if the gene flow is restricted, populations would show high divergence. The value observed in the present study (2.4585) showed limited gene flow among the three assessed populations. This value was not enough to counterpoint the effects of genetic drift. This value should be higher than four migrants per generation (Nm> 4), so that the homogenizing effect of the gene flow overlaps the genetic drift (Slatkin and Barton, 1989; Hart and Clark, 1997). Wright (1931) states that gene flow values lower than 1 indicate genetic isolation. According to Wright (1951), gene flow values higher than 1 are enough to stop random allele losses within populations (drift effects). Estimates based on data from dominant molecular values in three cassava populations and calculated through ANOVA evidenced 89.59% genetic divergence, on average, within populations. Genetic divergence results in the present study showed 10.41% distribution between populations. These data are lower than the ones reported by Brandão et al. (2011), but they comply with the numbers recorded by Fernandes (2008), who assessed Caryocar brasiliense populations.
The GST value showed greater variation within populations than between populations and this outcome corroborated the ANOVA results. The evolutionary geographic and historical distribution plays a relevant role in genetic variation distribution between and within populations (Hamrick et al., 1992). However, this variation may depend on the presence or absence of certain alleles in geographic regions. The expectation is to observe that the greater the geographic distribution the greater the diversity of this species (Bozza, 2009).
The analysis of the mean coordinates (PCoA) was calculated based on coefficients of dissimilarity and graphically presented in Figure 2. The coordinates were calculated for the two first axes with negative Eigen values. The two axes represented 51% total variation; the first axis (PCoA1) represented 28.54% and the second one (PCoA2), 22.46%. Individuals grouped by geographic location indicated that, although they originated from different locations, they belonged to the three populations, except for the first coordinate, which was represented by individuals belonging to the Malanje and Cuanza Norte populations and for the second coordinate, with individuals belonging to Malanje, Uige and Cuanza Norte populations. A result similar to that recorded in the present study was found by Turyagyenda et al. (2012), who observed PCoA1 and PCoA2 values ranging from 23.56 to 20.06%, respectively, and 43.62% total variation by using SSR markers in cassava grown in Uganda.
The analysis of main components depicted the relations between different geographic areas, besides highlighting that the largest number of individuals corresponded to variety Malanje. This analysis showed wide dispersion of individuals and evidenced wide genetic variability distribution. These results also showed that most of the assessed individuals shared an important part of their genetic information. It was possible observing that there were some individuals in the three populations that got far from each other, and this outcome evidenced that these individuals are the ones that mostly contributed to the genetic variability.
The genetic structure in M. esculenta was characterized through Bayesian analysis, which took into account the separation of the total number of individuals in groups (clusters) by attributing a K number of populations to them and by assuming that these individuals present Hardy-Weinberg equilibrium (Figure 3). The ΔK of each K value was calculated (Evanno et al., 2005) and it allowed an easy interpretation of K, which is the most likely value to represent the number of groups in the data matrix. According to Vigouroux et al. (2008), if a certain variety presents a value higher than the arbitrary limit (80%) of its genome in a group, then, it belongs to the referred group.
Knowledge about the genetic structure of the populations is essential for the efficient use of genetic resources, as well as for better understating their evolutionary history (Venkovsky et al., 2007; Clement et al., 2010). Based on Figure 4, when K=1, genotypes from Cuanza Norte, Malanje and Uíge were formed by three great ancestor groups, basically, the green, blue and red ones. When K=2, it was possible observing that the population from Malanje basically remained in group blue, which was formed by eight genotypes. There was allelic richness when K=3, although the marker was dominant; therefore, there was allele sharing between one or the other populations. This group was composed of genotypes from Malanje and Uíge and presented the formation of two ancestor groups, basically the blue and the red ones.
These results suggested genetically defined groups that corresponded to the pre-defined regional groups. Therefore, farmers select cassava varieties for different purposes, and this outcome also highlights material exchange or gene flow between locations, mainly in Malanje, which was the most heterogeneous community within the group. Muhlen et al. (2012) used microsatellite markers and showed groupings by separating sweet from bitter cassava. Their results were similar to those recorded by Emperaire et al. (2003) and Elias et al. (2004), who detected geographic structuration in cassava varieties.
This analysis allowed predicting the structure of the populations and the ancestry of the individuals; thus, it contributed to the development of new varieties. The greatest concentration of genetic variability in Malanje and Cuanza Norte was likely related to the exchange and introduction of material in the crops. The observed variability can be explained by the adaptation of the species to different environments. There was low gene flow (Table 4) and wide genetic variability distribution within populations (Table 5); thus, it was possible confirming the genetic structuration between the assessed populations. According to Bozza (2009), the wider the geographic distribution, the greater the diversity of the species.
Molecular featuring evidenced genetic diversity within each assessed population. The structure division in the three main groups showed genetic information sharing and the consequent insertions of individuals belonging to the Malanje population in the Cuanza Norte group. The PCoA analyses led to the evolutionary connection of these areas. The highest concentration of genetic variability in the Malanje and Cuanza Norte regions were possibly related to the exchange and introduction of material in the crops.
The authors have not declared any conflict of interests.
The authors thank all the farmers involved in this study and the partner institutions for the resources that made this work possible. The National Institute of Management of Scholarships (INAGBE) awarded a doctoral scholarship to Sandra Domingos João Afonso.
REFERENCES
|
Afonso SDJ, Ledo CAS, Moreira RFC, Silva Sde O, Leal V, Dde J, Conceição AL da S (2014). Selection of descriptors in a morphological characteristics considered in cassava accessions by means of multivariate techniques. IOSR Journal of Agriculture and Veterinary Science (IOSR-JAVS), India 7(1):13-20.
|
|
|
|
Agre AP, Bhattacharjee R, Rabbi IY, Alaba OA, Unachukwu NN, Ayenan MAT, Loko YL, Bauchet GJ, Dani A (2017). Classification of elite cassava varieties (Manihot esculenta Crantz) cultivated in Benin Republic using farmers' knowledge, morphological traits and simple sequence repeat (SSR) markers. Genetic Resources and Crop Evolution 65:513-525.
Crossref
|
|
|
|
|
Benko Iseppon AM, Winter P, Huttel B, Stagginus C, Muhlbauer F, Kahl G (2003). Molecular markers closely linked to Fusarium resistance genes in chickpea show significant alignments to pathogenesis related genes located on Arabidopsis chromosomes 1 and 5. Theoretical and Applied Genetics 103(2):379-386.
Crossref
|
|
|
|
|
Bozza AFO (2009). Determinação de metais essenciais na polpa do fruto Butia purpurascens Glassman e sua utilização em mistura em pó para bolo. Dissertação de Mestrado, Universidade Católica de Goiás. 73 f.
|
|
|
|
|
Brandão MM, Viera FA, Carvalho D (2011). Estrutura genética em Microescala Espacial Myrcia splendens (Myrtaceae). Revista Arvóre; Viçosa- MG 35(5):957-964.
|
|
|
|
|
Brown AHD (1978). Isozymes, plant population genetics struture and genetic conservation. Theoretical and Applied Genetics 52:145-157.
Crossref
|
|
|
|
|
Brown AHD, Weir BS (1983). Measuring genetic variability in plant populations. In: Tanksley SD, Orton TJ (Eds.). Isozymes in plant genetics and breeding. Part A. Amsterdan: Elsevier Science Publishers 1(1):73-86.
Crossref
|
|
|
|
|
Clement CR, Cristo-Araújo M, Coppens D'eeckenbrugge G, Pereira AA, Picanço-Rodrigues D (2010). Origin and domestication of native Amazonian crops. Diversity, Basel 2(1):72-106.
Crossref
|
|
|
|
|
Costa SR (2010). Técnicas de estudo micromorfológico e molecular aplicadas ao gênero Hypericum. Dissertação (Mestrado – Área de Concentração em Proteção de Plantas), Universidade Técnica de Lisboa, Lisboa, 76 f.
|
|
|
|
|
Costa DF, Vieira FA, Fajardo CG, Chagas KPT (2015). Diversidade genética e seleção de iniciadores issr em uma população natural de mangaba (Hancornia speciosa Gomes) (apocynaceae). Revista Brasileira de Fruticultura, Jaboticabal 37(4):970-976.
|
|
|
|
|
Cruz CD, Ferreira FM, Pessoni LA (2011). Biometria aplicada ao estudo da diversidade genética 1.ed. Suprema Gráfica Editora, Minas Gerais.
|
|
|
|
|
Doyle JJ, Doyle JL (1987). Isolation of plant DNA from fresh tissue. Focus 12:13-15.
|
|
|
|
|
Earl DA, Vonholdt BM (2011). Structure Harvester: a website and program for visualizing STRUCTURE output and implementing the Evanno method. Conservation Genetics Resources 4(2):359-361.
Crossref
|
|
|
|
|
Elias M, Mullen GS, Mckey D, Roa AC, Tohme J (2004). Genetic diversity of traditional South American landraces of cassava (Manihot esculenta Crantz): an analysis using microsatellites. Economic Botany 58:242-256.
Crossref
|
|
|
|
|
Emperaire L, Muhlen GS, Fleury M (2003). Approche comparative de la diversité génétique et de la diversité morphologique des maniocs em Amazonie (Brésil et Guyanes). Les Actes du Bureau des Ressources Génétiques 4:247-267.
|
|
|
|
|
Estoup A, Rouseet F, Michalakis Y, Cornuet JM, Adriamanga M, Guyomard R (1998). Comparative analysis of microsatellite and allozyme markers: a case study investigating microgeographic differentiation in brown trout (Salmo trutta). Molecular Ecology 7(3):339-353.
Crossref
|
|
|
|
|
Evanno G, Regnaut S, Goudet J (2005). Detecting the number of clusters of individuals using the software STRUCTURE: a simulation study. Molecular Ecology 14(8): 2611-2620.
Crossref
|
|
|
|
|
Excoffier LGL, Lischer SS (2005). Arlequin ver. 3.0: An integrated software package for populationgenetics data analysis. Evolutionary Bioinformatics Online 1:47-50.
Crossref
|
|
|
|
|
FAO (2014). Food and Agriculture Organization of the United Nation. Statistics of production. Disponivelem: .Acesso em: 15 out.
|
|
|
|
|
FAO (2018). Agricultural production – Crops primary. Disponível em.
|
|
|
|
|
Fernandes RC (2008). Diversidade e estrutura genética em populações naturais de pequizeiro (Caryoca brasiliense Camb) no Norte de Minais Gerais.73p. Dissertação (Mestrado em Engenharia Florestal)-Universidade Federal de Lavras, Lavras.
|
|
|
|
|
Ferreira ME, Grattapaglia D (2008). Introdução ao uso de marcadores moleculares em análise genética. 3.ed. Brasília: Embrapa Cenargen (Embrapa Cenargen. Documentos) 20:220.
|
|
|
|
|
Ferreira ME, Grattapaglia D (1998). Introdução ao uso de marcadores moleculares em análise genética. 2.ed. Brasília: Embrapa-Cenargen, 20:220.
|
|
|
|
|
Ge XJ, Sun M (2001). Population genetic struture of Ceriops tagal (Rhizophoraceae) in Thailand and China. Wetlands Ecology and Management 9:203-209.
Crossref
|
|
|
|
|
Giustina LD, Luz LN, Vieira FS, Rossi FS, Soares-Lopes CRA, Pereira TNS, Rossi AAB (2014). Population structure and genetic diversity in natural populationsos Theobroma speciosum Willd. ex Spreng (Malvaceae). Genetics and molecular Research 13(5):47-53.
|
|
|
|
|
Gonçalves TM, Fihlo PSV, Vidigal MCG, Ferreira RCU, Rocha VPC, Ortiz AHT, Moiana L, Kvitschal MV (2017). Genetic diversity and population structure of traditional sweet cassava accessions from Southern of Minas Gerais State, Brazil, using microsatellite markers. African Journal of Biotechnology 16(8):346-358.
Crossref
|
|
|
|
|
Grattapaglia D (2001). Marcadores moleculares em espécies florestais: Eucalyptus como modelo. In Recursos genéticos e melhoramento – plantas (Nass LL, Valois ACC, Melo IS, Valadares-Inglis MC, eds.). Fundação MT, Rondonópolis pp. 967-993.
|
|
|
|
|
Hamrick JL (1982). Plant population genetics and evolution. American Journal of Botany 69(10):1685-1693.
Crossref
|
|
|
|
|
Hamrick JL, Godt MJW, Murawski DA, Loveless MD (1991). Correlations between species traits and allozyme diversity: implications for conservation biology. In: Falk DA, Holsinger KE (eds.) Genetics and Conservation of Rare Plants. Oxford University Press, New York pp. 75-86.
|
|
|
|
|
Hamrick JL, Godt MJW, Shermanbroyles SL (1992). Factors influencing levels of genetic diversity in woody plant species. New Forests 6:95-124.
Crossref
|
|
|
|
|
Hart DL, Clark AG (1997). Principles of population genetics. Sunderland. Sinauer Associetes 3:542.
|
|
|
|
|
Hu Y, Wang L, Xie X, Yang J, Li Y, Zhang H (2010). Genetic diversity of wild population of Rheum tanguticum endemic to China as revealed by ISSR analysis. Biochemical Systematics and Ecology 38(12):264-274.
Crossref
|
|
|
|
|
Instituto Geógrafo e Cadastral de Angola (IGCA) (2016). Folha Cartográfica de Angola. Província de Malanje.
|
|
|
|
|
Instituto Nacional de Meteorologia (INAMET) (2004). Dados estatísticos. Serviços Centrais de Meteorologia. Luanda, Ministério do Ambiente.
|
|
|
|
|
Kawuki SR, Morag F, Maryke L, Liezel H, Dong-Jin K (2009). Identification, characterisation and application of single nucleotide polymorphisms for diversity assessment in cassava (Manihot esculenta Crantz). Molecular Breeding 23(4):669-684.
Crossref
|
|
|
|
|
Li M, Zhao Z, Miao XJ (2013). Genetic variability of wild apricot (Prunus armeniaca L.) populations in the Ili Valley as revealed by ISSR markers. Genetic Resources and Crop Evolution 60:2293-2302.
Crossref
|
|
|
|
|
Loveless MD, Hamrick JL (1984). Ecological determinants of genetic structure in plant populations. Annual Review of Ecology and Systematics 15:65-95.
Crossref
|
|
|
|
|
Muhlen G, Alves-Pereira A, Clement CR, Valle T (2012). Genetic diversity and distribution of manioc (Manihot esculenta) in Brazil evaluated with microsatellite markers. 2nd International Meeting of Amazonian Archaeology, Manaus, AM.
|
|
|
|
|
Muondo PA (2013). Culturas intercalares e agricultura familiar em angola. Caso: mandioca/cajanus; mandioca/leucaena. Tese (Doutorado em Engenharia Agronómica) – Instituto Superior de Agronomia da Universidade Técnica de Lisboa.
|
|
|
|
|
Nei M (1973). Analysis of gene diversity in subdivided populations. Proceendings of the National Academy of Sciences of the USA 70(12):3321- 3323.
Crossref
|
|
|
|
|
Oliveira MM (2011). Diversidade genética em espécies silvestres e híbridos interespecíficos de manihot (euphorbiaceae - magnoliophyta). Cruz das Almas- Bahia, 34-35p. (Dissertação) Mestrado em Fitotecnia. Universidade Federal de Recôncavo.
|
|
|
|
|
Pádua JAR (2011). Genética da paisagem: áreas prioritárias para manejo e a conservação de Eremanthus erythropappus (DC.) Macleish no Estado de Minas Gerais. Lavras 80 p. DissertaçãoMestrado. Universidade Federal de Lavras.
|
|
|
|
|
Prevost A, Wilkinson MJ (1999). A new system of comparing PCR primers applied to ISSR fingerprinting of potato cultivars. Theorical Applied Genetics 98:107-112.
Crossref
|
|
|
|
|
Pritchard JK, Stephens M, Donnelly P (2000). Inference of population structure using multilocus genotype data. Genetics 155:945–959.
|
|
|
|
|
Roldan-Ruiz I, Dendauw J, Bockstaele EV, Depicker A, Loose MDE (2000). AFLP markers reveal high polymorphic rates in rye grasses (Lolium spp.). Molecular Breeding 6:125-134.
Crossref
|
|
|
|
|
Silva BM, Rossi AAB, Dardengo JFE, Araujo VAAC, Rosi FS, Oliveira LO, Clarindo WR (2016). Diversidade genética estimada com marcadores entre sequências simples repetidas em cultivos comerciais de Cupuaçuzeiro. Ciência Rural, Santa Maria 46(1):108-113.
Crossref
|
|
|
|
|
Slatkin M, Barton NH (1989). A comparison of three indirect methods for estimating average levels of gene flow. Evolution 43(7):1349-1368.
Crossref
|
|
|
|
|
Smith JF, Pham TV (1996). Genetic diversity of the narrow endemic Allium aaseae (Alliaceae). American Journal of Botany, colombus 83(6):717-726.
|
|
|
|
|
Souza AP (2001). Biologia molecular aplicada ao melhoramento. In: Nass LL, Valois ACC, Melo IS, Valadares-Inglis MC Recursos genéticos e melhoramento –plantas. Rondonópolis: Fundação MT 29:939-966.
|
|
|
|
|
Tatikonda L, Wani SP, Kannan S, Beerelli N, Srudevi TK, Hoisington DA, Devi P, Varshney RK (2009). AFLP-based molecular characterization of an elite germplasm collection of Jatropha curcas L. biofuel plant. Plant Science 176:505-513.
Crossref
|
|
|
|
|
Teixeira LM, Freitas DV, Reis EF, Pinto JFN (2012). Estrutura genética em populações naturais de Campomanesia spp. na região Centro Oeste, Brasil. IX CONPEEX,Goiânia.
|
|
|
|
|
Tiago AV, Rossi AAB, Tiago PV, Silva BM, Souza SAM, Hoogerheide ESS, Rossi FS (2015). Diversidade genética entre genótipos de mandioca por meio de marcadores moleculares issr. Congresso Brasileiro de melhoramento de plantas. Centro de convenções de Goiânia 412- 619.
|
|
|
|
|
Turyagyenda LF, Kizito EB, Ferguson ME, Baguma Y, Harvery JWP, Gibson P, Wanjala BW, Osiru DSO (2012). Genetic diversity among farmer-preferred cassava land races in Uganda L.F. African Crop Science Journal 20(1):15-30.
|
|
|
|
|
Varshney RK, Chabane K, Hendre PS, Aggarwal RK, Graner A (2007). Comparative assessment of EST-SSR, EST-SNP and AFLP markers for evaluation of genetic diversity and conservation of genetic resources using wild, cultivated and elite barleys. Plant Science 17:638-649.
Crossref
|
|
|
|
|
Varshney RK, Thiel T, Sretenovic-Rajicic T, Baum M, Valkoun J, Guo P, Grando S, Ceccarelli S, Graner A (2009). Identification and validation of a core set of informative genic SSR and SNP markers for assaying functional diversity in barley. Molecular Breeding 22:1-13.
Crossref
|
|
|
|
|
Venkovsky R, Nass LL, Cordeiro CMT, Ferreira MAJF (2007). Amostragem em recursos genéticos vegetais. In: Nass, L.L. (Ed.). Recursos Genéticos Vegetais. Brasília: Embrapa Recursos Genéticos e Biotecnologia 231-280.
|
|
|
|
|
Vigouroux Y, Glaubitz JC, Matsuoka Y (2008). Population structure and genetic diversity of New World maize races assessed by DNA microsatellites. American Journal of Botany 95:1240-1253.
Crossref
|
|
|
|
|
Xie W, Zhang X, Cai H, Liu W, Peng Y (2010). Genetic diversity analysis and transferability of cereal EST-SSR markers to orchardgrass (Dactylis glomerata L.). Biochemical Systematics and Ecology 38:740-749.
Crossref
|
|
|
|
|
Wright S (1931). Evolution in Mendelian populations. Genetics 16:97-159.
|
|
|
|
|
Wright S (1951). The genetical structure of populations. Annals of Eugenics 15:323-354.
Crossref
|
|
|
|
|
Wright S (1978). Evolution and the Genetics of Populations. Variability within and among Natural Populations. University of Chicago Press, Chicago. Vol. 4.
|
|
|
|
|
Yeh FC, Yang RC, Boyle TBJ, Ye ZH, Mao JX (1997). POPGENE, the user-friendly shareware for population genetic analysis. Molecular Biology and Biotechnology Center, University of Alberta, Edmonton, Alberta, Canada.
|
|
|
|
|
Zhu JJ, Lillehoj HS, Cheng HH, Pollock D, Sadjadi M, Emara MG (2001). Screening for highly heterozygous chickens in outbred commercial broiler lines to increase detection power for mapping quantitative trait loci. Poultry Science 80(1): 6-12.
Crossref
|
|