The overall objective of this present research is assessment of rice-water requirement in Cyabayaga wetland of Nyagatare District in Rwanda. Specific objectives of this research project were to collect and analyze weather parameters, of soil physical properties, crop-water requirements and to recommend efficient water management of the study area. Research design, data collection and field observations were made during July, 2019 to January, 2020. The experiment was carried out in Cyabayaga marshland and was especially based on the assessment of rice water requirement, weather parameters and hydraulic parameters like measurement of soil infiltration rate, soil hydraulic conductivity, flow discharge in irrigation channels, water loss, conveyance efficiency and application efficiency. Evapotranspiration and irrigation needs were determined by Cropwat 8.0 software. Conveyance efficiency (Ec) was found to be 70.05% and 30% of water was lost through seepage and evapotranspiration through weeds in unlined channels. The overall deep percolation, seepage and evapotranspiration losses were found to be 25 mm/day. Considering the highest potential crop evapotranspiration (ETc) of 4.8 mm, it was indicated that huge water loss of 20.2 mm/day was caused by seepage and percolation within the soil. The application efficiency (Ea) was found to be 23.8%. Hence, the overall efficiency was 16.7%. With the current rice yield of 4.25 t/ha, a low water-use-efficiency of 0.089 kg/m3 was found.
Rwanda is land-locked country occupied by the total population of 12.4 million. It has the area of 26,338 km2. It is among the most highly populated countries of 498.7 persons/km2 in the region of sub-Saharan Africa. The population growth rate in the year 2018 was 2.6% (World Bank, 2019). The country is characterized by a hilly landscape and undulated topography. Rice is a key cereal among the important foods in Rwanda with an average yield of 5.25 t/ha and is planted in two planting seasons per year. Season A starts from June to July and ends in Mid-November to Mid-December while Season B starts from Mid-December to July and ends in May to June (Ghins and Karl, 2018).
Marshlands are a potential source for agriculture development and the Government of Rwanda has taken projects of irrigation infrastructure development for increasing production and productivity of crops. Rice is the one of the most vital crops full-grown in developed marshland. The entire surface area of the wetland in Rwanda is roughly 278,000 ha (Léon, 2012) of which an area of 126,441 ha is under intensive agriculture while 4,7224 ha is uncultivated protected marshland (NISR, 2019).
The required range of temperature for maximum growth of the most of the agricultural plants is between 15 and 40°C and the relative humidity suitable for most of the crop plants is about to be 40 to 60%. The wind movement suitable for more crops is about 4 to 6 km/h or 96 to 144 km/day (Arshad et al., 2019).
The higher water retention capacity of particular soil determines its capability to hold a huge amount of water. Capacity of water retention of a given soil depends on the soil characteristics like organic matter, soil texture, structure and depth (Fontanier et al., 2020).
The amount of water required by a crop in a given period of time to reach its normal growth under field environment is called crop water requirements. Crop water requirement comprises of the water losses through evapotranspiration, irrigation and land preparation (Doorenbos and Pruitt, 1977; Eva et al., 2019).
About 95% of the lands are irrigated with the surface irrigation in sub-Saharan Africa and 40% of the supplied water could not reach within the land, only 60 to 70% for application efficiency due to water that is lost along the conveyance system (Salman et al., 2019).
The water loss in a given soil takes place through seepage and percolation in the soil, evapotranspiration from the canopy of the crops and runoff from the field. Evapotranspiration (ET) is high during the planting periods in which 100% of ET comes from evaporation and about 90% of ET comes from transpiration at full crop canopy. Percolation stands for vertical flow of water; the root zone to the water level, while seepage represents groundwater between fields. Percolation and seepage occur at the same time and are hard to separate, which is why they are still considered together (Puasa et al., 2010).
Justification of taking the present research
Cyabayaga wetland was developed to grow paddies in Nyagatare district. The water of Walfu River is diverted through a barrage to an artificial reservoir supplying water into irrigating paddy fields. The marshland has been facing enormous problems due to natural and anthropogenic causes. The marshland is normally affected by insufficient water during dry seasons and excess water during rainy seasons. Climate change is also affecting irregularity in rainfall distribution and amount during cropping seasons, undulating topography in catchment areas that results in heavy soil erosion and sediment transport during the rainy season, which affects the irrigation and drainage channel capacity within the irrigation command. Poor management of irrigation infrastructure and water management also causes poor water use efficiency. The heavy floods during rainy season caused by torrential rains sometimes damage the crop; therefore, a need to find out appropriate solutions is inevitable.
The present research dealt with determination of weather data analysis, soil properties and crop water requirement. The study provides the reasons for poor water and land management in command as well as catchment areas and low water use efficiency. This helps to provide appropriate recommendations for efficient water management and optimum rice production in command area and land use management for catchment area.
Site selection
The marshland of Cyabayaga is positioned in Nyagatare District at the coordinates of 1°25' 15" S, 30°17”38" E. It is situated in agro-ecological zone of in the Eastern Savana with the altitude of 1400 m. The Cyabayaga watershed includes the following sectors Nyagatare, Rukomo, Mukama and Mimuli. The marshland has received and diverted water from Walfu River in Mimuli sector (Karungeri site). During 1970, the hillsides around the wetland were converted into farming and settlement areas. In 2003, the Rural Sector Support Project 1(RSSP1) developed Cyabayaga wetland and thus became useful for growing paddy (Ingabire et al., 2013).
Materials used
During data collection and analysis, the following materials were used: soil sampler to collect soil samples from field to laboratory for soil properties analysis, laptop for data storage and processing, soil lab materials and Cropwat 8.0 software to predict rice water requirement.
Weather data collection and analysis
The meteorological data of Nyagatare station were collected from meteorological agency headquarters for the period of 37 years (from 1982 to 2017): data of temperatures, windspeed, rainfalls, sunshine hours, and relative humidity. Based on analysis of collected weather data, the average values and range cumulative data if needed were determined.
Soil sampling and analysis
Soil sample was collected from three separate plots 1, 2 and 3 located in upper, middle, and lower reach in the study area at three different depths: 1) 0-20 cm, 2) 20-40 cm, 3) 40-60 cm and taken into the laboratory of College of Agriculture, Animal Sciences and Veterinary Medicine (CAVM) to analyze its texture, bulk density, infiltration rate and hydraulic conductivity. Based on the recommended procedures, the percentage of sand, silt and clay was determined using Hydrometer methods; hence, USDA-Textural triangle was used to determine particle classes. The soils of experimental sites comprised of sandy loam at the top layer with clay loam beneath. The average bulk density of the Cyabayaga wetland was found to be 1.3 g/cm3 and it is defining the ideal root growth. The basic infiltration rate was found at 1.0 cm/h. This infiltration rate of the area falls under moderately slow infiltration rate. The average hydraulic conductivity of soils in the study area are highly permeable with 12.96 cm/h (Rapid category) leading to enormous water losses.
Crop water requirements
Cropwat8.0 was used to calculate crop water requirements using input data such as climatic and crop and soil data. In the software, the default irrigation efficiency is 70% as in most surface irrigation systems; the best irrigation efficiency may be achieved at 70%. In this study, 70% efficiency was fed and later compared to the real water used to measure water losses in the field. The crop evapotranspiration received from Cropwat8.0 was used for total water used to harvest the crop after adding deep percolation losses found through stake and nail method.
Weather data collection and analysis
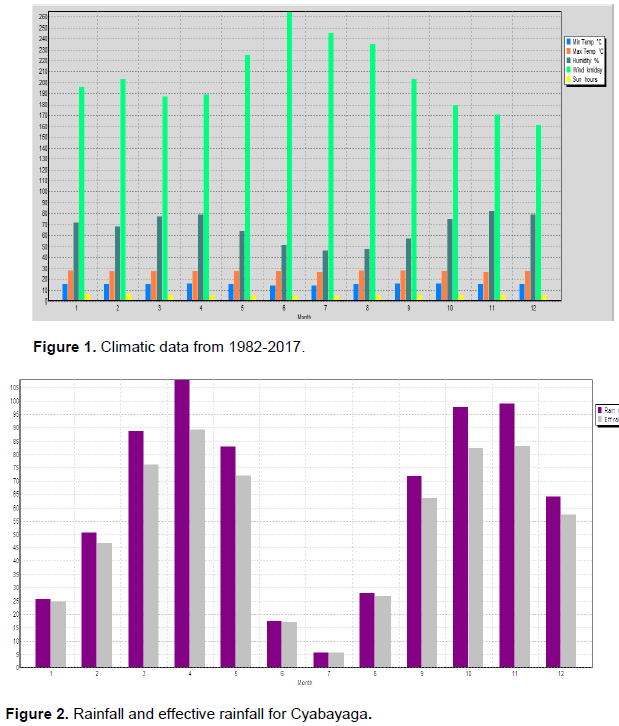
The weather data collected were analyzed on a monthly basis. The meteorological data viz. sunshine hours, wind speed, relative humidity, and minimum and maximum temperature are presented in Figure 1.
The data in Figure 1 show that the average minimum temperature varies between 13.9 and 15.6°C. The highest average minimum temperature of 15.6°C was found in the Month of April, while the lowest average minimum temperature of 13.9°C was found in months of June and July. The highest average temperature of 28°C was found in the months of August and September and the lowest maximum temperature of 27°C was found in the month of July and November. The results show that the warmest month was August and September and the coldest month was found to be June and July. It is evident that average monthly temperature variation is not much.
The highest relative humidity is found during November, with 82% followed by April (79%), December (79%) and March (77%). This is due to their occurrence during rainy season while the lowest relative humidity of 46% was found in the Month of July followed by August (48%), June (51%) as these months fall during dry season. It is obvious that the rainy month seasons present a high amount of relative humidity.
The highest wind velocity of 11.0 km/h and lowest wind velocity of 7.1 km/h was found in the months of July and November, respectively; while the value of 8.5 km/h was the average monthly wind velocity. The range of wind speeds varies from 6.7 to 11.0 km/h with a difference of 4.3 km/h; and it is clear that there is a considerable change in wind velocity throughout the year.
The yellow bars on the Figure 1 represent the trend of sunshine hours; it is evident that the highest sunshine duration is in the month of July and August with 6.7 and 6.5, respectively. These months fall during long dry season. The lowest sun shine hour was found during April with 5 h followed by March and February with 5.2 h each. The annual daily average sunshine hours was calculated to be 5.8 h.
Monthly rainfall and effective rainfall
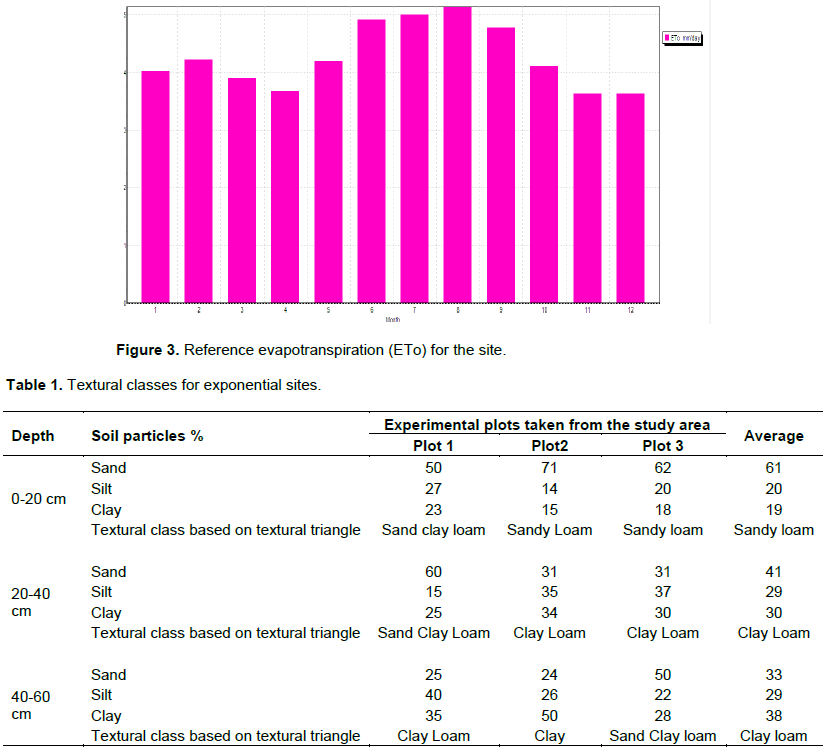
The rainfall data of Nyagatare station were collected from meteorological agency headquarters for the period of 36 years (from 1982 to 2017). Based on analysis of collected rainfall data, the average values, and range cumulative data if needed were determined. The results are presented in Figure 2.

As presented in Figure 2, the month of April received the highest rainfall of 107.9 mm, and July received the lowest rainfall of 5.8 mm with a huge difference of 102.1 mm. The average monthly rainfall was from March to May and was computed to be 93.26 mm while the average rainfall was from September to December was 83.15 mm. The month of April received the maximum effective rainfall of 89.3 mm, while the lowest was obtained throughout July, with the value of 5.7 mm. It is clear that July is the driest month throughout the year where irrigation is highly required. The highest rainfall was obtained in the Month of April and the driest period begins from June to August. The rainy period begins from March to May and from September to December.
Determination of reference evapotranspiration (ETo) by Cropwat
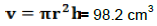
The analysis of inputs climatic data was done using Cropwat 8.0 application that helped to produce the average value of reference evapotranspiration per day (ETo) during each month of the year as is shown in Figure 3.
From Figure 3, it is evident that the maximum ETo was found in the month of August with the value of 5.14 mm/day, followed by July with the value of 5.0 mm/day. The reason for high ETo is because of the dry season months with low RH, comparatively higher wind velocity and more sunshine. It was also found that the lowest ETo is 3.64 mm/day during November and December followed by 3.68 mm/day during April. This is because April and November months are rainy months, while December also receives more at 50 mm of rainfall. The monthly average value of ETo was found to be 4.27 mm/day.
Soil texture of the site
Based on the soil analyses, the soil texture classes of the experimental field under this study, is made up of sandy loam at the top layer and clay loam at 40 to 60 cm. It was also found, that from 0 to 20 cm depth, clay content was 19%. From 20 to 40 cm depth, clay content was increased to 30 and 38% for the depth of 60 cm. This indicated that clay content increased as the depth increased. The important property of the soil of the Cyabayaga wetland for use as a growing paddy is due to the high moisture holding capacity of clay as presented in Table 1.
Soil bulk density of the area
Soil samples were taken from three selected sites and dried in the laboratory for further analysis. Soil mass was measured using an electronic balance; and its volume was calculated by measuring the volume of a core cutter having 5 cm of height and 5 cm of diameter:
The average bulk density of three plots was found to be 1.3 g/cm3. It is evident that the soil of experimental site is within the range of bulk density that is defined to give ideal root growth.
Infiltration rate of soil for the experimental area
The infiltration rate for the site was determined by using a double ring infiltrometer. As defined by Yewle et al. (2016), basic infiltration rate found in study area falls in the category of moderately slow and the average infiltration rate of the site is 1.0 cm/h, which also falls under moderately slow infiltration rate.
Hydraulic conductivity of soil for the site
The measure of how water can pass easily within the soil is called hydraulic conductivity. Higher values indicate that the soil is highly permeable, while the lower values indicate less permeable soil. It is evident that the average hydraulic conductivity of the experimental plots selected in the study area are 0.0034 cm/s, 0.0038 cm/s and 0.0036 cm/s for Plots 1, 2, and 3, respectively. According to Humberto et al. (2002)and Blanco-Canqui et al. (2002), the hydraulic conductivity values of the soils of Cyabayaga wetland are rapid permeable. To reduce the deep percolation losses, farmers perform puddling operations. The latter refer to the tillage of rice paddies while flooded, an old practice that is practiced to prepare for rice cultivation by reducing the percolation rates of water through churning the clay soil particles and making them close many of the soil pores. Over time, soil puddling also creates a compacted layer under the puddled zone which further minimizes percolation loss of irrigation water.
Computation of irrigation requirements
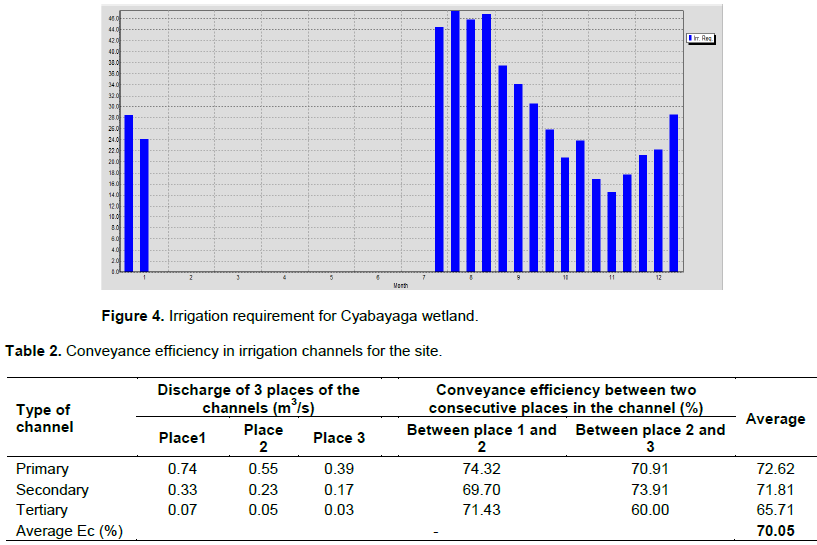
Net irrigation requirement (NIR) refers to the artificial application of water to the field such that fulfill plants can use it for full plant growth without considering any water losses; while crop water requirement (CWR) is defined as the water used by the plant until it reaches maturity including water losses by seepage, land preparation, transplanting and evapotranspiration. Rice crop was planted on 23rd of July and harvested after 180 days on the 18th of January. Crop water requirement (ETcrop) and irrigation requirements (IR) have been computed on a decade and daily basis. The results are presented in Figure 4.
Referring to the Figure 4, it is evident that the highest irrigation requirement started from July to August because these months fall into long dry season and the irrigation requirement reduced due to onset of short rainy season from mid-September to mid-December. The lowest irrigation requirement was found to be November at 16.4 mm. The irrigation requirement was from Mid-December to Mid-January; which is relatively low, because the crop is at maturity. The total irrigation water requirement for the rice crop was 530.2 mm.
Conveyance efficiency of irrigation channel in the study area
The conveyance efficiency represents the efficiency of water transport in the channel. The water conveyance efficiency is the ratio of water conveyed in one location to another location of the channel. The present study was conducted in earthen or unlined channel of the primary, secondary and tertiary channel levels. Water flow in three successive places of the channel was measured so as to find out the conveyance efficiency between two successive places.
Table 2 shows that, the conveyance efficiency in primary, secondary, and tertiary channels are 70.91, 73.91 and 60%, respectively. The overall average conveyance efficiency (Ec) = 70.05%
From the results, about 30% of water is lost through seepage and evapo-transpiration by undesired vegetation and leakage through water control structures in the unlined and poorly maintained conveyance system. In the study area also, it was found that the canals are not well maintained.
Daily water losses in the study area
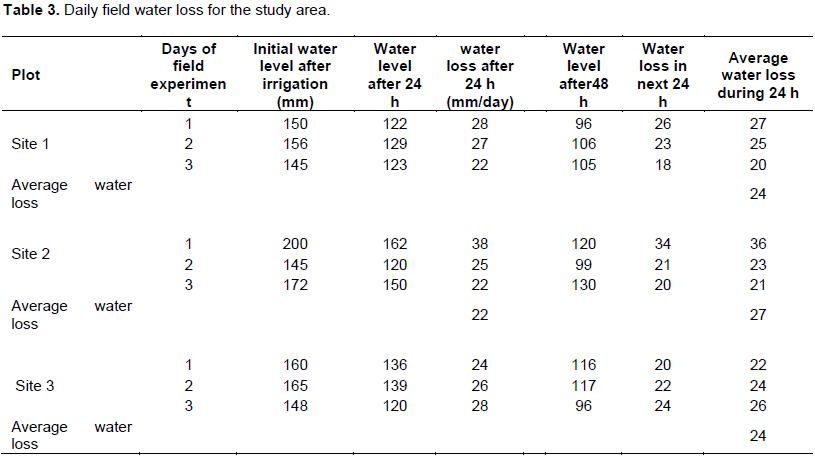
The average water loss in each plot was measured at an interval of 24 h for 2 days and the mean value of water losses for the three selected sites and 9 plots was computed. The results of water losses in irrigated plots are presented in Table 3. The average water losses in all selected sites is =
= 25 mm.
From Table 3, the average water losses in the three selected sites of marshlands were found to be 24, 27 and 24 mm, respectively. It was also found that the losses in the first 24 h were less than the next 24 h. This may be due to more water required to fill the unsaturated pores. The average of all sites was determined to be 25 mm. The average water loss, that includes ETc, deep percolation and seepage, is 25 mm/day.
The average water losses including ETc and deep percolation and seepage are 25 mm/day. Considering that irrigation would be stopped before 2 weeks of harvesting, the amount of water losses have been considered for 166 days. Based on ETc for 166 days the average ETc losses of 4.8 mm was taken as the actual water loss calculations, hence, 4.8 mm/day is taken as the water depletion from the rooting zone, then the extra water which was not used by the crop was 25-4.8 = 20.2 mm. Hence, losses due to deep percolation and seepage are 20.2 mm/day.
Furthermore, water application efficiency Ea = 4.8 × 100/20.2= 23.76%, or about 23.8%. The overall efficiency would be Ec × Ea = 0.70 × 0.238 × 100 = 16.67% or approximately 16.7%. Considering net irrigation of 584.6 mm given by Cropwat 8.0 with 70% irrigation efficiency, this results to 835.4 mm. In actual field conditions based on measurements made during the present study, the actual irrigation efficiency was found to be 16.67%. This indicates that a huge amount of irrigation water is lost in field conditions and caused by seepage and percolation. Actually, the farmers of Cyabayaga marshland are currently using 4771.3 mm when crop evapotranspiration needs are 796.8 mm.
It means that the total water of 4771.3 m3 is being used for each hectare of land and rice yields (4.25 tons/ha) are also low due to poor input management.
Water use efficiency
The water ratio of crop yield (Y) to the total amount of water used (WR) in the field is called water use efficiency (WUE). WUE = Y/WR
The average rice production of 4.25 tons/ha (Miklyaev et al., 2021) was taken similar to production of Nyagatare district where Cyabayaga wetland is located. It is clear that 4771.3 m3 of water is required to produce 4.25 tons of rice from 1 ha. This means that to produce 1 kg of rice a volume of 11.23 m3 of water is expected to be required. Hence, the water use efficiency would be 1/11.93 m3= 0.089 kg/m3. It shows a poor water use efficiency and there is a need to improve it.
Research conducted by Jaffar and Sitha (2017) revealed that the production and efficiency of water use for rice is comparable to irrigation scheduling in transplanted rice gave 0.36 kg/m3 WUE. It also indicates the importance of irrigation scheduling for efficient use of water.
In the study area, farmers are flooding 10 to 20 cm of water that also makes a huge amount of water loss in application. To control such water losses, proper land leveling, puddling and appropriate irrigation scheduling improve water management and higher rice yields. Therefore, farmers have to manage smaller amounts of water in their fields.
The data collected, analyzed and discussed in this paper brought the following points as conclusions of this research. The highest average minimum temperature is 15.6°C, which was found in April and average lowest minimum temperature was 13.9°C, found in June and July. The highest maximum temperature was 28°C found during August and September; and the lowest maximum temperature of 27°C was found in the months of July and November. It shows that in the study area, the temperature variations are quite low. The high relative humidity, ranging from 77 to 82%, were found during March, April, October, November, and December due to rainy seasons. The lowest relative humidity of 46% was found in the month of July, followed by August and June with 48 and 51%, respectively. These months fall under the long dry season. The highest rainfall of 107.9 mm was in the month of April. The months that occur during the cropping season within the study area were July to January. During this period, the month of November had the highest rainfall of 98.9 mm, followed by 97.8, 71.8, 64.1, and 25.7 mm during the cropping season. From the rainfall data and irrigation scheduling, it can be concluded that less irrigation was required during the rainy months and was more when amount of monthly rain was less. It was also found that the soils of experimental sites are comprised sandy loam at the top layer with clay loam beneath. The average bulk density of the Cyabayaga wetland was found to be 1.3 g/cm3, and it defines the ideal root growth. The basic infiltration rate was found to be 1.0 cm/h, and the infiltration rate of the area falls under moderately slow infiltration rate. The average hydraulic conductivity of soils in the study area are highly permeable with 12.96 cm/h (rapid category) leading to enormous water losses. The results indicated that the highest ETc of 5.6 mm/day was found in the month of September and lowest ETc of 3.72 mm was during January.
The total irrigation requirement of 530.2 mm for the entire season was given from Cropwat 8.0; where an ideal irrigation efficiency of 70% was kept, which is not the case of rice irrigation all over the world. Therefore, actual losses in the field were measured. The conveyance efficiency (Ec) is found to be 70.05%, showing 30% of water lost through seepage and evapotranspiration through weeds in unlined channels. The overall deep percolation, seepage and evapotranspiration losses from flooded rice fields were found to be the range of 25 mm/day. Considering the highest ETc of 4.8 mm, it was concluded that a huge water loss of 20.2 mm/day was caused by seepage and percolation. The application efficiency (Ea) of 23.8% was found in the study area; hence, the overall efficiency was calculated to be 16.7%. With the current rice yield of 4.25 t/ha, a low water use efficiency of 0.089 kg/m3 was found. Therefore, an integrated approach of land and water management is highly needed.