Full Length Research Paper

ABSTRACT
INTRODUCTION
Iodine is an essential trace mineral in human nutrition obtained mainly from diet and water (Anderson et al., 2005). Iodine is irregularly distributed over the earth’s crust and in some areas the surface soil becomes progressively poorer in iodine through accelerated deforestation, soil erosion and leaching processes (EGVM, 2002; Singh, 2004; Ujowundu et al., 2011). Concentration of iodine in unpolluted water in various parts of the world has been found to be generally less than 3 µg/L while drinking water has been shown to contain an iodine level of less than 15 µg/L, except in few cases where much higher levels are reported (Banerjee, 1985). The element is an essential part of the thyroid hormones Triodothronine (T3) and tetraiodothyronine (T4), which in turn are necessary for human growth and development (Banerjee, 1985). Goiter is not one of the manifestations of iodine deficiency and the wide spectrum of manifestations is now commonly termed Iodine Deficiency Disorders (Anderson et al., 2005). These disorders include endemic cretinism, infant mortality, infertility, miscarriage, mental retardation neuromuscular defect or dwarfism (Anderson et al., 2005; Venturi and Venturi, 2009a; Underwood, 1977; Delange, 2000).
Goitrogens on the other hand are substances, which impair iodine uptake by the thyroid or impair iodine incurporation into thyroxine (JECDA, 1989; Venturi, 2001; Stoddard et al., 2008). It has been shown that there are some connections between the geogenic origin of water and the incidence of goiter (Dissanayake et al., 1999). Poor quality of drinking water has been discovered for years to cause goiter (Eskin et al., 1995; Venturi and Venturi, 2009b; Gaitan, 1983).
In Australia, New Zealand and several European countries, iodine deficiency is a significant public health problem. It is more common in third-world nations. Public health initiatives to lower the risk of cardiovascular disease have resulted in lower discretionary salt use at the table and with a trend towards consuming more processed foods. The non-iodized salt used in these foods also means that people are less likely to obtain iodine from adding salt during cooking (Anderson et al., 2005; Kulshreshtha, 1998; Venturi and Venturi, 2009a; Henniker, 1949; JECFA, 1989).
In areas where there is little iodine in the diet, typically remote inland areas and semi-arid equatorial climates where no marine foods are eaten, iodine deficiency gives rise to hypothyroidism, symptoms of which are extreme fatigue, goiter, mental slowing, depression, weight gain and low basal body temperatures (Lawrence, 2001). Iodine deficiency is the leading cause of preventable mental retardation, a result which occurs primarily when babies or small children are rendered hypothyriodic by a lack of the element (Lawrence, 2001; Spitzwag et al., 2000; Smyth, 2003). Breast strongly and actively concentrates iodine into breast-milk for the benefit of the developing infant but when iodine levels are low, it may develop a goiter-like hyperplasia, sometimes manifesting as fibrocystic breast disease (Lowe, 2006; Rasmussen et al., 2002). Studies indicate that iodine deficiency, either dietary or pharmacologic is a risk factor for breast cancer and can lead to dysplasia and increased incidence of malignancy in animal models, while iodine treatment can reverse dysplasia (Maekawa et al., 2006; Wu et al., 2002; Patrick, 2008; Lowe, 2006; Anderson et al., 2005).
MATERIALS AND METHODS
Water analysis
Two water samples were collected from two different water sources: Adada and Akoru Rivers both in Nsukka of Enugu State, Nigeria. An immediate analysis of these water samples were carried out in the laboratory owned by the Department of Biochemistry, Faculty of Biological Sciences, University of Nigeria, Nsukka.
Chemicals (reagents)
The chemicals used were calcium working reagent (BDH), 6 N sulphuric acid (Sigma), 0.1% of gum ghatti solution (May & Baker), 4 N sodium hydroxide (NaOH) solution (BDH), conditioning reagent (Sigma), barium chloride solution (Cartivalue), vanadate molybdate solution (Merck), phenoldisulphoric acid (BDH), concentrated solution of ammonia (Merck), acetate buffer (Sigma), 2.5% of hydroquinone (BDH), 0.1% of α, α-dipyridyl solution (BDH), alcoholic mercuric thiocyanide (Marck), vanadate citrate mixture (Sigma), phenolphthalein indicator (Lab. Tech. Chemicals), sodium diethyldithiocarbonate (BDH), carbon tetrachloride (BDH), citric acid buffer (BDH), potassium phosphate solution (Sigma), Luico-crystal violet indicator (May & Baker), concentrated solution of Sulphuric acid (May & Baker), sodium pyriodate solution (BDH), sodium cobalt-nitrite solution (BDH), 70% ethanol solution (Sigma), choline hydrochloride solution (BDH), sodium ferricyanide solution (May & Baker), zinc uranyl acetate solution (Sigma), 1% acetic acid (May & Baker) and 10% potassium ferri-cyanide solution (May & Baker).
Methodology
The water collected from Adada River was tagged sample A while that from Akoru River was tagged sample B. 25 ml of the water samples (A and B) were measured into triplicates, and then 2 ml of the prepared buffer solution was added into each of the triplicate. 0.2 g of indicator powder was also added and then finally the resulting solution was titrated with the standard ethylenediaminetetraacetic acid (EDTA) solution until the reddish stench colour disappears. The formula applied to get the hardness of the two water samples is given as:
Hardness (EDTA) at mg CaCO3/I = T* B * 1000/ml test portion
T = ml of the EDTA standard solution
B = mg of CaCO3 equivalent of 1 ml of the EDTA standard solution.
Water sample analysis
Eleven different tests were conducted from the water samples collected which includes:
Determination of iodine (I2)
Five milliliter (5 ml) of the water samples (A and B) were respectively collected in triplicates and 1 ml of citric acid buffer was added in each of the triplicates. Then, 0.5 ml of potassium persuphate and 0.1 ml of Luico-crystal violet indicator were added, respectively. Then, 3.9 ml of distilled water was added and mixed thoroughly and the absorbance reading was taken at a wavelength of 620 nm against the reagents blank.
Determination of calcium (Ca2+)
Five milliliter (5 ml) of the two water samples (A and B) were respectively taken in triplicates, that is, in three different test tubes, sample A was added to 0.5 ml while in another three different test tubes, sample B was added in the same volume. Also, 5 ml of distilled water was taken in another test tube tagged the BLANK.
Then, 3 ml of calcium working reagent was added into each of the triplicates containing sample A and B and also in the blank. Finally, the absorbance of each of the triplicates was taken at a wavelength of 612 nm against the blank.
Determination of magnesium ions (Mg2+)
Another triplicate was also prepared. In each of the triplicate test tubes (A and B), 5 ml of the water samples A and B were added, respectively. Also, in each triplicates, 2 ml of 0.6 N sulphuric acid was added. 1 ml of concentrated sulphuric acid was also added into 52.73 ml of distilled water to make a solution. 2 ml of the solution prepared was added into each of the triplicate samples (A and B). Then, 0.1% of gum ghatti was added into each of the triplicates and also in the blank. Also, 0.5 ml of 0.1% Titan yellow solution was added in each triplicate as well as in the blank. Then, 2 ml of 4 N NaOH was added in each triplicate and also in the blank. Finally, absorbance of the triplicates was taken at a wavelength of 520 nm against the blank.
Determination of sulphate (SO4-2)
Five milliliter (5 ml) of the water samples (A and B) were respectively added in each of the triplicates A and B. Then 1 ml of conditioning reagent was added in each triplicate and also to the blank and shaken thoroughly. Then 0.1 g of barium chloride was added in each triplicate and also to the blank and was shaken for 1 min. The absorbance of these triplicates including the blank was taken at the wavelength of 420 nm.
Determination of phosphate (PO4-3)
Five milliliter (5 ml) of the water samples (A and B) were respectively taken into triplicates including a blank. 2.5 ml of vanadate molybdate reagent was added into each triplicate and then 2.5 ml of distilled water was also added. Then the absorbance was taken at the wavelength of 470 nm.
Determination of nitrate (NO3)
Five milliliter (5 ml) of the water samples (A and B) were respec-tively added into triplicate beakers and heated to dryness. Then 0.2 ml of phenoldisuphuric and reagent (PDA) was added, followed by 1 ml of concentrated ammonia. Then these triplicate beakers were heated for a little period of time (30 s) and were diluted to 5 ml, that is, after adding 0.2 ml of PDA and 1 ml of conc. NH3, 3.8 ml of distilled water was added in each of the triplicate (A and B) to make up to 5 ml. Then, the absorbance was taken at a wavelength of 410 nm.
Determination of iron (Fe2+)
Five milliliter (5 ml) of the water samples (A and B) were respectively taken in triplicates. Then 1.5 ml of acetate buffer was added in each triplicate, followed by 1 ml of 2.5% hydroquinone. Then, 1 ml of 0.1% of α, α-dipyridyl reagent was added in each triplicate and then the pH of these triplicates were adjusted between 4.50 to 5.00 (the pH of the sample A triplicate was 4.70 and that of the B triplicate was 4.75). Then each triplicate was made up to 10 ml with distilled water and the absorbance taken at a wavelength of520 nm.
Determination of chloride (CI)
Five milliliters (5 ml) of the water samples (A and B) were respectively taken in triplicates and in each triplicate 1 ml of ferric alum solution was added, followed by the addition of 1 ml of alcoholic mercuric thiocyanide in each triplicate as well. The mixtures were shaken thoroughly and allowed to stand for 10 min, and then the absorbance at a wavelength of 470 nm was taken.
Determination of copper (Cu2+)
Five milliliters (5 ml) of the water samples (A and B) was respectively collected and arranged in triplicate, then 1 ml of vanadate citrate mixture was added in each triplicate followed by the addition of an indicator-phenolphthalein (2 drops). Then, a solution of ammonia was also added (drop by drop) until the solution of each of the triplicates changed to pink. Also, 0.1 ml of 1% sodium diethyl-dithiocarbonate was added followed by the addition of 5 ml of carbon tetrachloride (CCI4) into each of the triplicates. It was thereafter mixed vigorously and centrifuge for 5 min. Finally, the absorbance of the lower layer was taken at the wavelength of 440 nm against CCI4.
Determination of potassium (K+)
Five milliliters (5 ml) of the water samples A and B were respectively collected in triplicates; 2 ml of sodium cobalt-nitrite reagent was added, mixed vigorously and allowed to stand for 5 min. After the standing period, the triplicates were centrifuged for 15 min. After spinning, the supernatants were discarded and the residues were collected. To the residues, 2 ml of 70% ethanol was added, mixed vigorously and centrifuged for another 5 min. After spinning, the supernatants were also discarded and the residues collected were washed two times with 2 ml of 70% ethanol and centrifuged, respectively. To the residues, 2 ml of distilled water was added and boiled for 10 min. Then, 1 ml of choline hydrochloride was added, followed by addition of 1 ml of 2% sodium ferricyanide and also the addition of 2 ml of distilled water in each of the triplicates. Finally, the absorbance was taken at 620 nm against the blank.
Determination of sodium (Na+)
Five milliliters (5 ml) of the water samples A and B were respectively collected in triplicates and 5 ml of zinc uranyl acetate reagent was added in each of the triplicates, mixed vigorously and allowed to stand for 5 min. After the standing period, the triplicates were centrifuged for another 5 min and 2 ml of the supernatants (of each triplicates) gotten after the spinning were transferred into another triplicate test tubes; 8 ml of 1% of acetic acid and 0.4 ml of 10% potassium ferricyanide were added into the new collected test tubes, respectively and then mixed. The absorbance reading was recorded at a wavelength of 480 nm against the reagent’s blank.
Determination of hardness
Five milliliters (5 ml) of distilled water and 2 ml of buffer were added into the two test tubes. 1 ml of erichrome blathyle indicator was also added and the reading taken at 520 nm.
Determination of pH
The pH of both samples was determined using standard methods.
Determination of acidity
Five milliliters (5 ml) of the natural samples of the two rivers were respectively added into a different test tubes and 1 ml of phenophthaline was added to each and was titrated with 0.02 M sodium hydroxide until turned pink.
RESULTS AND DISCUSSION
Iodine/goitrogen balance in water and food is an index for predicting the bioavailability of iodine to the population dependent on it as a source of iodine. However, there is no standard value at which iodine and goitrogens must be present in water or food to make iodine more available. It greatly depends on iodine goitrogen balance expressed as iodine goitrogen ratios (Anderson et al., 2005). The pH of both samples was determined and that of Akoru River was 6.61 while that of Adada River was 6.15.
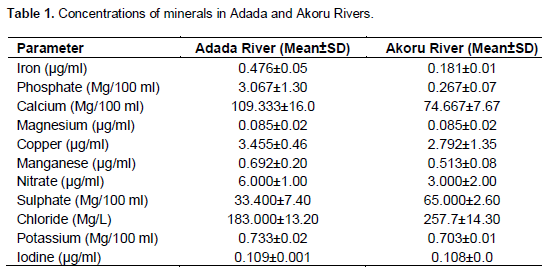
Table 1 shows the levels of iodine and environmental goitrogens (calcium, sulphate, chloride, potassium nitrate, copper, phosphate, manganese, iron and magnesium) in Adada and Akoru fresh water bodies in Uzo-Uwani Local Government Area of Enugu State, Nigeria. Iodine concentration was found to be 0.109±0.001 ppm and 0.108±0.001 ppm, respectively in both water bodies. The evaluated environmental goitrogens were as follows in Adada and Akoru Rivers: Calcium 109.333±16.0 and 74.667±7.67 ppm; sulphate 33.400±7.40 and 65.000±2.60 ppm; chloride 183.000±13.20 and 257.7±14.30 ppm; potassium 0.733±0.02 and 0.733±0.02 ppm; nitrate 6.000±1.00 and 6.000±1.00 ppm; copper 3.455±0.46 and 2.792±1.35 ppm; phosphate 3.067±1.30 and 0.267±0.07 ppm; manganese 0.692±0.20 ppm and 0.513±0.08 ppm; iron 0.476±0.05 and 0.181±0.01 ppm; magnesium 0.085±0.02 and 0.085±0.02 ppm, respectively. High values of these goitrogens in both rivers could be attributed to the high salt level of the two water bodies. For the proper utilization of iodine for thyroid hormone synthesis some mineral are required at the right concentration and proportion (Ujowundu et al., 2010).
The mineral nutrients are interrelated and balanced against each other in human physiology. They cannot be considered as a single element with circumscribed functions. For instance, sodium, calcium, magnesium and phosphorus serve individual and collective purposes in the body fluid regulation. Inadequate mineral intake generally produces deficiency symptoms which include anaemia, impaired healing of wounds, delayed blood clotting severe diarrhea and chronic renal failure. Selenium and iodine ingestion have to be regulated as deficiency can lead to extreme fatigue, endemic goiter, cretinism and recurrent miscarriages (Ujuwundu et al., 2012). The results of this research correlated with the work of Enechi et al. (2013). Some inorganic mineral nutrients have been reported to be antagonistic and interfere with iodine metabolism (Ujuwundu et al., 2012; Walsh, 2003). Iron (Fe) deficiency lowers the thyroid peroxidase activity - a heme-containing enzyme that catalyzes the initial steps in thyroid hormone synthesis. High calcium (Ca) diets or hard water high in Ca, may increase the need for additional iodine (Jooste et al., 1999). Mineral nutrient deficiencies such as zinc, copper, iron, also contribute to inability to use iodine well and this may lead to the development of Goiter (Osman and Fatah, 1981).
Mineral malnutrition can have a negative impact on thyroid function but in the presence of adequate iodine supplies, it is less common for such factors to cause problems (Gartan, 1988). High levels of minerals above the recommended daily allowance (RDA) have also been shown to be goitrogenic (Osman and Fatah, 1981).
The evaluated cations and anions are within the standards for drinking and cooking water (Lawrence, 2001). Considering the iodine-goitrogen ratio, Akoru water body would be a better source of iodine than Adada water body for aquatic and human population.
CONCLUSION
In conclusion, the high values of cations and anions in both Adada and Akoru water bodies support the fact that they are salt water bodies which was further substantiated by the high calcium concentration.
CONFLICT OF INTERESTS
The author(s) have not declared any conflict of interests
REFERENCES
|
Anderson M, Takkouche B, Egli I, Allen HE, de Benoist B (2005). Current global iodine status and progress over the last decade towards the elimination of iodine deficiency. Bull. World Health Org. 83(7):518-25. |
|
|
Banerjee RK, Bose A K, Chakraborty TK, De SK, Datta AG (1985). Peroxidase catgalysed iodotyrosine formation in dispersed cells of mouse extrathyroidal tissues. J. Endocrinol. 2(3):159. |
|
|
Delange F (2000). The role of iodine in brain development. Proc. Nutr. Soc. 59(1):75-9. |
|
|
Dissanayake CB, Chandrajith R, Tobschall HJ (1999). The iodine cycle in the tropical environment implications on iodine deficiency disorders. Int. J. Environ. Stud. 56(3):357. |
|
|
Enechi OC, Ibechem Augustine C and Ugwu Okechukwu PC (2013). Distribution of Iodine and some goitrogens in two selected water bodies (Kalawa and Adaoka Rivers) in Enugu State, Nigeria. Exp. Int. J. Sci. Technol. 12 (1):748-761. |
|
|
Eskin BA, Grotkowski CE, Connolly CP, Ghent WR (1995). Different tissue responses for iodine and iodide deficiency disorders. Int. J. Environ. Stud. 56(3):357. |
|
|
Expert Group on Vitamins and Minerals (EGVM) (2002). Draft report on "Safe upper levels for vitamins and minerals", London. pp. 205-214. |
|
|
Gaitan E (1983). Role of other naturally occurring goitrogens in the etiology of endemic goiter. Cassava toxicity and the thyroid. Res. Public Health Issues 207:27-34. |
|
|
Gartan E (1988). Goitrogens. Bailliers Clin. Endocrinol. Metab. 2:683-702 (review). |
|
|
Henniker JC (1949). The depth of the surface zone of a liquid. Reviews of Modern Physics. Rev. Mod. Phys. 21(2):322-341. |
|
|
JECFA (1989). WHO joint expert committee on food additives. WHO Food Additives Series 24. |
|
|
Jooste PL, Weight MJ, Krick JA, Louw AJ (1999). Endemic goitre in the absence of iodine deficiency in schoolchildren of the Northern Cape Province of South Africa. Eur. J. Clin. Nutr. 53(1):8-12. |
|
|
Kulshreshtha SN (1998). A global outlook for water resources to the year 2025. Water Resour. Manage. 12(3):167-18. |
|
|
Lawrence A (2001). Endemic Goiter. Endocrinology and Metabolism. McGraw Hill Professional. ISBN 9780070220010. |
|
|
Lowe DO (2006). Povidone-iodine-induced burn: case report and review of the literature. Pharmacotherapy 26(11):1641-5. |
|
|
Maekawa T, Igari SI, Kaneko N (2006). Chemical and isotopic compositions of brines from dissolved in water type natural gas fields in Chiba, Japan. Geochem. J. 40(5):475. |
|
|
Osman AK, Fatah AA (1981). Factors other than Iodine deficiency contributing to the endemicity of goiter in Darfur province (Sudan). J. Hum. Nutr. 35: 302-9. |
|
|
Patrick L (2008). Iodine: deficiency and therapeutic considerations. Alternat. Med. Rev. 13(2):116. |
|
|
Rasmussen KB, Ovesen K, Bulow I (2002). Relations between various measures of iodine intake and thyroid volume, thyroid nudularity, and serum thyroglobulin. Am J. Clin. Nutr. 76(5):1069-76. |
|
|
Smyth PP (2003). Role of iodine in antioxidant defence in thyroid and breast disease. BioFactors (Oxford, England). 19:30-121. |
|
|
Spitzwag C, Heufelder AE, Morris JC (2000). Thyroid iodine transport. Thyroid 10(4):30-321. |
|
|
Stoddard FR, Brooks AD, Eskin BA, Johannes GJ (2008). Iodine alters gene expression in the MCF7 breast cancer cell line: evidence for an anti estrogen effect of iodine. Int. J. Med. Sci. 5(4):189. |
|
|
Ujowundu CO, Kalu FN, Nwosunjoku EC (2010). Thyroid Function and Urine Iodine of Pregnant Women in Owerri, Nigeria. Nig. J. Biochem. Mol. Biol. 25(2):91-97. |
|
|
Ujowundu CO, Kalu FN, Nwosunjoku EC, Nwaoguikpe RN, Okechukwu RI, Igwe KO (2011). Iodine and Inorganic mineral contents of some vegetables, spices and grains consumed in Southeastern Nigeria. Afr. J. Biochem. Res. 5(2):57-64. |
|
|
Underwood EJ (1977). Trace elements in human and animal nutrition: 4th Edition. Academic Press: New York. pp. 43-57. |
|
|
Venturi S (2001). Is there a role for iodine in breast diseases? Breast 10(5):378-382. |
|
|
Venturi S, Venturi M (2009a). Iodine in evolution of salivary glands and in oral heath. Nutr. Health 20(2):119-134. |
|
|
Venturi S, Venturi M (2009b). Iodine, thymus, and immunity. Nutrition 25(9):977-983. |
|
|
Walsh S (2003). Iodine Nutrition, Vegan Society-Hosting by Spirit Quest, www.vegansociety.com/food/nutrition/iodine. |
|
|
Wu T, Liu GJ, Li P, Clar C (2002). Iodized salt for preventing iodine deficiency disorders. Cochrane Database System Review |
|
Copyright © 2024 Author(s) retain the copyright of this article.
This article is published under the terms of the Creative Commons Attribution License 4.0


