ABSTRACT
Rice is an important staple food crop that feeds over half of the global population and it has become the cereal that provides a major source of calories for the urban and rural poor in Africa. This research aimed to use simple sequence repeat (SSR) markers to evaluate the genetic diversity in rice (Oryza sativa and Oryza glaberrima) germplasm as breeding method. In the present study, 16 SSR markers were used across 48 genotypes or accessions obtained from Central Agricultural Research Institute (CARI), Suakoko, Liberia and Plant Genetic Resources Research Institute (PGRRI), Bunso, Ghana. DNA was extracted from 48 plants per accession without bulking to check the purity of the accession using the 16 SSR markers. Sixteen primers were acquired out of 20 primers which showed DNA amplification and polymorphism among the 48 rice accessions. The numbers of alleles detected by these 16 primers ranged from 1 to 16 with a mean of 5.25, while polymorphism information content (PIC) ranged from 0.06 to 0.66 with a mean of 0.35. The SSR markers were highly informative as generated by the power marker V3.25 software. The unweight pair group method with arithmetic averages (UPGMA) cluster dendrogram generated based on the 16 SSR markers grouped the accessions into 11 main clusters. At the similarity coefficients of 90%, the highly distance genetic diversity was found between 2 accessions; ACSS37 and ACSS1. Cluster X was the largest of all the clusters, while clusters VII and VIII were the second largest clusters with 7 accessions each. The outcome of this study should be useful to manage the gremplasm conservation and future rice genetic improvement.
Key words: Germplasm, genetic diversity, molecular markers, polymorphism, sequence repeat.
Rice (Oryza sativa 2n = 24), and a member of Poaceae family (Gramineae) is the world’s most important staple food crop that feeds over half of the global population, and it is cultivated in tropical and subtropical regions (Khush et al., 2005). Rice is grown in more than 114 countries, over an area of 161.4 m ha in a wide range of ecosystems, under varying temperature and water regimes, with the production of 466.7 mt (on milled basis) (Yousaf et al., 2016). According to Sanni et al. (2013), approximately 20 million farmers are engaged in rice production in sub-Sahara Africa (SSA) and about 100 million people depend on it directly for their livelihoods in the continent.
Rice is rapidly becoming a staple food in the African diet; and its production in sub-Sahara Africa (SSA) continues to be outplaced by consumption because of low and stagnated production. Imported rice accounts for 50% of sub-Saharan Africa’s rice requirement (Lee et al., 2010). Rice is no longer a luxury food but has become the cereal that constitutes a major source of calories for the urban and rural poor. Rice production in SSA has been bedeviled with conditions such as environmental degradation due to pesticide usage, excessive water usage, and nutrient contamination, methane emission and ammonia volatilization and all these conditions require urgent attention (Lee et al., 2010).
A wide range of technologies are available and can be used as tools for reducing these adverse consequences of rice production but they are, however, not extended to majority of rice growers or farmers (FAO/WHO, 2010). Rice production demand increases and little attention has been paid to the improvement of Liberian and Ghanaian rice germplasm evaluation and the genetics of some quality traits. Thus, there is very little information available on the genetic diversity of Liberian and Ghanaian rice germplasm for crop improvement and conservation purposes. Referencing an urgent need to increase and improve the production of rice in Africa in order to meet up with the high demand is necessary. The need for increasing rice cultivation depends not only on cultural/traditional practices, but also on their inbuilt genetic potential to withstand stresses. A successful breeding program will depend on the genetic variability for achieving the goals of improving the crop and producing high yielding varieties (Badiane et al., 2012). The first step in achieving this is to evaluate and characterize available rice germplasm or genotypes at molecular level; as genotypic diversity will reveal important traits or accessions of interest to plant breeders (Sugihara, 2017).
Rice and their culture
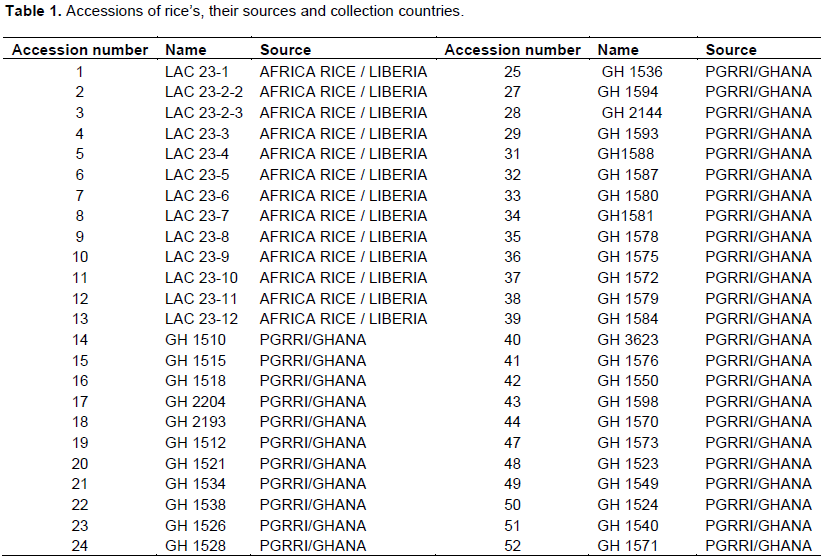
The experiment was organized to study the genetic diversity of 52 rice accessions from Liberia and Ghana using SSR markers (Table 1). Two grams of young, fresh and healthy rice leaves were sampled, cleaned with 70% ethanol and placed in 2 ml Eppendorf using the cetyltrimethylammonium bromide (CTAB) method described by Earl (2010). In addition, samples were stored at 4°C until use.
Molecular markers and polymerase chain reactions
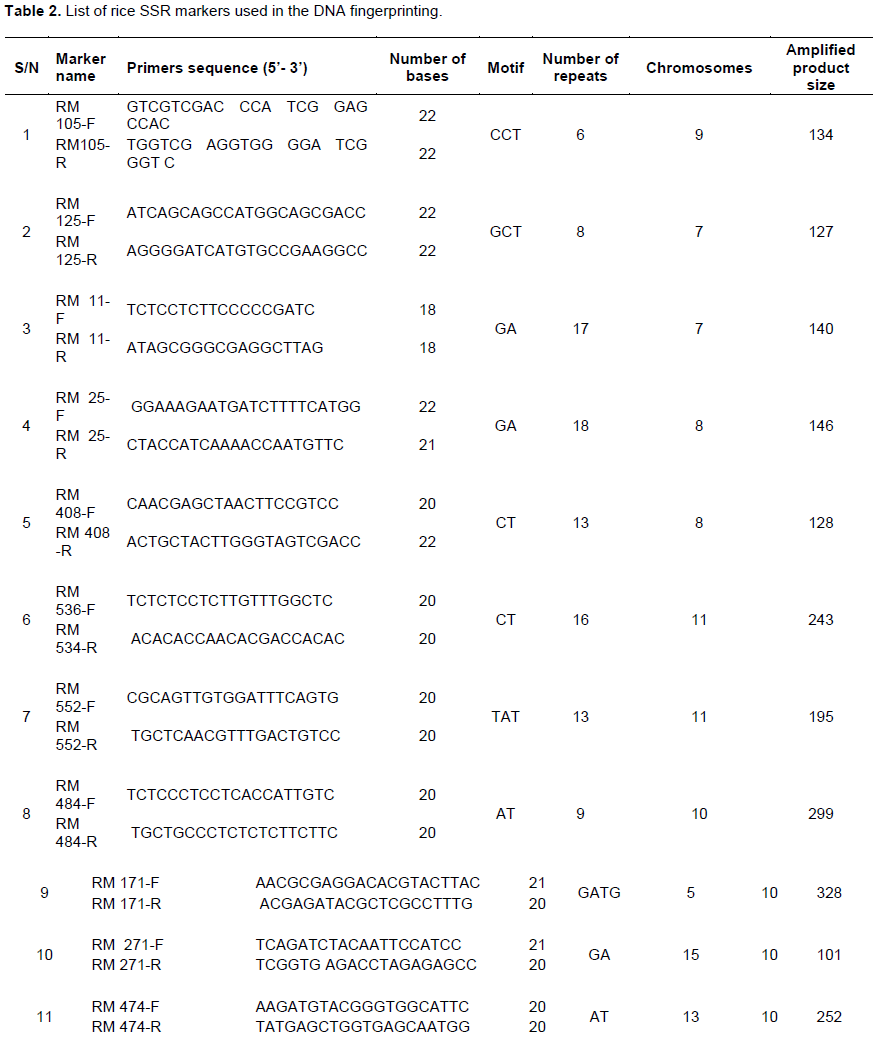
Sixteen simple sequence repeat markers (SSR) covering 20 chromosomes of rice were used to detect polymorphism among the rice accessions (Table 2). The SSRs markers were procured from Metabion International AG (Germany). Polymerase chain reaction (PCR) was carried out in Techne prime thermal cycler (Labnet International Inc., California, USA) and GeneAmp PCR System 9700 (Applied Biosystems, USA) of 96-well plates with heated lid to reduce evaporation. The DNA from the 48-tagged rice samples were fingerprinted using SSR markers. Nine µl of premix of 3.3 µl double distilled water, 5.0 µl buffer + dNTPs (deoxynucleotide triphosphates), 0.02 µl MgCl2, 0.6 µl forward and reverse primers and 0.08 µl Taq polymerase was pipetted into 200 µl tube. After that 1 µl of 4 ng/µl DNA was added to make a total volume of 10 µl. The reaction mixtures were short spun and placed in the thermal cycler and ran with the following program: 3 min at 94°C followed by 30 s at 94°C for denaturing, 30 s at 55°C for annealing, 1 min at 72°C for extension, repeated for 35 cycles, and final extension of 7.0 min at 72°C amplified samples were held at 4°C.
Gel electrophoresis
The PCR products were separated using horizontal agarose gel electrophoresis. The amplified DNA fragments were separated on 2.0 % agarose gel stained with 0.005% gel-red solution. After that, 2 µl loading dye (6X Bromophnol blue) was added to the PCR products. The gel was set, the PCR products were added in wells submerged in 1× TBE buffer. The samples were then run at 120 volts for 2 h, observed on the UV transilluminatar and photographed.
Bands of DNA scoring
The qualitative points from the amplified polymorphic products were scored as (0) which indicates no symptoms and (1) which indicates symptoms for each marker allele-genotype combination, and the markers were calculated using Power Marker V3.25 computer software.
SSR data analysis
A sequential agglomerative and hierarchical clustering dendrogram which illustrates the genetic relationship among the rice genotypes, was constructed using weighted pair group method with arithmetic mean (UPGMA) algorithm for clustering and simple matching (SM) similarity coefficient in NTSYS software (2.2). Sequential and hierarchical nested (SAHN) option was employed (Klingenberg et al., 2010). Gene diversity, allele frequency, number of alleles, heterozygosis and polymorphic information content (PIC) values of the markers were calculated using Power Marker V3.25 computer software.
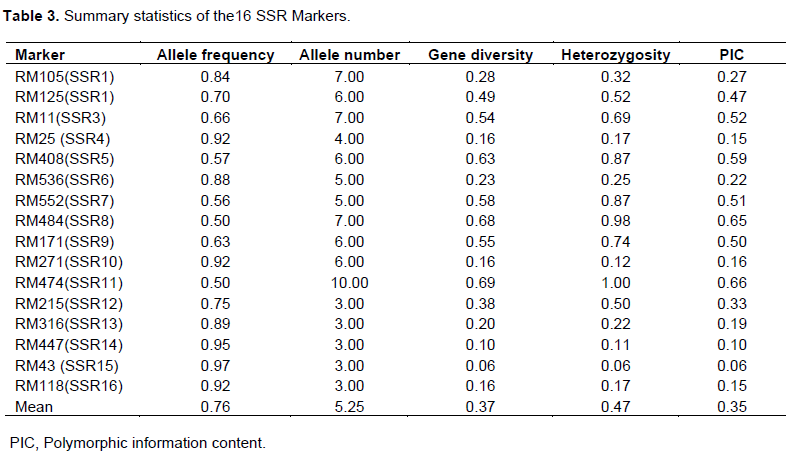
Sixteen SSR loci were evaluated for their efficiency of polymorphism against 48 accessions of rice received from 2 countries. Among the 20 SSR primers used in this study, 16 yielded scorable amplification products (Table 3). Major allele frequency revealed by the markers across the 48 rice accessions ranged from 0.50 Rm474 (11) to 0.97 RM43 (15), with a mean of 0.76. The number of alleles per locus ranged from SSR Marker RM474, RM484, RM11, RM105, and RM125, recorded as the highest number of allele number detected (10.00, 7.00, 7.00, 7.00, 6.00) (Table 3). RM536 and RM 552 (5.00, 5.00) followed this in that order, the least were RM 215, RM 316, RM 447s, RM43 and RM 118, with the total mean of 5.25. RM474 (11) had the highest heterozygosis of 1.00 followed by RM484 (8) 0.98 and RM552 (5) 0.87, with a scoring of 0.47 heterozygosis. While SSR markers RM43 (15) 0.06 and RM447 (14) 0.11 recorded the least heterozygosis with an average of 0.47 (Table 3). The mean PIC value for all markers used was 0.35 and ranged between 0.06 and 0.66 in loci RM43 (15) and RM474 (11), respectively. Gene diversity ranged from 0.06 in RM43 (15) to 0.69 in RM11 (3), with a mean of 0.37. Generally, the allele frequency of all the markers was below 0.95, indicating that they were all polymorphic in character (Table 3).
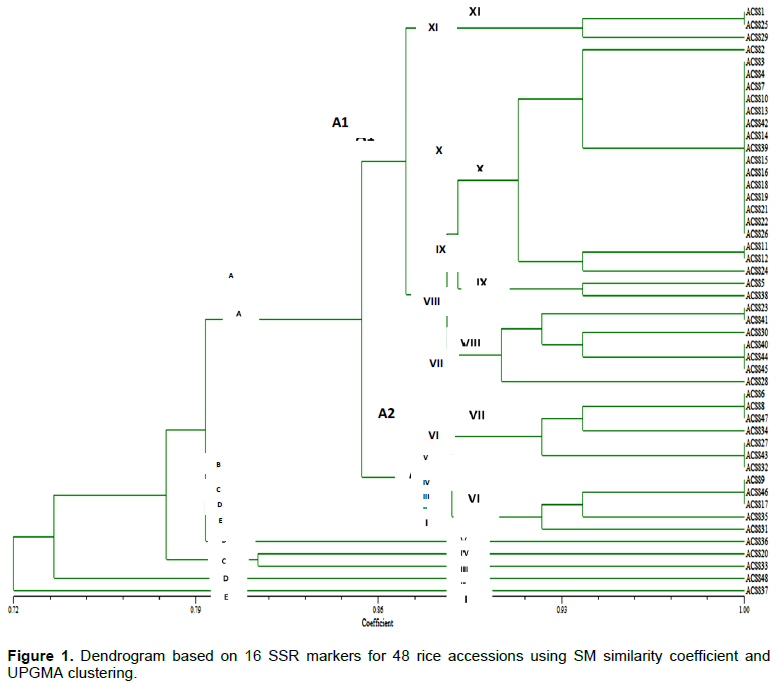
Genetic relationship revealed by the six 16 primers using similarity coefficients based on unweight pair group method with arithmetic means (UPGMA) is shown in Figure 1. From the figure, a dendrogram was constructed to ascertain the genetic diversity and relatedness among 48 rice genotypes. The dendrogram indicated similarity values ranging from 1.00 to 0.72, with 11 main clusters: I, II, III, IV, V, VI, VII, VIII, IX, X and XI at similarity coefficients of 90%. The highest genetic distance was found between accessions; ACSS37 from Ghana and ACSS1 from Liberia. These accessions took the first and last positions of the dendrogram, respectively. Cluster X was the largest of all the clusters and it contained 19 accessions, 13 of the accessions were from Liberia while 6 came from Ghana, with 4 sub-clusters. Clusters VII and VIII were the second largest clusters with 7 accessions each. Cluster VII had 3 sub-clusters, while cluster VIII comprised of 4 sub-clusters. Clusters I to V contained 1 accession each, and cluster VI had 5 accessions with 3 sub-clusters. Cluster IX comprised of 2 accessions and was sub divided into 2 sub-clusters. The accessions 17, 9, 47, 8, 6, 44, 40, 26, 22, 21, 19, 18, 39, 15, 14, 42, 13, 10, 7, 4, 3 and 2 that came from both Ghana and Liberia were very similar at 100% similarity coefficient.
Plant breeders referenced information on genetic diversity and relatedness in crop germplasm because it assists them in planning crosses (Chakhonkaen et al., 2012). This information is useful in designing strategies used to improve traits, maintain and manage germplasm in Genetic Resource Centres, or enhance the genetic base of future varieties. Hence, to effectively maintain, evaluate and utilize germplasm, it is important to investigate the extent of available diversity. In the present work, a set of rice genotypes were subjected to diversity analysis based on variation in SSR molecular profiles.
Twenty SSR markers were collected from two countries, with their genetic variability characterized and assessed among 48 rice accessions. Sixteen out of these 20 SSR markers revealed genetic polymorphism and ensured unambiguous identification of the rice accessions. Small numbers of molecular markers were used to assess genetic diversity as shown earlier in other studies.
Sixteen SSR primers yielded 84 alleles ranging from RM105 (1) to RM118 (16), with an average of 5.25 alleles per locus and were similar to those earlier reported by Chen et al. (2002). They used Indian quality rice germplasm and reported an average of 6.80 alleles per locus. The number of alleles detected in the present study is lower than those observed by Chakhonkaen et al. (2012), who reported 127 alleles that ranged from 4 to 12 alleles using 19 InDel (Insertion-Deletion) markers to evaluate genetic diversity in 101 rice accessions. In another study, Hossain et al. (2012) found an average of 3.8 alleles per locus in rice using Bangladeshi ARLs. The obtained results were also comparable to 2.0 to 5.5 alleles per SSR locus for various classes of microsatellites reported by Kong et al. (2000), who used a different set of rice germplasm. Wong et al. (2009) reported the genetic relationship and diversity analysis among 8 Bario rice cultivars using 12 SSR primers, detecting a total of 31 alleles. The average genetic diversity of 0.37 obtained was lower compared to 0.55 previously reported by Sajib et al. (2012), who used 9 SSR markers to study genetic diversity among 12 aromatic landraces of rice. Polymorphism information content (PIC) is a measure of polymorphism among varieties for a marker locus used in linkage analysis (Sajib et al., 2012). It ranged from 0.06 to 0.66, with an average of 0.35 in this study. The PIC range and average observed in this study are similar to those reported earlier by Meti et al. (2013); they reported PIC range of 0 to 0.74 with an average of 0.58 using 12 SSR markers to estimate genetic diversity in 48 aromatic rice genotypes merge. Higher values of PIC might be the result of diverse genotypes and lower values might be the result of closely related genotypes (Coldea et al., 2010).
The dendrogram showed that there were genetic variations among the 48 rice accessions in relation to the used SSR primers. The similarity coefficient of these accessions ranged from 0.72 to 1.00, which is an indication of the genetic variation among the accessions based on the SSR primers. The observed variation among the accessions is an indication that SSR markers can reveal diversity existing among rice accessions. This is in agreement with earlier findings of Meti et al. (2013); they reported that SSR markers are effective tools in differentiating rice genotypes. In some relevant research, classification methods based on genetic background were not been concerned well (Tokpah et al., 2017), which resulted in duplication of same species and time-consuming. The accessions were grouped into 11 main clusters at similarity coefficients of 90%. The highest genetic distance was found between the accessions; ACSS37 from Ghana and ACSS1 from Liberia. These accessions had the first and last positions of the dendrogram, respectively. In addition, at a similarity coefficient of 90%, cluster X was the largest of all the clusters and it contained 22 accessions with 4 sub-clusters. Cluster X sub-cluster 3 from Ghana and Liberia had 13 and 9 accessions which showed 100% similarity, revealing that no genetic variability exist among these accessions based on the 16 SSR primers. The similarity could have risen from informal exchange of seeds (germplasm) among farmers, but given different names because of the differences in dialect and ethnic groups. It is important to eliminate duplicates to enable effective management, conservation of germplasm and reduced workload for further experiment.
The present work helped in strengthening the background necessary for promoting and breeding of improved varieties of rice. At the molecular level, 48 rice accession from Ghana and Liberia were observed. Among the studied accessions, 18 out of the 48 accessions were distant from the rest and were selected to constitute a core collection for further improvement. In addition, broadening the genetic base of rice in breeding programs is urgently needed to enhance heterozygosis in crosses and create heterotic progenies. Overall, this study has explained the relevance of employing molecular markers to determine genetic distances and relationships in rice. Moderate level of genetic diversity was observed among the rice accessions.
The authors have not declared any conflict of interests.
REFERENCES
|
Badiane FA, Gowda BS, Cissé N, Diouf D, Sadio O, Timko MP (2012). Genetic relationship of cowpea (Vigna unguiculata) varieties from Senegal based on SSR markers. Genet. Mol. Res. 11(1):292-304.
Crossref
|
|
|
|
Chakhonkaen S, Pitnjam K, Saisuk W, Ukoskit K, Muangprom A(2012). Genetic structure of Thai rice and rice accessions obtained from the International Rice Research Institute. Rice 5(1):19.
Crossref
|
|
|
|
Chen M, Presting G, Barbazuk WB, Goicoechea JL, Blackmon B, Fang G, Kim H, Frisch D, Yu Y, Sun S, Higingbottom S (2002). An integrated physical and genetic map of the rice genome. Plant Cell Online 14(3):537-545.
Crossref
|
|
|
|
Coldea R, Tennant DA, Wheeler EM, Wawrzynska E, Prabhakaran D, Telling M, Habicht K, Smeibidl P, Kiefer K (2010). Quantum criticality in an Ising chain: experimental evidence for emergent E8 symmetry. Science 327(5962):177-180.
Crossref
|
|
|
|
Earl DA (2012). Structure harvester: a website and program for visualizing structure output and implementing the Evanno method. Conserv. Genet. Resour. 4(2):359-361.
Crossref
|
|
|
|
Food and Agriculture Organization/World Health Organization (FAO/WHO) (2010). Joint FAO/WHO Expert Committee on Food Additives. Meeting, and World Health Organization. Evaluation of Certain Food Additives: Seventy-first Report of the Joint FAO/WHO Expert Committee on Food Additives. World Health Organization. Vol. 71.
|
|
|
|
Hossain MA, Piyatida P, da Silva JA, Fujita M (2012). Molecular mechanism of heavy metal toxicity and tolerance in plants: central role of glutathione in detoxification of reactive oxygen species and methylglyoxal and in heavy metal chelation. J. Bot. 2012 Apr 2; 2012.
Crossref
|
|
|
|
Klingenberg CP (2010). Evolution and development of shape: integrating quantitative approaches. Nat. Rev. Genet. 11(9):623.
Crossref
|
|
|
|
Kong J, Franklin NR, Zhou C, Chapline MG, Peng S, Cho K, Dai H (2000). Nanotube molecular wires as chemical sensors. Science 287(5453):622-625.
Crossref
|
|
|
|
Lee HM, Baines MJ, Mattia A, Knaap A(2010). sucrose oligoesters Type I and Type II." Safety evaluation of certain food additives, P 249.
|
|
|
|
Meti N, Samal KC, Bastia DN, Rout GR (2013). Genetic diversity analysis in aromatic rice genotypes using microsatellite based simple sequence repeats (SSR) marker. Afr. J. Biotechnol. 12(27): 4238-4250.
Crossref
|
|
|
|
Sajib AM, Hossain M, Mosnaz AT, Hossain H, Islam M, Ali M, Prodhan SH (2012). SSR marker-based molecular characterization and genetic diversity analysis of aromatic landreces of rice (Oryza sativa L.). J. BioSci. Biotechnol. 1(2):107-116.
|
|
|
|
Sanni KA, Touré AA, Diagne A, Bachabi F, Murori R, Singh RK, Sié M (2013). 6 Rice Varietal Release Systems in Africa. Realizing Africa's rice promise. CAB International, Wallingford. pp. 79-86.
Crossref
|
|
|
|
Sugihara S (2017). Utilization of Soil Microbes as a Temporal Nutrient Pool to Synchronize Nutrient Supply and Uptake: A Trial in the Dry Tropical Croplands of Tanzania. In. Soils, Ecosystem Processes, and Agricultural Development. Springer Japan. pp. 357-379.
Crossref
|
|
|
|
Tokpah DP, Li H, Newmah JT, Page Z, Luther Z, King CF, Smith MS, Voor VM (2017). Biological control of potential antagonistic bacteria isolates to restrict Magnaporthe grisea infection on rice. Afr. J. Microbiol. Res. 11(27):1108-1119.
Crossref
|