Plant breeders need to stay alert in developing new cultivars on a steady basis to respond to the need of ever increasing human population by exploring either natural variability present in germplasms or generating new variability. Field experiment was conducted at five locations of Western Ethiopia during the 2016/2017 main cropping season to study interrelationships and genetic variability present in Desi type chickpea genotypes using agro-morphology. Genomic DNA was extracted using the cetyltrimethylammonium bromide (CTAB) method with some minor modifications to further examine the extent of genetic variability at DNA level using inter simple sequence repeat (ISSR) markers. The analysis of variance (ANOVA) based on quantitative traits revealed highly significant genetic differences (P<0.01) among the tested genotypes for all the traits considered except number of branches per plant and number of seeds per pod. Wider genetic variations were noticed among inter cluster Euclidian distance measured based on the standardized means for the 11 quantitative traits. Grain yield, one hundred seed weight, number of pods per plant, plant height, and grain filling period had higher contributions in clustering of the genotypes. Grain yield showed significant (P≤0.01) positive association with plant height, branches number and one hundred seed weight, whereas significant negative correlation was evident with days to flowering and maturity. Higher genetic similarity (98%) and lowest similarity (0.21) were detected among tested genotypes using ISSR markers. Using morphological and molecular evaluation, the existence of genetic variability was evident, indicating the likelihood of hybridization in genetically dissimilar varieties.
Pulses are important local food crops in Ethiopia that cannot be overemphasized because of their significant role in sustaining food security, balancing ecosystem, and generating revenue in Ethiopia (Keneni et al., 2012). Among pulses, chickpea (Cicer arietinum L.; 2n = 2x = 16), one of the ancient crops in Ethiopia, is self-pollinating grain legume of Near -East origin and currently grown in over 50 countries of the world. Archaeological evidence from Lalibela caves discovered seed samples dated to Iron Age (Dombrowski, 1970).
Currently, with ever increasing population growth, the need for food in terms of quantity, quality and other products of plants are constantly increasing, whereas diminishing of agricultural lands, emergence of new pathogens, climate change, also consumer needs and preferences present increasing risks to crop production. As this increasing population requires food to sustain, the only way for plant breeders to stay alert in developing new cultivars on a steady basis to respond to these changes resides in exploring either natural variability present in germplasm or generating new variability by using different breeding methods such as crossing, inducing mutations and gene transfer (Kharkwal and Shu, 2009).
Along the line, geneticists devoted their time in developing different mechanisms for detection of genetic variations. Morphological and agronomical characterization are the earliest methods employed and still take up high attention to study genetic variability, even though it is exposed to strong environmental influence (Ismail et al., 2001). On the other hand, molecular methods can be used for the determination of genetic variation, excluding all environmental influences, by detecting the variation at the DNA level (Bayraktar and Dolar, 2009). Among DNA markers, inter simple sequence repeat (ISSR) was preferred in genetic diversity, phylogeny, genomics and evolutionary studies due to their easiness to use, cost effectiveness, and their multiple amplification products (Reddy et al., 2002).
The ultimate goal of the breeders is to improve yield. However, as yield and its components are polygenic in nature they are highly subjected to interaction of many other traits which influence yield directly or indirectly. Therefore, improvement aimed at single traits would be deceptive, especially when trait under consideration is a polygenic trait. For this reason, it is desirable to examine the comparative contributions of various interacting components to yield. Thus, the association among yield concurrently with its component parameters provides the basis for the effective selection in breeding schemes, than selection that is merely based on yield (Kumar and Shukla, 2002). The simple correlation analysis is one of the effective statistical tools used to assess the interaction between two traits. Besides, principal component analysis (PCoA) was used to differentiate major contributing traits to the total underlying variation in the correlation coefficients by reducing the large set of variables to a single set (Lule et al., 2012).
Therefore, the present study was conducted with the objective of estimating interrelationships among quantitative traits and genetic variability present in Desi type chickpea genotypes using agro-morphology and ISSR.
Plant materials and sites description
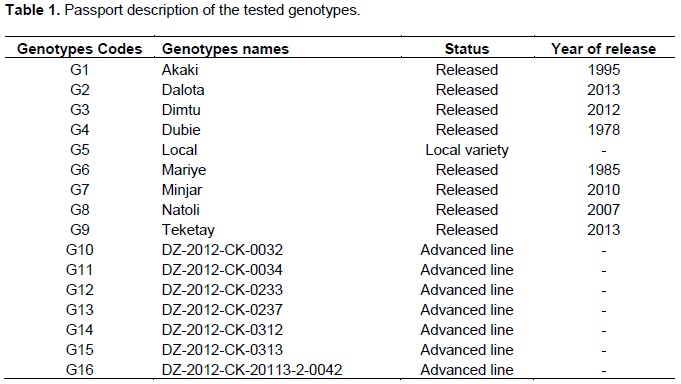
Field experiment was conducted at five locations viz., Shambu (09° 32'N 037° 04'E), Hawa Galan (08° 38' N 034° 50'E), Mata (08° 34' N 034° 44'E), Alaku Belle (08° 37'N 034° 42'E) and Badesso (034° 42'E 034°47'E), Western Ethiopia, during the 2016/2017 main cropping season. A total of 16 Desi type chickpea varieties viz., 8 cultivars released over three decades, 1 local variety and 7 advanced lines collected from Debre Zeit Agricultural Research Center (DZARC) were used (Table 1). The experiment was laid out in a randomized complete block design with three replicates and with plot size of 3 m length and 1.8 m width. All other crop management practices and recommendations were applied uniformly to all varieties as recommended for the crop.
Data collection and statistical analysis
Days to 50% flowering, days to 90% maturity, grain filling duration, number of pods per plant, number of seeds per pod, plant height, number of branches per plant, one hundred seed weight, and grain yield data were collected based on chickpea (C. arietinum L.) descriptor (IBPGR, ICRISAT and ICARDA, 1993) and were subjected to analysis using appropriate software. Genomic DNA was extracted using the CTAB method (Borsch et al., 2003) with some minor modifications. Clustering was performed using MINITAB14 software (Minitab Inc., 2003). Correlation coefficients between characters were estimated based on the standard procedure. Principal component analysis (PCA) was computed by using MINITAB14 software (Minitab Inc., 2003), to identify the most important contributing traits, to the total variations observed among the genotypes.
Molecular data scoring was performed as discrete statistics, using a binary matrix as "0" for the absence of a band, "1" for the presence of a band, and "?" for the ambiguous band. POPGENE version 1.32 (Yeh et al., 1999) was used to investigate and characterize genetic diversity in terms of a number of polymorphic loci, percent of polymorphism, means of Nei's genetic diversity and Shannon index (Nei, 1972). NTSYS- pc version 2.02 (Numerical Taxonomy System; Rohlf, 2000) and Free Tree 0.9.1.50 (Pavlicek et al., 1999) software programs were used to compute Jaccard's similarity coefficient as:
Where, ‘a' is the total number of bands shared between individuals i and j, ‘b' is the total number of bands present in individual i, but not in individual j and ‘c' is the total number of bands present individual j, but not in individual i. Neighbor Joining (NJ) and Unweighted Pair Group Method with Arithmetic Averages (UPGMA) clustering method was computed by using Free Tree 0.9.1.50 Software and NTSYS- pc software, respectively. Principal coordinate analysis (PCoA) was figured using PAST version 1.18 (Hammer et al., 2001) software based on Jaccard's coefficient similarity for further examining the patterns of variation among individual genotypes.
Cluster and distance analyses
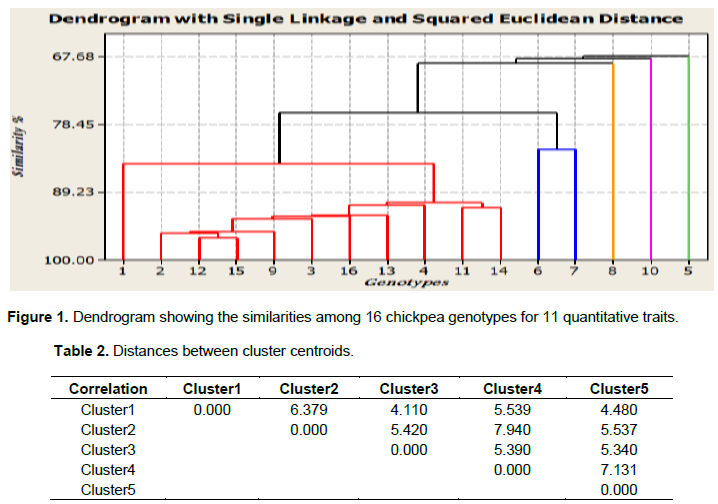
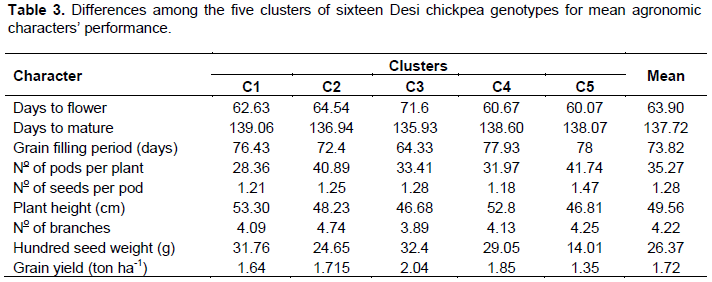
The D2 values based on the pooled mean of genotypes resulted in classifying the 16 genotypes into five distinct clusters. Two clusters and three solitary groups were formed at 80% similarity level (Figure 1). This result agrees with the report of Malek et al. (2014) who compounded 31 mutant soybean genotypes into five clusters using nine morphological traits. It is usually expected that characters with larger absolute values, closer to unity within the first principal component influence the clustering more than those with lower absolute values, closer to zero (Chahal and Gosal, 2002). The mean value of the nine quantitative characters in each cluster is presented in Table 2.

Inter cluster Euclidean distance measured based on the standardized means for the eleven quantitative traits revealed relatively wider genetic variation (D2) between cluster two and cluster four, followed by cluster four and cluster five (Table 2). This indicates that the hybridization between the genotypes of these clusters would yield desirable segregates, with accumulation of favorable genes in the segregating generations. The greater distance between the two clusters shows wider genetic distance between their genotypes.
The number of member genotypes varied from cluster to cluster. The first cluster accommodated the largest number of genotypes (11 genotypes or 69%) than any other cluster. The group is distinguished by lateness in days to maturity, high plant height and hundred seed weight. Cluster (C2) with 2 members or 12% of the total population constituted two chickpea varieties (G6 and G7) that are distinguished by their high number of pods per plant and seeds per pod. Among the solitary groups, genotype G8 is characterized by its high yield, late flower, early maturity and short grain filling period; genotype G10 showed intermediate hundred seed weight and early flower, whereas genotype G5 showed early flowering, late maturity and long grain filling period tied with inferior yield (Table 3).
Principal component analysis
As suggested by Johnson and Wichern (1988), considering the first four components with an eigenvalue greater than one, it explains a substantial portion of the total variations and is constituted by values of 36, 25.8, 14.8 and 11.8%, respectively (Table 4). Grain yield, hundred seed weight, number of pods per plant, plant height, and grain filling period showed greater absolute values of eigenvectors, either in the first, second and/or third principal components. This indicated that these traits had higher contributions in clustering of these genotypes, according to their class. In other word, selection efforts based on these traits are effective and productive.
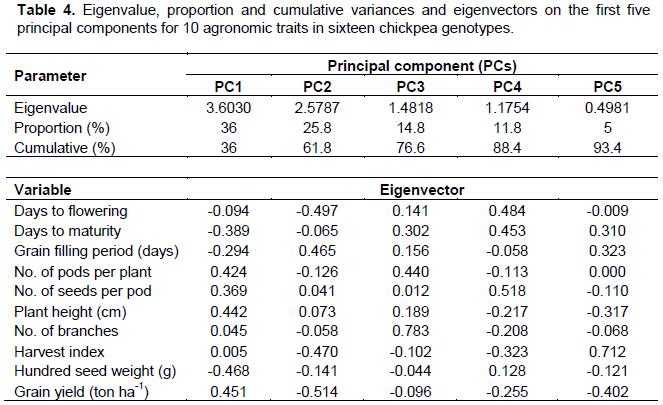
Buta and Mekbib (2011) reported contribution of number of seeds per plant and number of pods per plants in differentiating chickpea varieties. Similar report was made by Keneni et al. (2012) indicating that traits such as pod and seed setting, dry matter accumulation, nitrogen and grain yields, growth rate and grain production efficiency, along with nitrogen fixation had higher contribution in clustering of chickpea genotypes. According to Nawab et al. (2013), number of pods per plant, seeds per plant, biological yield, and grain yield had great contribution in clustering chickpea genotypes. In disparity to this, other traits such as days to flowering, days to maturity, seeds per pod and harvest index contribute more in fourth and fifth principal components. Nevertheless, the gross contribution of variation accounted on these coordinates is as low as 16.8% and therefore, had a very restricted role in clustering these genotypes.
Correlations between characters
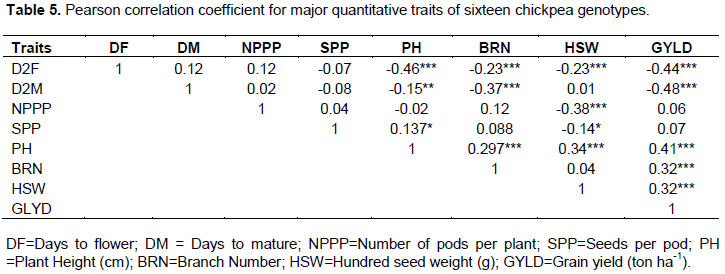
In fact, grain yield and its components are polygenic traits that are strongly influenced by the environment and therefore, it is important to analyze the data for the relative contribution (correlation/association) of various components to yield performance. Grain yield exhibited significant (P≤0.01) negative correlation with days to flowering (r = -0.44) and maturity (r = -0.48). Similar results were reported from moisture stressed areas in Australia, where higher yields were manifested by genotypes characterized by early flowering and rapidly setting pods (Berger et al., 2003). Nevertheless, this scenario may not be the case in areas where moisture is available, thereby, supporting late flowering and maturing genotypes to exploit the available moisture and perform better than early genotypes (Wallace and Yan, 1998). Tesfamichael et al. (2015) tested twenty chickpea genotypes in areas holding long and short rain across Kenya and reported that the genotypes gave better yield under long rain areas, than the short rain areas.
Grain yield showed significant positive association with plant height (r = 0.40), branches number (r=0.33) and hundred seed weight (r=0.32). Numerous findings indicated that any positive increase of plant height, branches number and hundred seed weight improve grain yield of chickpea (Saleem et al., 2002; Raval and Dobariya, 2003; Toker, 2004; Farshadfar and Farshadfar, 2008; Ali et al., 2009; Zali et al., 2011; Malik et al., 2010; Keneni et al., 2012). Among these traits, plant height had the strongest association with the grain yield, suggesting that this trait may be important yield predictors and perhaps it is the most important for yield improvement in chickpea (Table 5). Even if it was not significant, grain yield was positively associated with the number of pods per plant and the seeds number per pod. A weak association between grain yield and these characters may have emanated from the impact of environmental factor that was expected when genotypes are grown in a diverse environment. Generally, it is evident that traits that had positive and significant correlation with grain yield can be used by plant breeders for indirect selection of high yielding genotypes and enables them to shape breeding programs.

Genetic diversity analysis based on ISSR markers
ISSR-PCR amplification and banding pattern
A total of nine ISSR primers were initially screened for molecular analysis to depict genetic diversity, among which only three primers that produced relatively clear amplification, and explicit bands were selected. The scope of all amplified bands ranged from about 300 to 2000 base pairs. A total of 25 bands were scored from three primers viz. nine for UCB-834, eight for UCB-810 and UCB-880 primers. Buta and Mekbib (2011) also reported 38 bands using four primers. Amplification of one hundred and fifty-five bands from fifteen individuals of three genuine species of rhubarb using the 15 ISSR primers was reported (Wang, 2011). Twenty-one polymorphic loci were found in three assessed primers with a total of 84% polymorphisms. One hundred and seven polymorphic loci were stated in 11 assayed primers with the total of 90% polymorphisms in faba bean (Behailu, 2016). In the present study, Nei's gene diversity and Shannon's Information index with values of 0.29±0.19 and 0.44±0.26 were noticed among the chickpea genotypes tested. Parallel with this result, Nei’s gene diversity and Shannon index with values of 0.27 and 0.41 were also reported among Ethiopian faba bean varieties (Behailu, 2016). The mean number of alleles and effective number of alleles were documented to be 1.84±0.37 and 1.51±0.39, respectively.
Genetic similarity
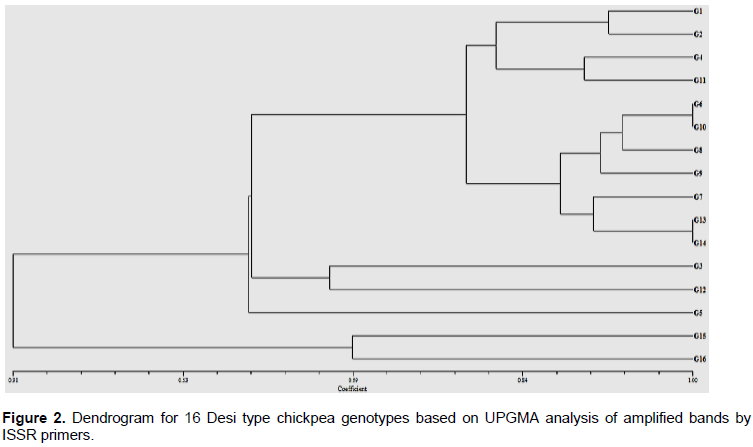
Genetic similarities were calculated according to the method developed by Jaccard (1908). UPGMA and Neighbor Joining analysis were used to construct dendrogram for desi type chickpea genotypes by using Jaccard’s similarity coefficient. The average of Jaccard genetic similarity among chickpea cultivars and advanced lines varied from 0.21 to 0.98. Lower and upper values of genetic similarity coefficient indicate the minimum and maximum similarity, respectively. Higher genetic similarity (98%) was detected between G1 and G2, G6 and G10, and G13 and G14, whereas lowest similarity (0.21) was between G3 and G15. Above all, a genetic similarity coefficient indicates that varieties or groups that are genetically similar could not be used in the hybridization, as they are not fine in attaining the required traits. A similarity coefficient that varied from 0.41 to 0.97 was also attested among 19 released chickpea varieties (Buta and Mekbib, 2011). Jaccard’s similarity coefficients which ranged from 0.01 to 0.90 were also reported among 125 cultivars of chickpea (C. arietinum L.) of Indian origin, using ISSR markers (Aggarwal et al., 2015).
Cluster analysis based on ISSR DNA marker
The chickpea genotypes were grouped into five clusters in a UPGMA-based dendrogram. In the first cluster, G15 and G16 were encompassed, whereas a local landrace (G5) was clustered in the second cluster. G3 and G12 were grouped in the third cluster, whereas G13, G14, G7, G9, G8, G10, and G6 were grouped in the fourth cluster. G1, G2, G4, and G9 were placed in the fifth cluster (Figure 2). The clustering pattern observed indicated that the released varieties, advanced lines and local landraces showed clear separation, except in few cases, where released varieties and advanced lines were amalgamated. The current clustering pattern observed in this study agrees with Aggarwal et al. (2011) in their studies of genetic diversity in 115 chickpea genotypes from India using ISSR and assembled the individuals into five clusters, depending on their genetic similarity. Similarly, Gautam et al. (2016) reported three broad clusters of chickpea genotypes, obtained from dendrogram of 13 chickpea accession, including accessions from Ethiopia.

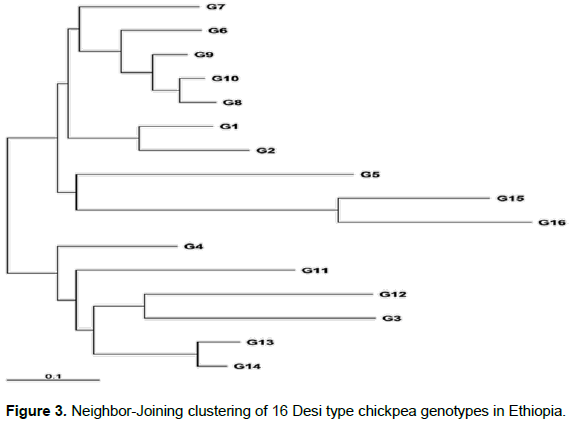
Neighbor-Joining based clustering grouped the 16 Desi type chickpea genotypes into three major clusters from the main node (Figure 3) comprising, seven, three, and six chickpea genotypes in the first, second, and third cluster, respectively. In the first cluster, one advanced pipeline, and six released varieties were included. In the second cluster, a local variety and two released varieties were grouped and in the third cluster, two released varieties and four advanced pipeline genotypes were grouped together.
Principal coordinate analysis
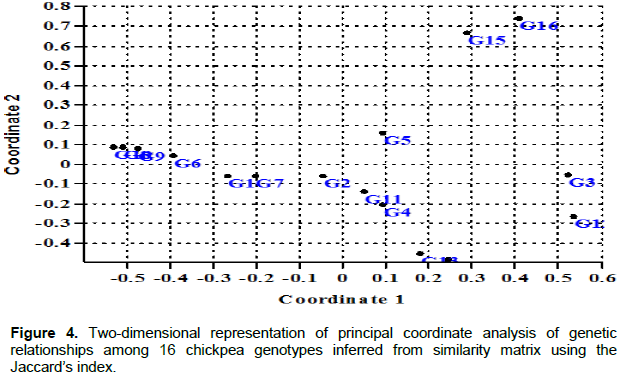
In the first three coordinates of the PCoA, eigenvalues of 1.95, 1.61 and 1.16 with variance of 18.24, 15.11 and 10.88%, respectively, were recorded. Except in a few cases where there were intermixed clusters, the clustering pattern observed in two-dimensional PCoA fully agrees with that of the clustering pattern observed in UPGMA and Neighbor Joining clustering (Figure 4). Behailu (2016) also reported the resemblances of clustering pattern among UPGMA, NJ and PCoA in faba bean varieties.