ABSTRACT
Diversity assessment of vanilla (Vanilla species) in Kenya is a key strategy for germplasm conservation and improvement. Production of vanilla crop in Kenya is limited due to inadequate knowledge on genetic diversity. This study was carried out to characterize 76 vanilla accessions from five counties of Kenya using 14 microsatellite DNA markers. POPGENE version 1.32 was used to compute variety factors. Amplicons ranged between 1 and 4. A total of 27 (96.43%) alleles were observed and their number ranged from 1.00 to 2.00 with a mean of 1.93. Effective allele values ranged from 1.00 to 1.99 with a mean of 1.63. Gene diversity ranged from 0 to 0.50 with a mean of 0.35, mean Shannon information index was 0.50 and Polymorphic information content values ranged from 0 to 0.38 with a mean of 0.35. Jaccard’s similarity coefficient ranged from 0.08 to 1.00 with an average of 0.54. Unrooted phylogenetic tree was constructed in DARwin 6.0.8 using Unweighted Pair Group Method with Arithmetic Mean, clustering the samples into 3 main clusters (A 99.6%, B 98.96% and C 100%) and 6 sub-clusters (A1, A2, B1, B2, B3 and C1). Vanilla accessions grown in Kenya have a broad genetic background but low genetic diversity. Results inform the need to introduce other vanilla species as sources of genetic variation for breeding.
Key words: Genetic variation, DNA markers, breeding, Kenya.
Vanilla (Vanilla species) belongs to the Orchidaceae family which comprises more than 25,000 species distributed in more than 800 genera (Govaerts et al., 2006). Vanilla is native to tropical forests of southeastern Mesoamerica (Hagsater et al., 2005). In the nineteenth century, vanilla species were introduced into other tropical countries like Asia and Africa from the original Mexican cultivated stock (Lubinsky and Risterucci, 2008). The crop was introduced in Kenya from neighbouring countries like Uganda. Vanilla is believed to have come from Madagascar and Reunion through Christian missionaries to Uganda (Mayawa, 2001). According to Bory et al. (2008), Madagascar and Reunion were the leading producers of vanilla
since its introduction. In 2016, Madagascar, Reunion and Kenya produced 2,926, 2,304 and 15 tons year-1, respectively (FAO, 2016).
Orchid species are grown for their flowers and vanilla is the only genus of the orchid family whose species produces a commercially important flavour (Stern and Judd, 1999). Stern and Judd (1999) studied the comparative vegetative anatomy and systematics of the species of vanilla and found that vegetative anatomical characters have some phylogenetic value. The basic chromosomal number of the vanilla genus is 16 (x=16), however, Vanilla planifolia, Vanilla pompona and Vanilla tahitensis are diploid with 2n=32 (Hurel-py, 1938; Purseglove et al., 1981).
Vanilla flavour is the second most expensive spice traded in the world market after saffron (Minoo et al., 2008). According to Oyugi (2018), vanilla crop has a huge monetary value. The crop can fetch a farmer as much as KES. 16,000 or more per vine if managed well (Oyugi, 2018). The high monetary value is on account of crop’s many uses that include flavouring food, drinks, soaps, ointments, perfumes and cosmetics. A vine of vanilla can bear up to 80 beans. One vanilla bean measuring 10 to 12 cm long can fetch KES. 200 and a hectare can accommodate over 200 vines (Oyugi, 2018). Vanilla venture can act as a source of income to farmers and earn the country foreign exchange.
According to Shabbir (2018), vanilla crop is well grown in other countries such as Uganda, Comoros and Madagascar in both small and large scale. Most parts of Kenya have favourable climatic conditions for cultivating vanilla crop and there is both local and export markets ready upon its maturity. The major markets for vanilla beans include European countries and United States (Shabbir, 2018).
V. planifolia Andrews (syn. V. fragrans), V. tahitensis and V. pompona Scheide are commercially cultivated species for the production of natural vanilla flavour (Rao and Ravishankar, 2000). Natural vanilla flavour is made up of a large number of aromatic compounds with sweet fragrances (Sharp et al., 2012). Natural vanilla flavour is obtained as an extract from cured vanilla beans and is universally used as aromatic flavouring in food, beverages, pharmaceutical and cosmetic industries (Verpoorte and Korthou, 2007; Kaur and Chakraborty, 2013). Vanillin flavour is found to have antimutagenic, anticarcinogenic and antimicrobial properties. The antimutagenic property has ability to reduce chromosomal damage caused by X-ray and ultraviolet (UV) light (Keshava et al., 1998). Anticarcinogenic property have effects in a family of DNA-PK inhibitors (Duran and Karran, 2003) while antimicrobial property acts against the yeasts (Fitzgerald et al., 2003).
Limited knowledge on genetic diversity is the major bottleneck in wider breeding programmes, hybridization and dissemination of vanilla crop in Kenya because of unavailability of quality vanilla planting materials despite the fact that most parts of Kenya have favourable climatic conditions for cultivating vanilla crop (Shabbir, 2018). In most cases, when vanilla plant vines are transported from one agro-ecological zone to another they end up drying. A few vanilla vines may adapt to the new environment. According to Oyugi (2018), vanilla is one of the orphaned crops in Kenya and no information has been documented on available vanilla accessions found in Kenya. Studies of genetic variation in crop species is an important tool for germplasm conservation and crop improvement (Mason et al., 2015). It was necessary to assess the extent of diversity in vanilla accessions found in Kenya. The information will form a base for future vanilla crop improvement programmes. The objective of the present study was to determine the genetic diversity among vanilla accessions from selected counties of Kenya using simple sequence repeat markers.
Experimental site
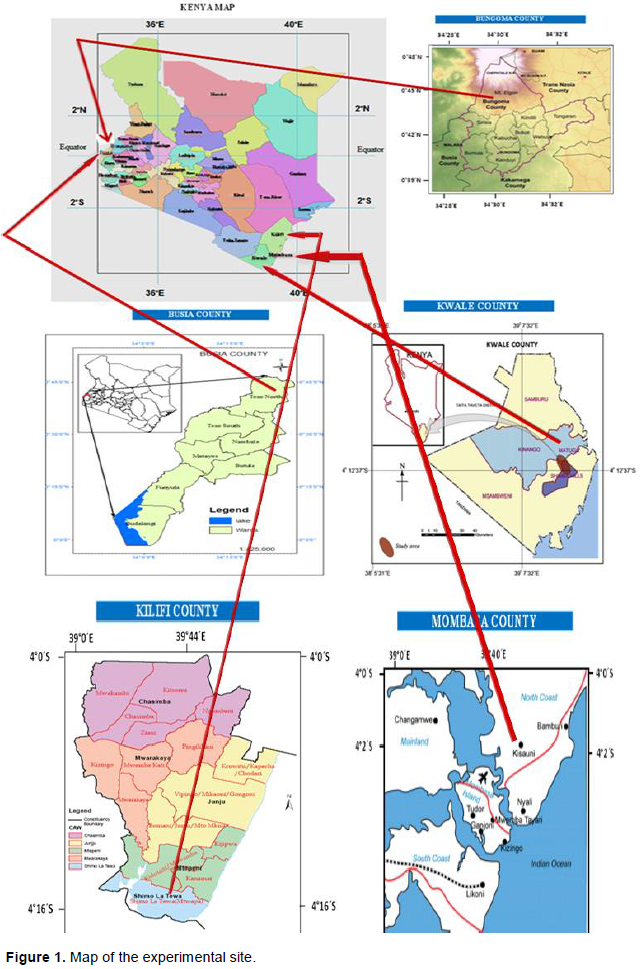
A total of 76 vanilla accessions were collected in-situ from five different agro-ecological zones in Kenya; Bungoma county (Latitude 0° 45’ 16.799” N and Longitude 34° 30’09.270”E), Busia county (Latitude 0° 47’ 11.113” N and Longitude 34° 24’ 26.339”E), Kwale county (Latitude 4° 09’ 58.223” S and Longitude 39° 34’ 18.127”E), Kilifi county (Latitude 4°16’ 53” S and Longitude 39° 44’ 41.306”E) and Mombasa county (Latitude 4° 02’ 12.7608”S and Longitude 39° 40’10.4556”E) (Figure 1). Genotyping was done in the Marker Assisted Breeding Laboratory at KALRO-FCRI, Njoro in Nakuru county.
Plant accessions collection
Purposive network sampling method was done in-situ due to the fewer number of vanilla farmers in Kenya. Global Positioning System (GPS) data was taken in each county of the study. Young vanilla leaves were sampled based on morphological distinction of the crops and stored in labelled falcon tubes containing silica gel (Xtrack) for DNA extraction. Plants with similar features growing in ecologically distinct county were assumed to be different; such plants were sampled and used in the analysis. All plant materials sampled were coded with slight modifications as previously described by Oyoo et al. (2015).
Coding modifications according to the description of Oyoo et al. (2015), involved reflection of the county and the number of accessions collected. Example; ‘BGM 1, BGM 2, BGM 3…..BGM 8’.
Total nucleic acid extraction
Total DNA was extracted from dried young plant leaf samples using CTAB protocol according to Ibrahim (2011), with slight modifications. Modifications to Ibrahim (2011), involved introduction of a preliminary cleaning stage to remove phytates, increased centrifugation time for initial stages, this ensured that cell debris and the proteins were well decanted and hence minimized contamination. Final centrifugation time was reduced in final precipitation and washing stages to avoid pelleting of carryover impurities. Also, precipitation time was increased from the reported 3 min to 18 h of Ibrahim (2011). This allowed ample time for DNA to precipitate and increased the concentration of DNA recovered.
DNA Quantification
The purity and concentration of DNA samples were determined using Nanodrop spectrophotometry and Agarose gel electrophoresis. DNA samples were run in a 1% agarose gel containing Ethidium bromide staining dye at voltage of 100 V and a current of 400 mA for 30 min and visualized on a UV Trans illuminator.
Selection of SSR markers and PCR genotyping
A total of 14 sets of SSR markers (Table 1) selected from earlier publications according to Bory et al. (2008), were amplified using PCR process. The SSR markers were selected based on coverage and distribution in all the linkage groups, high PIC values (>0.6) and maximum number of alleles detected. The primers for SSR were synthesized by Inqaba Biotech, South Africa.

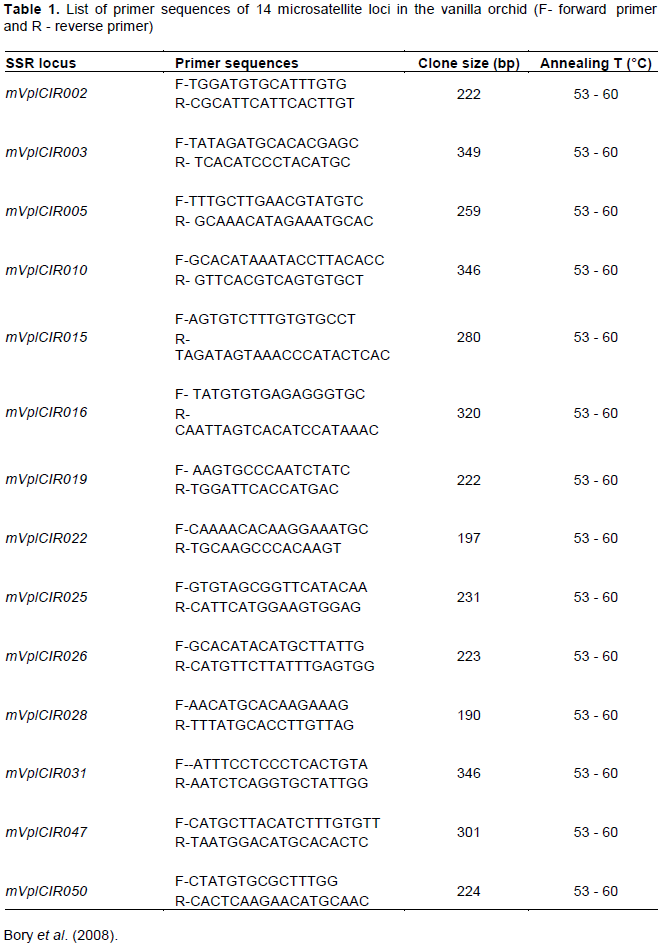
Polymerase chain reaction (PCR) was done in a 96 universal gradient, 2720 thermal cycler (Applied Biosystems) in 20 µl final volume containing DNA template (20 ng) 2.0 μl, primer forward (10 μmol/L) 0.5 μl, primer reverse (10 μmol/L) 0.5 μl, 10x PCR buffer 2.0 μl, 10 mM dNTPs (2.5 mM each) 1.6 μl, MgCl2 (2.5 mM) 1.2 μl, Taq DNA polymerase (HiMedia) (5 U/μl) 0.25 U (0.05 μl) and dd H2O 12.15 μl. The amplification conditions for PCR profile were initial denaturation at 95°C for 5 min, 35 cycles of 95°C for 30 s, specific annealing temperature for each SSR primer for 1 min, extension at 72°C for 2 min and final extension at 72°C for 10 min and infinite time at 4°C for storage. The PCR amplicons were mixed with 5 μl bromophenol blue DNA loading dye and run in a 2% agarose gel containing 3 μl ethidium bromide staining dye in a 1x Sodium Borate (SB) buffer at voltage of 80 V and a current of 400 mA for 1 h and visualized in a UV trans illuminator.
Scoring of the markers
Scoring of marker alleles of SSRs was done manually from the gel images. A simple numerical scoring method was used where 1 was used to represent presence of the expected band while 0 was used to represent absence of the band.
Phylogenetic analysis
The utility of markers was quantified in terms of number of amplicons per primer, percent polymorphism, polymorphic information content (PIC). [The PIC values of individual primers were calculated based on the formula PIC = 2 × F (1- F), where F is the frequency of the bands].
Genetic variation at each locus was characterized in terms of the number of alleles, observed heterozygosity (HO), expected heterozygosity (HE), Shannon's diversity index (I), gene flow (Nm), and gene differentiation coefficient (Gst) using the genetic analysis packages POPGENE Version 1.32 (Yeh, 2000). Gene diversity (GD) and polymorphic information content (PIC) were measured by calculating the shared allele frequencies (Weir, 1996) using PowerMarker 3.25 (Liu and Muse, 2005).
Nei’s gene diversity (Nei, 1973) for the whole sample (Ht) was calculated to estimate the genetic diversity across the counties while genetic diversity within the populations (Hs) was used to determine diversity within counties. The proportion of genetic diversity among populations (Gst =1-(HS/Ht)) was also calculated for each primer combination and for all the primers. These estimates were partitioned into respective county population groups using the POPGENE software package Version 1.32.
Phylogenetic analysis was carried out to estimate evolutionary relationships among the vanilla accessions. All phylogenetic analyses were done in DARwin 6.0.8 using binary data from the gel image marker scores. Single data dissimilarity was calculated, and factorial coordinates calculated from the resulting dissimilarity data used to determine segregation of individual samples. Unrooted phylogenetic tree was constructed using Unweighted Pair Group Method with Arithmetic Mean (UPGMA) agglomerative hierarchical clustering method (Sokal and Michener, 1958) from distance matrices based on genetic distances.
Quality and quantity of DNA
The quality and quantity of the isolated DNA was good for PCR. Sample DNA concentrations ranged from 62.5 to 3421.7 ng/µl while sample purity was between 1.71 and 2.09. All the primers produced expected product sizes. Some samples showed no bands (indicating absence of the target loci), one band (scored as homozygous at the amplified loci) while others are multiple bands (scored as heterozygous at the amplified loci). Representative gel images are as shown in Figure 2.
Polymorphism of the markers
Fourteen SSR primers used in the study resulted in amplified fragments which varied in size from 100 to 500 bp (Figure 2). The utility of markers was quantified in terms of observed number of alleles, effective alleles, gene diversity and Shannon's Information index (Kimura and Crow, 1964). Number of amplicons per primers ranged from 1 to 4 with only one marker giving one allele (mVplCIR031). A total of effective alleles were 22.76 and the number of alleles per primer ranged from 1.00 to 1.99 with a mean of 1.63. Observed number of alleles was 27 while number per primer ranged from 1 to 2 with a mean of 1.93. Based on the results, the effective number of alleles was lower than the observed number of alleles (Table 2) showing strong geographic differentiation in the population informing that the observed genetic diversity was mainly due to geography than the original evolution.
Gene diversity indices ranged from 0 to 0.50 while mean Shannon information index was 0.5 which suggested that the vanilla accessions studied had less genetic diversity. This finding shows that vanilla generally has a narrow genetic background as supported by the findings in India (Sreedhar et al., 2007), Mexico (Besse et al., 2004; Soto, 1996), and Reunion Island (Cibrian, 1999) who worked in different regions with different technologies and found the results within the same range. Polymorphic information content of the markers ranged from 0 (mVplCIR031) to 0.375 (mVplCIR025). The primer with 0 PIC value was monomorphic showing that it lacked the ability to differentiate between the accessions while the primer with the highest PIC had the highest resolution. This is an indication that the markers used revealed little polymorphisms between the accessions.
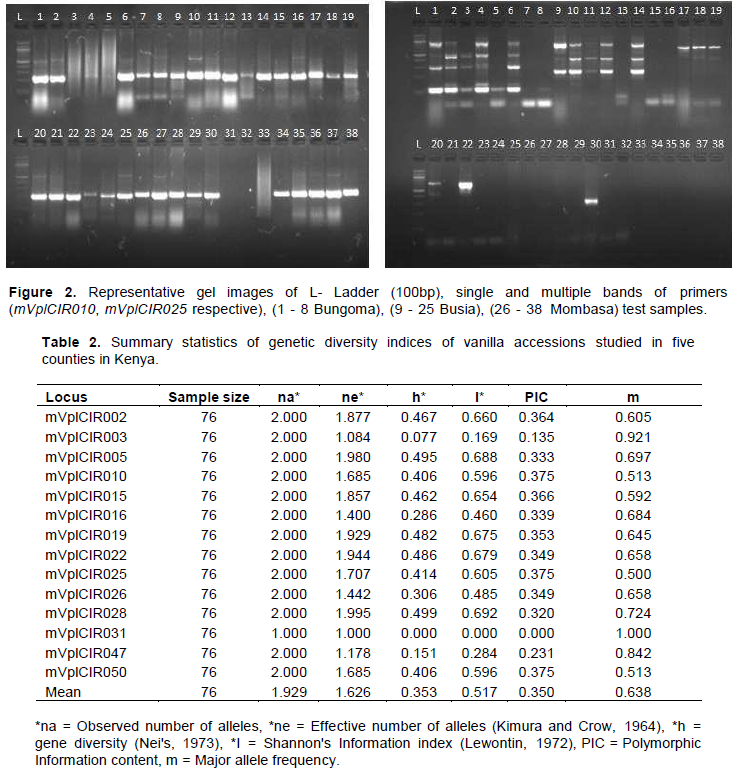
A total of 27 (96.43%) alleles were identified and out of the 14 markers used in this study, 13 markers were polymorphic while one (mVplCIR031) monomorphic. This indicated that alleles with high frequencies contributed more to the effective number of alleles in this study. This frequency is higher than that reported by Gigant (2011), who observed 57.83% alleles using 19 similar primers in Comoros Island. This may be due to the large sampling area used in the present study and that perhaps the study used more effective sample collection strategies. Besse et al. (2004) identified 76.3% alleles using RAPD markers in Mexico. This shows that SSR markers have better resolution of distinguishing vanilla accessions than RAPDs. However, the polymorphic alleles identified in this study are significantly lower compared to the findings of Hu et al. (2019), who used SNP markers. SNP markers are generally more effective than SSR markers. mVplCIR031 was the most frequently observed allele 1.0 while mVplCIR025 was the least frequently observed marker because it had 0.5 chance of being observed as shown in Table 2. This shows that marker mVplCIR031 showed the least variation among the accessions studied while marker mVplCIR025 was the most variable.
Gene diversity
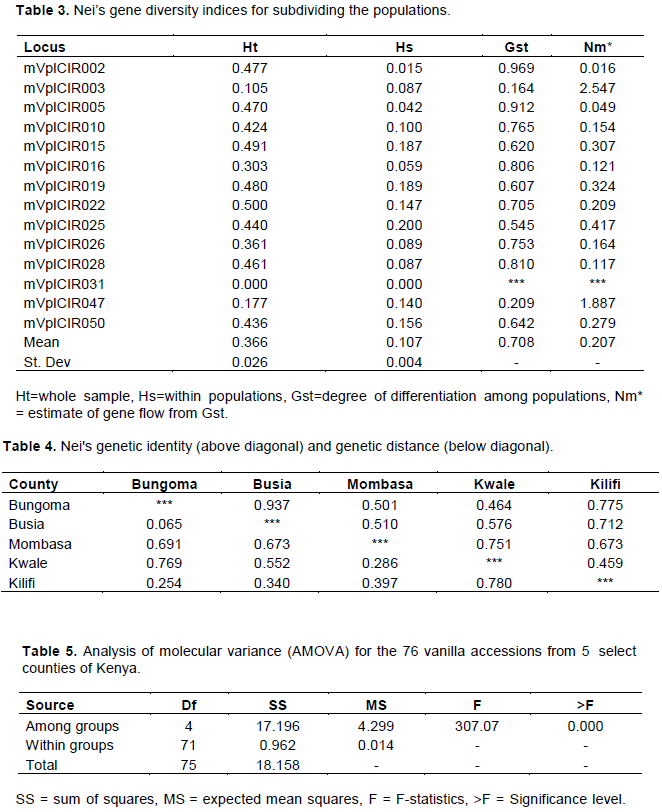
The average estimated haplotype diversity in the entire population (Ht= 0.37) was higher than the weighted average of estimated haplotype diversities in the subpopulations (Hs=0.11) and the differentiation among populations was high (Gst=0.71). The highest Ht was observed at locus mVplCIR022 (Ht=0.50) indicating that this was the most polymorphic and most informative locus within the population. The lowest haplotype diversity in the population was observed at locus mVplCIR031 (Ht=0.00) showing that this locus was monomorphic, and no diversity information could be deduced from it. All the other loci showed varied levels of genetic diversity ranging from 0.11 to 0.5 (Table 3).
There was low genetic diversity within subpopulations (Hs), and it ranged from 0.00 to 0.19. The highest diversity within subpopulations was at locus mVplCIR019 (Hs = 0.19) indicating that this locus had the highest resolution in segregating vanilla accessions from different counties and lowest at locus mVplCIR031 (Hs= 0.00) showing that this locus was not able to differentiate vanilla accessions based on the counties of origin (Table 3).
In the present study, the mean differentiation among populations was high (Gst =0.71). The highest Gst was recorded at locus mVplCIR002 (Gst = 0.97) while no Gst was calculated for locus mVplCIR031 because the primer was monomorphic and therefore had zero Hs and Ht values. Mean estimated gene flow was high for this study (Nm = 0.21). The highest Nm was recorded at locus mVplCIR003 (Nm = 2.56) while no gene flow was estimates at locus mVplCIR031 because of nil Gst value (Table 3).
In autogamous plant species, efficient gene dispersion is ensured by seeds while pollen is the source of gene diversity in allogamous species (Nybom, 2004). As such, populations of autogamous species are more strongly differentiated, but less variable than populations from allogamous species which are less differentiated but are more variable (Nybom, 2004). In our study, the calculated GST value in Kenyan Vanilla spp. (0.71) was higher than that reported by Gigant (2011) in Guadalupe for autogamous Vanilla spp. such as Vanilla humblotii (Gst = 0.520), Vanilla barbellata (Gst = 0.558) and Vanilla claviculata (GST = 0.623). The strong differentiation but less variability is characteristic of self-fertilized plants as is often in vanilla which exhibit genetic variability among populations rather than within, with high GST and low Hs (Nybom, 2004). Results presented herein, therefore confirmed autogamy as the major mating system in Vanilla spp. in Kenya. The high estimated gene flow (Nm = 0.21) observed in this study can therefore be explained to be as a result of inbreeding. This was demonstrated by Campagne et al. (2012) in Vanilla mexicana populations using reproductive biology experiments. This shows that vanilla accessions in Kenya have a small genetic diversity due to constant inbreeding and informs the need to introduce new cultivars to as sources of genetic variation for breeding and hybridization purposes.
Genetic of vanilla between distance counties
The highest genetic distance and lowest genetic similarity were recorded between Kwale and Kilifi counties (0.78, 0.46) while the lowest genetic distance and highest genetic similarity were between Busia and Bungoma (0.07, 0.94). Vanilla accessions in Busia and Bungoma showed 94% identity showing that they are very close genetically and could have shared a common source since the counties border each other closely while accessions collected from Kilifi showed the least similarity to those from Kwale at 46% identity (Table 4).
Analysis of molecular variance (AMOVA) was used to partition among and within the genetic variation of the vanilla accessions. A total of 94.714% of the variation was observed among the accessions that were produced within the counties while the variation revealed within populations was 5.29% (Table 5) indicating that Vanilla spp. grown in Kenya has very little diversity and some variations observed may be due to microclimatic conditions.
Factorial analysis
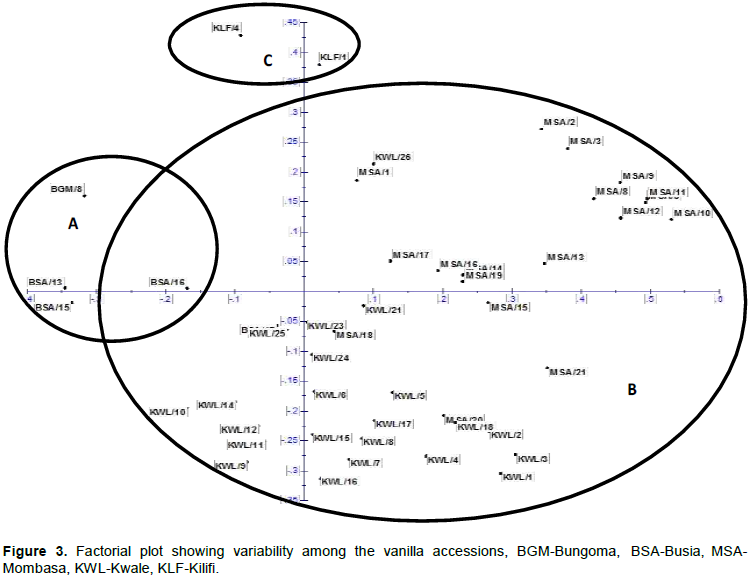
Factor analysis was used to describe variability among the vanilla accessions and group them into clusters. The accessions were segregated into three distinct groups A, B and C according to their county of origin (Bungoma and Busia ‘A’, Kwale and Mombasa ‘B’ and Kilifi ‘C’). Accessions from Busia and Bungoma counties were aggregated together (A) into indistinct group showing that vanilla species in these areas are closely genetically related. Cluster B was the most inclusive containing accessions from Mombasa and Kwale indicating that vanilla accessions in these counties have similar genetic makeups perhaps due to the same original sources. However, some accessions from Busia county were closely related to accessions from Mombasa and Kwale, moreover, they were found at the intersection of the two clusters A and B. This may be attributed to the fact that the accessions may have been transported by farmers or researchers to these counties. Accessions from Kilifi county segregated on their own showing that they were genetically distinct from other counties as shown in Figure 3.
Phylogenetic trees
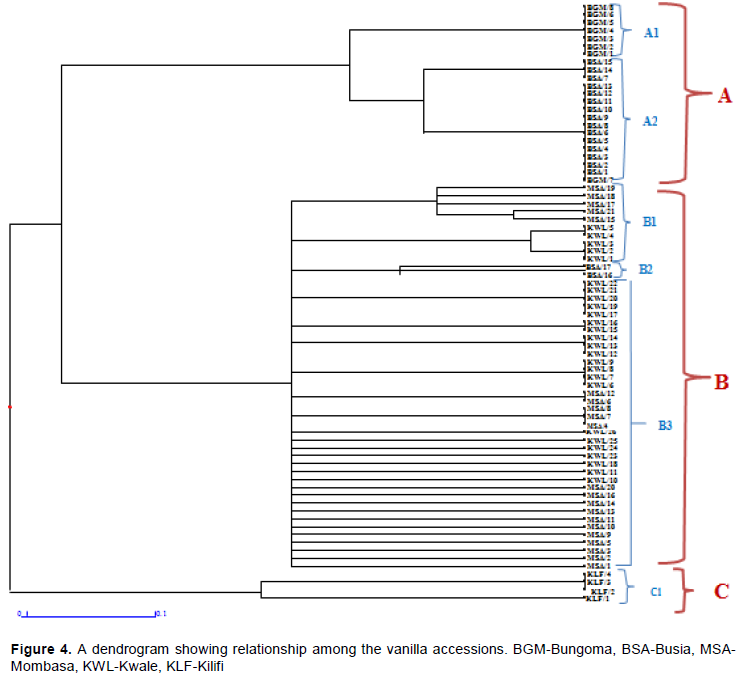
The primers used clustered the samples into 3 main clusters (A, B and C) according to the county of origin and 6 sub-clusters (A1, A2, B1, B2, B3 and C1) as shown in Figure 4. Most accessions within a sub-cluster were probably duplicates, meaning they were genetically identical. The genetic closeness of vanilla accessions may result from asexual reproduction which is the most common mode of propagation and geographical locations closeness. This observation is supported by Divakaran (2006), who observed that clonal propagation of vanilla limits the genetic variability in the crop especially in countries where the crop was introduced. Low genetic diversity may also occur because of successful establishment of a few well adapted genotypes which are rapidly propagated despite multiple introductions (Li et al., 2006).
Cluster A comprised accessions from Bungoma (A1) and Busia (A2) counties. These were the accessions with the least diversity with average of 99.6% similarity index. Vanilla accessions from Mombasa, Kwale and a few from Busia (B1, B2 and B3) clustered together in cluster B and showed some level of diversity among the accessions ranging from 98.96 to 100% while vanilla accessions from Kilifi clustered on its own as C with 100% similarity index. The Jaccard’s similarity coefficient ranged from 0.083 to 1.00 with an average of 0.54 among all the 76 accessions used. The genetic relationship among the accessions was presented in the dendrogram which was constructed from the gel marker.
CONCLUSION AND RECOMMENDATION
Little information has been documented on vanilla crops in Kenya. This is the first study that used microsatellites to characterize vanilla species grown in Kenya. The study established that germplasm grown in the five counties of Kenya have low genetic diversity. The SSR analysis used in this study allowed delineation of vanilla accessions and provided a good detail of variations among the vanilla accessions indicating that SSR markers are suitable for characterizing germplasm and studying population genetics of vanilla species in Kenya.
Molecular characterization of vanilla species from select counties of Kenya showed that autogamy was the main system of reproduction. This is an important step for vanilla breeding programmes in Kenya. The study also lays the basis for use of more advanced molecular platforms such as genome wide sequencing in order to establish more diversity in cultivated vanilla accessions in Kenya.
The authors have not declared any conflict of interests.
This project was financed by CESAAM Grant award collaborated with Egerton University in Kenya and self-sponsored. The authors are very thankful to KALRO-Njoro (Food Crops Institute) staff for their support during the research period, agricultural extension officer at Mabanga Agricultural Training Centre, ‘Mr. Felix Wamukota’ for locating farmers and research institutes that grow vanilla crop in Kenya, the Department of Crops, Horticulture and Soils Egerton University staff and colleagues for their support during the research.
REFERENCES
|
Besse P, DaSilva D, Bory S, Grisoni M, Lebellec F, Duval MF (2004). RAPD genetic diversity in cultivated vanilla: Vanilla planifolia and relationships with Vanilla tahitensis and Vanilla pompona. Plant Science 167(2):379-385.
Crossref
|
|
|
|
Bory S, Lubinsky P, Risterucci AM (2008). Patterns of introduction and diversification of Vanilla planifolia (Orchidaceae) in Reunion Island (Indian Ocean). American Journal of Botany 95:805-815.
Crossref
|
|
|
|
|
Campagne P, Smouse PE, Varouchas G, Silvain JF, Leru B (2012). Comparing the vanOosterhout and Chybicki Burczyk methods of estimating null allele frequencies for inbred populations. Molecular Ecology Resources 12:975-982.
Crossref
|
|
|
|
|
Cibrian JA (1999). Variation genetic of Vanilla planifolia in Mexico. Ph.D. Thesis, UNAM, Mexico City P 105.
|
|
|
|
|
Divakarana MNB (2006). Conservation of Vanilla species, invitro. Scientia Horticulturae pp. 175-180.
Crossref
|
|
|
|
|
Duran S, Karran P (2003). Vanillins: A novel family of DNA-PK inhibitors. Nucleic Acids Research pp. 5501-5512.
Crossref
|
|
|
|
|
Fitzgerald DJ, Stratford M, Narbad A (2003). Analysis of the inhibition of food spoilage yeasts by vanillin. International Journal of Food Microbiology 86(1-2):113-122.
Crossref
|
|
|
|
|
Food and Agriculture Organization (FAO) (2016). Production data 2016. Retrieved on 19th January, 2019 from
View
|
|
|
|
|
Gigant AB (2011). Nineteen polymorphic microsatellite markers from two African Vanilla species: across-species transferability and diversity in a wild population of V. humblotii from Mayotte. Conservation Genetics Resources pp. 121-125.
Crossref
|
|
|
|
|
Govaerts R, CampacciM, Holland A, Baptista D (2006). World Checklist of Orchidaceae.
|
|
|
|
|
Hagsater E, Soto-Arenas MA, Salazar-Chavez GA, Jimenez-Machorro R, Lo'pez-Rosas MA, Dressler RL (2005). Las orqu ıdeas de Mexico. Orqu Ideas Ygente. Instituto Chinoin, Mexico pp. 38-71.
|
|
|
|
|
Hurel-Py G (1938). Etude des noyauxvégétatifs de Vanilla planifolia. Revue de Cytologieet de Cytophysiology Végétables 3:129-133.
|
|
|
|
|
Hu Y, Resende MFR, Bombarely A (2019). Genomics-based diversity analysisof Vanilla species using a Vanilla planifolia draft genome and Genotyping-By- Sequencing. Scientific Reports 9:3416.
Crossref
|
|
|
|
|
Ibrahim R (2011). A modified CTAB protocol for DNA extraction from young flower petals of some medicinal plant species. Geneconserve 10(40):165-182.
|
|
|
|
|
Kaur B, Chakraborty D (2013). Biotechnological and molecular approaches for vanillin production: a review. Applied Biochemistry and Biotechnology 169:1353-1372.
Crossref
|
|
|
|
|
Keshava C, Keshava N, Ong TM, Nath J (1998). Protective effect of vanillin on radiation-induced micronuclei and chromosomal aberrations in V79 cells. Mutation Research, Fundamental and Molecular Mechanisms of Mutagenesis 397(2):149-159.
Crossref
|
|
|
|
|
Kimura M, Crow JF (1964). The number of alleles that can be maintained in a finite population. Genetics 49:725-738.
|
|
|
|
|
Liu K, Muse S (2005). PowerMarker: an integrated analysis environment for genetic marker analysis. Bioinformatics 21(9):2128-2129.
Crossref
|
|
|
|
|
Li WG, Wang BR, Wang JB (2006). Lack of genetic variation of an invasive clonal plant Eichhornia crassipes in China as revealed by RAPD and ISSR markers. Aquatic Botany 84:176-180.
Crossref
|
|
|
|
|
Lubinsky P, Risterucci AM (2008). Patterns of introduction and diversification of Vanilla planifolia (Orchidaceae) in Reunion Island (Indian Ocean). American Journal of Botany 95:805-815.
Crossref
|
|
|
|
|
Mason AS, Zhang J, Tollenaere R, Teuber PV, Dalton-Morgan J, Hu L, Yan G, Edwards D, Redden R, Batley J (2015). High-throughput genotyping for species identification and diversity assessment in germplasm collections. Molecular Ecology Resources 15(5):1091-1101.
Crossref
|
|
|
|
|
Mayawa (2001). Kilimo Bora cha Vanilla Mkoani Kagera. 4th Edition. pp. 233-240.
|
|
|
|
|
Minoo D, Jayakumar V, Veena S, Vimala J, Basha A, Saji KV, Peter KV (2008). Genetic variations and interrelationships in Vanilla planifolia and few related species as expressed by RAPD polymorphism. Genetic Resources and Crop Evolution 55(3):459-470.
Crossref
|
|
|
|
|
Nei M (1973). Analysis of Gene Diversity in Subdivided Populations. PNAS pp. 3321-3323.
Crossref
|
|
|
|
|
Nybom H (2004). Comparison of different nuclear DNA markers for estimating intraspecific genetic diversity in plants. Molecular Ecology 13:1143-1155.
Crossref
|
|
|
|
|
Oyoo ME, Muhammed N, Githiri SM, Ojwang PO, Muniu FK, Masha E, Owuoche J (2015). Insitu morphological characterization of coconut in the coastal lowlands of Kenya. African Journal of Crop Science 9(2):65-74.
Crossref
|
|
|
|
|
Oyugi Z (2018). Vanilla Farming Profit Booster.
|
|
|
|
|
Purseglove JW, Brown CL, Robbins SRJ (1981). Spices. Longman, London pp. 644-735.
|
|
|
|
|
Rao RS, Ravishankar GA (2000). Vanilla flavour: production by conventional and biotechnological routes. Journal of the Science of Food and Agriculture 80(3):289-304.
Crossref
|
|
|
|
|
Shabbir B (2018). World Vanilla Production.
|
|
|
|
|
Sharp MD, Kocaoglu-Vurma NA, Langford V, Rodriguez-Saona LE, Harper JW (2012). Rapid discrimination and characterization of vanilla bean extracts by attenuated total reflection infrared spectroscopy and selected ion flow tube mass spectrometry. Food science 77:284-292.
Crossref
|
|
|
|
|
Sokal R, Michener C (1958). A statistical method for evaluating systematic relationships. University of Kansas Science Bulletin 38:1409-1438.
|
|
|
|
|
Soto MA (1996). A monograph of Vanilla (Orchidaceae). PhD Thesis, UNAM University, Mexico City P 110.
|
|
|
|
|
Sreedhar RV, Venkatachalam L, Roohie K, Bhagyalakshmi N (2007). Molecular analyses of Vanilla planifolia cultivated in India using RAPD and ISSR markers. Orchid Science and Biotechnology 1(1):29-33.
|
|
|
|
|
Stern WL, Judd WS (1999). Comparative vegetative anatomy and systematic of Vanilla. Botanical Journal of the Linnean Society 131(4):353.
Crossref
|
|
|
|
|
Verpoorte R, Korthou H (2007). Vanilla. In Berger R G, (Ed.) Flavours and Fragrances. Springer, Berlin pp. 203-217.
Crossref
|
|
|
|
|
Yeh FC (2000). Population genetics. In: Young A, Boshier D, Boyle T (eds) Forest conservation genetics, principles and practice. CABI Publishing, Wallingford pp. 21-37.
Crossref
|
|
|
|
|
Weir B (1996). Genetic Data Analysis II: Methods for Discrete Population Genetic Data. Sinauer Assoc., Inc.: Sunderland, MA, USA pp. 175-200.
|
|