Full Length Research Paper

ABSTRACT
Coconut is the most important cash crop along the Coast of Kenya, yet its genetic diversity has not been fully established. Genetic diversity study of 48 coconut genotypes, collected at the Coastal Kenya was conducted with 13 polymorphic short sequence repeats (SSRs) markers. SSR analysis was performed using GeneMapper while data analysis was done with PowerMarker and DARwin softwares. Analysis revealed a total of 68 alleles ranging from 2 to 11 per locus with a mean of 5.23 per marker. Gene diversity and polymorphic information content (PIC) ranged between 0.41 to 0.83 and 0.33 to 0.79, respectively. Neighbour - joining dendrogram grouped the genotypes into three major clusters with distinct sub-clusters. This study underscored that capillary electrophoresis is a more accurate and informative technique for SSRs allele scoring as opposed to agarose gels. The clusters observed forms the basis to isolate conservation blocks, which is key to establishing a genebank, since there is no documented coconut genebank for ex-situ conservation in Kenya.
Key words: Coconut genetic diversity, capillary electrophoresis, polymorphic information content.
INTRODUCTION
Coconut (Cocos nucifera L.), commonly known as the “tree of life” in the world (Huang et al., 2013; McKeon et al., 2016), is an export commodity for many countries, such as Indonesia (largest coconut-producing country, with 30% of the total world production (Burton, 2021)) and several other Southeast Asian countries (McKeon et al., 2016). Coconut (Cocos nucifera L.) is among the estimated 2600 living palm species (Christenhusz and Byng, 2016). Indonesia is the largest coconut-producing country, with 30% of the total world production (Burton, 2021).
It is also the main tropical cash crop and provides a source of income to the people of the coastal lowlands of Kenya (Wekesa et al., 2017). Coconut is proposed to have originated from south Asia and disseminated initially to the Pacific and East African shores, floating on sea waves and later to the Atlantic and American shores by humans after cultivation (Harries, 1978). Consequently, in most studies, African and South Pacific coconut germplasm are closely related to those in the South Asian subcontinent (Lebrun et al., 1998; Teulat et al., 2000; Perera et al., 2003). There are three varieties; tall (up to 60 feet), dwarf (up to 25 feet) coconut types as well as their intermediates, which are thought to be their hybrids (16 feet), at the coast of Kenya (Oyoo et al., 2015). Diversity is higher in tall varieties (out-crossing) than in the (in-breeding) dwarf varieties (Teulat et al., 2000; Meerow et al., 2003; Perera et al., 1999, 2000; Rivera et al., 1999). These varieties contribute significantly towards their social, economic and environmental wellbeing of the coastal people in the following counties where they are grown; Kwale, Kilifi, Mombasa, Tana River, Lamu and Taita Taveta. The coconut industry plays an important role in the protection of fragile environments such as small islands and coastal zones as well as providing a good tropical canopy for the tourism industry (Bourdeix and Prades, 2018).
Despite these diverse ecological services, the genetic diversity of coconut germplasm is under threat from climate change, pests and diseases, poor conservation strategies and urbanization, logging for timber and land fragmentation for housing, especially in coconut growing areas (Batugal et al., 2009; Martinez et al., 2009) to mention a few.
Assessment of the genetic diversity is an essential component of coconut genetic resource characterization, genetic improvement and adoption of conservation strategies (George and Angels, 2008). For coconut, germplasm from different geographical areas might look similar but may be genetically different. They might also show morphological differences but may be genetically the same. Molecular marker technologies reduce the inclusion of duplicates in breeding programmes and conservation blocks (Batugal et al., 2009). Once the genetic diversity has been assessed using reliable DNA markers such as short sequence repeats (SSRs), distinct coconut representatives can be identified, collected and conserved in genebanks. Coconut diversity hotspots can be documented with precision and the richness of the genepool can be determined and regeneration of conserved accessions can be enhanced (Rao, 2004; Yao et al., 2013).
Molecular marker technology is an ideal tool for assessing coconut genetic diversity within and between coconut populations (Batugal et al., 2009). Genomic markers such as Random Amplified Polymorphic DNA (RAPD) (Masumbuko et al., 2014), Restriction Fragment Length Polymorphism (RFLP) (Lebrun et al., 1998), Amplified Fragment Length Polymorphism (AFLP) (Perera et al., 2000; Teulat et al., 2000), Short Sequence Repeats (SSRs) or microsatellites (Amiteye, 2021; Dasanayaka et al., 2009; Martinez et al., 2009; Xiao et al., 2013; Wu et al., 2019) and inter-simple sequence repeats (ISSRs) (Manimekalai and Nagarajan, 2006)have been used to characterise coconut populations. Diversity in worldwide coconut germplasm show grouping patterns primarily according to dissemination routes from their source of origin (Rivera et al., 1999; Perera et al., 2003). SSRs have been shown to be the most efficient and valuable molecular marker technology for genetic diversity studies (Caro et al., 2022) and variety identification as are rich in polymorphism, high stability, and good repeatability (Dong et al., 2017).
Effective coconut genebanking strategies rely on analysis of genetic diversity at the DNA level in two ways: (1) to ensure that distinct coconut varieties from different geographical areas are represented in genebanks and (2) the DNA profiles serve as reference in regeneration of old coconut accessions for the maintenance of important agronomic traits (Rao and Tobby, 2002; Dasanayaka et al., 2009; Martial et al., 2013)
The binary scoring method based on the presence or absence of bands (Wang et al., 2009) was deployed in the previous study (Oyoo et al., 2016). The genetic diversity of the same set of coconut germplasm using 13 SSRs markers failed to provide accurate genetic distances of the germplasm. Presently, the famous method for gene detection and isolation is polyacrylamide gel electrophoresis (PAGE) or agarose gel electrophoresis. However, these cannot reveal the accurate size of amplified target DNA fragments and has low detection efficiency. Furthermore, it is difficult to effectively integrate and accurately compare DNA fingerprinting data from large?scale samples and different batches of samples. Capillary electrophoresis based on DNA band and accurately determine the size of detected fragments thereby identifying subtle length differences This study reported here employed the more informative and accurate capillary electrophoresis approach to resolve the multiple alleles that could be generated for a single marker across the 48 coconut genotypes and precisely sized them. In SSRs analyses, a missing amplification band does not indicate an absent SSRs allele. Furthermore, a visible band that appears in several different individuals are often several alleles with slightly different sizes (Mueller and Wolfenbarger, 1999). Some samples may present two different alleles for a single marker, indicating a heterozygous locus where the two diploid chromosomes each carry a different allele. Therefore, when SSRs markers are scored as presence or absence of alleles, such as when using agarose gels, their co-dominance and multi-allelic features are not considered, which can lead to misinterpretations (Jones et al., 1997; Wang et al., 2003).
The objective of this study was to assess the diversity of 48 coconut palms growing along the coast of Kenya using improved SSRs markers resolution by capillary electrophoresis.
MATERIALS AND METHODS
Area of study
The study was confined in the coastal region of Kenya which covers approximately 82,383 km2 with a population of 4,329,474 (KNBS, 2019). The coastal region is comprised of 6 counties namely: Lamu, Kwale, Kilifi, Tana River, Mombasa and Taita Taveta. These counties are known for their coconut diversity as reported in the previous study (Oyoo et al., 2015). The climate of this area is tropical humid with an annual mean rainfall of about 1200 mm mainly confined to the long rains between April to July and short rains between October and December (Mwachiro and Gakure, 2011).
Sampling
Coconut leaf samples were obtained from Kwale, Kilifi, Tana River and Lamu counties. A total of 48 individual coconut genotypes previously collected by Oyoo et al. (2015) comprising of 37 tall, 8 semi-tall (suspected hybrids) and 3 dwarf types. They were from different agro-ecological zones of the coastal lowlands of Kenya. Leaf samples were collected and coded according to Oyoo et al. (2015).
DNA extraction and evaluation
DNA was extracted from dry, frozen coconut leaves (preserved in silica gel at -20°C of the 48 varieties (tall, dwarf and hybrids) using a modified CTAB protocol described by Doyle and Doyle (1987). Two steel balls were placed in 2 mL labelled eppendorf tubes for each sample. Approximately 80 mg of dry leaves were weighed from each sample, cut into small pieces and ground into a fine powder to increase surface area for detergent activity, using a Tissue Lyser II (Qiagen®). This was followed by incubation with 800 µL of preheated CTAB extraction buffer (3% CTAB w/v, 100 mM Tris-HCI (pH 8.0), 1.4 M NaCl, 20 mM EDTA, 3% β-mercaptoethanol (BME), 2% Polyvinylpyrollidone (PVP)(w/v) in a water bath at 65°C for 30 min with occasional mixing. BME 3% was used in a replica experiment to determine if it reduced the degree of degradation. Solvent extraction was done by adding 800 µl of chloroform:isoamyl alcohol (24:1) followed by thorough mixing. They were then centrifuged for 10 min at 13000 rpm and approximately 500 µL of the supernatant was transferred into clean labelled tubes. The DNA was precipitated by addition of 350 µL of isopropanol (0.7 volume) stored at -20°C, left overnight to increase precipitation and then centrifuged for 20 min. The supernatant was decanted and the DNA pellet washed with 400 µL of 70% ethanol, air dried for 30 min and re-suspended in 200 µL of low salt TE buffer (10 mM Tris-HCl pH 8.0, 1 mM EDTA). RNase A (5 µL of 10 mg/mL) was added and the samples incubated at 37°C for 1 h to digest RNA. DNA was precipitated by the addition of 315 µL of ethanol sodium acetate (Ethanol: 3 M NaOAc 300 µL:15 µL) and incubated for 2 h at -20°C. The samples were then centrifuged at 14000 rpm for 25 min, the supernatant was decanted and the pellet was washed with 400 µL of 70% ethanol at 14000 rpm for 5 min. The DNA was air dried for 1 h in a laminar flow-hood, re-suspended in 50 µL low salt 1×TE and stored at -20°C.
Evaluation of quality and quantity of the genomic DNA
The quality of DNA was evaluated by electrophoresis using 0.8% (w/v) agarose gels stained with 5 μL/100 ml Gel Red® (Biotium Inc., USA) to enable visualization. A mixture of 4 μl of DNA and 2 μl of loading buffer (25 mg bromophenol blue (0.25%), 25 mg xylene xyanol (0.25%), 4 g sucrose (40%), was loaded onto the gel and run for 1 h at 80 volts in a 0.5 × TBE buffer (0.1 M Tris base, 0.1 M boric acid and 0.02 M EDTA; pH 8.0). The fragments were visualized under UV light and photographed using a transilluminator. The amount and purity of the DNA quantity was determined by spectrophotometry using a Nanodrop© 1000 (Thermo Scientific, USA) which was programmed to measure absorbance (A) from 220 to 350 nm and display the DNA concentration according to Wilfinger et al. (1997).
PCR amplification
PCR reactions were conducted in 10 µl final volume containing 1 × PCR buffer (20 mM Tris-HCl (pH 7.6); 100 mM KCl; 0.1 mM EDTA; 1 mM DTT; 0.5% (v/v) Triton X - 100; 50% (v/v) glycerol), 2 mM MgCl2, 0.16 mM dNTPs, 0.16 µM of a labelled M13-primer, 0.04 µM M13 - forward primer (InqabaBiotec, South Africa), 0.2 µM reverse primer (InqabaBiotec™), 0.2 units of Taq DNA polymerase (SibEnzyme Ltd, Russia), and 20 ng of template DNA as shown in Table 1
A total of 30 pairs of SSRs primers (Supplementary Table 1) developed by Perera et al. (2000) were used in this study. For detection of PCR fragments during capillary electrophoresis, each forward primer was labeled with one of the three 6-Carboxyfluorescein fluorescent dyes: 6-FAM®, 6-VIC ® or 6-PET® (Life Technologies Corporation, Carlsbad, USA). During capillary electrophoresis, the amplification products passed through a detection window and a light excited the fluorescent dye. The fluorescence was then visualized using a computer programme as relative fluorescent units (RFU) against fragment length in base pairs. An allele was scored for each data point as length in base pairs at the highest RFU peak.
Reactions were performed on a thermocycler (GeneAmp PCR system 9700®, Applied Biosystems, USA). Initially, the thermocycler was progammed with an initial denaturation of 94°C for 5 min, followed by 35 cycles of 95°C for 30 s, 57°C for 1 min, and elongation at 72ºC for 2 min. Final elongation was done at 72ºC for 20 min, and PCR products held at 15°C. Since the markers had a range of annealing temperatures from 56 to 46°C, this protocol did not work well for all primer sets and a gradient PCR protocol was introduced. The thermocycler was programmed with an initial denaturation of 94ºC for 3 min followed by 16 touch down cycles of 62ºC annealing for 15 s and 72ºC for 15 s in every cycle, with the annealing temperature decreased by 1ºC in each subsequent cycle, generating a range of annealing temperatures from 62 to 46ºC. This was followed by 21 cycles of 95ºC for 15 s, 58ºC for 15 s and 72ºC for 30 s. Final chain elongation was done at 72ºC for 7 min and reaction products held at 15ºC. To amplify markers that did not succeed with this protocol, the touch down cycles were increased from 10 to 15 cycles and the annealing time increased by 15 s. The protocol is summarised in Table 2 and was adopted after optimization of the annealing temperatures.

Success of PCR was determined by electrophoresis using a 2% (w/v) agarose gel stained with GelRed® (Biotium, USA) and visualized under UV light. For SSR fragment size analysis, 2.0 to 3.0 µl of 2 different markers amplification products were co-loaded along with the internal size standard, GeneScan™ –500 LIZ® (Applied Biosystems, USA) and Hi - Di™ Formamide (Applied Biosystems, USA). The DNA (PCR products) in this mixture was denatured for 3 min at 95ºC and chilled on ice for a few minutes.
The products were then separated by capillary electrophoresis using an ABI Prism® 3730 Genetic analyzer (Applied Biosystems, USA) (Koumi et al., 2004). This provided automated and accurate estimates of allele sizes, which is better than using traditional gels because of the differences that can occur in migration between lanes in a gel (Life Technologies Corporation user guide, Carlsbad USA).
Fragment analysis
Fragment analysis was performed using Gene Mapper 4.0 (Applied Biosystems, USA) and allelic data for every marker was further analyzed by PowerMarker V3.25 (Liu and Muse, 2005) and DARwinV.6 (Dissimilarity Analysis and Representation for Windows®) software (Perrier and Jacquemound-Collet, 2006). Analysis of the molecular variance (AMOVA) was performed using Arlequin V.3.5.2.2. PowerMarker was used to calculate diversity parameters including: Inbreeding co-efficient, gene diversity and polymorphic information content (PIC), allele number; estimation of allelic and genotypic frequency, Hardy-Weinberg disequilibrium and linkage disequilibrium. PIC, which is a measure of diversity, was calculated using the formula:

DARwin software was used to generate dendograms based on coconut evolutionary relationships using the dissimilarity matrix (Perrier and Jacquemound-Collet, 2006) as well as Principle Coordinate Analysis (PCoA) graphs.
RESULTS AND DISCUSSION
Genotyping the coconut genotypes using capillary electrophoresis
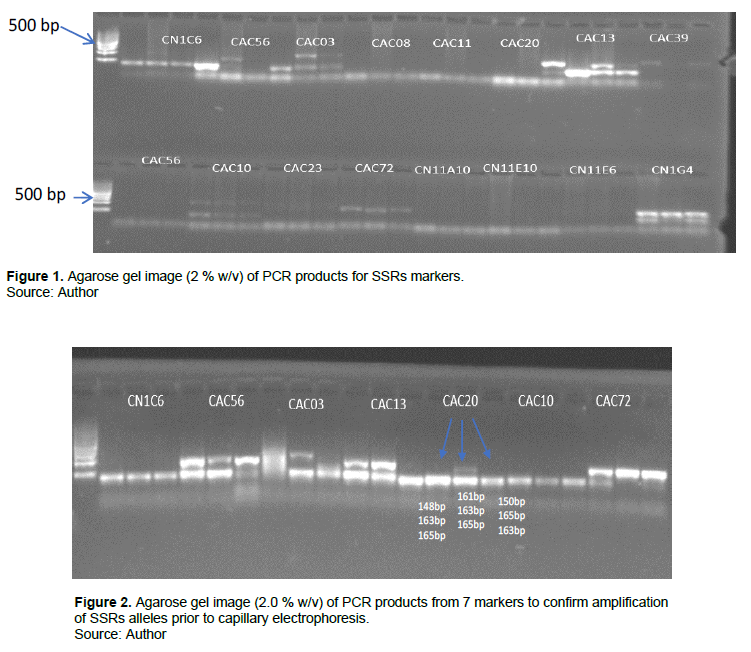
Some common markers as those of Oyoo et al. (2016) were used in the current study. The common markers used were CAC02, CAC03, CAC04, CAC06, CAC56, CAC72 and CN1C6, while CAC13, CAC20, CAC65, CN11E10, CN1G4, CN2A4 were specific to this study. Markers used by Oyoo et al. (2016) were CAC10, CAC21, CAC23, CAC71, CAC84, CN11E6 and CN1H2 (Table 3). In this study, 14 of the 30 markers failed to amplify DNA while three (3) were monomorphic, these were eliminated from the analysis. The markers that amplified well and produced bands across the 48 coconut genotypes are as follows: CN1C6, CAC56, CAC03, CA08, CAC11, CAC20, CAC13, CAC39, CAC10, CAC23, CAC72, CN11A10, CN11E10, CN11E6, and CN1G4 as shown in Figure 1. Seven markers visible bands though faint are as follow: CN1C6, CAC56, CAC03, CAC13, CAC20, CAC72 and CN1G4 produced as shown in Figure 1.
The 7 polymorphic markers used to amplify three random coconut DNA samples using 2% agarose gel electrophoresis as shown in Figure 2 using similar procedure as used by Oyoo et al. (2016). From this, it was not possible to tell by visual assessment alone whether the PCR products generated for each marker were similar or of different sizes. For example, for marker CAC20, the allele sizes indicated on the gel look the same (Figure 1), but capillary electrophoresis determined that they were actually different band scores; 161, 163 and 165 bp respectively. It should also be noted that CAC56, CAC03, CAC13, CAC20 and CAC72 displayed the co-dominance of SSRs markers, presenting two heterozygous alleles for some of the genotypes; this was not distinguishable in the previous work by Oyoo et al. (2016).
Oyoo et al. (2016) assessed markers on the basis of presence or absence of the expected band. In contrast, in the current study, differences in allele sizes amplified for a single marker for the 48 coconut DNA samples were precisely assessed with capillary electrophoresis. For example, for CAC56, six possible genotypes were distinguished. Furthermore, none of the 13 polymorphic markers used in this study presented any absent alleles. Such absent PCR products should be considered carefully as they could have occurred as a result of failed
PCR amplification or failure of primers to bind to the allele locus, and not necessarily due to an absent allele.
Genomic diversity studies
The allelic data for the 13 SSRs markers was analyzed by PowerMarker® version 3.25 and diversity summary statistics of each marker presented in Table 3.

Polymorphism of the SSRs and genetic diversity of cape goose berry accessions
An average of five genotypes was detected by each marker. Marker CAC72 was the most sensitive because it differentiated the coconut population into twelve genotypes while markers CAC03, CAC13 and CN11E01 were the least sensitive differentiating only two genotypes. Overall, six SSR markers were able to differentiate the population into more than five genotypes and were considered to be sensitive (Table 3). The other six SSRs differentiated the population into either two, three or four genotypes only and were considered to be less sensitive.
In this study, a total of 68 observed alleles were detected, ranging from 2 for markers CN11E10, CAC13 and CAC03 to 11 for marker CAC72 with a mean of 5.231 alleles per marker. The numbers of alleles reported in the study are comparatively higher than those reported by Oyoo et al. (2016) using agarose gel electrophoresis. This finding informs that capillary electrophoresis has a higher resolution of detecting different alleles at a given locus than gel electrophoresis.
The highest major allele frequency was 0.708 (CN11E10) and the least was 0.208 (CAC02) with a mean 0.472 (maximum possible value is 1). This means that, using capillary electrophoresis at any given locus the mean chance of any of the alleles being detected is about 0.5 showing that this method has higher resolution for band size separation and no bias towards dominant alleles (Njung’e et al., 2013). This finding is in contrast with results of Oyoo et al. (2016), who reported a higher major allele values with a mean of 0.807 showing that gel electrophoresis has a lower resolution for band size separation and higher bias (80%) for detecting the dominant allele. Polymorphic information content (PIC), a measure of how well the marker distinguished the samples tested, ranged from 0.33 for marker CAC03 to 0.80 for marker CNA4 with a mean of 0.59. This was in contrast to Oyoo et al. (2016) who reported who reported the highest PIC of 0.364 with a mean of 0.235. Six primers CNZA4 (0.8026), CAC02 (0.7904), CAC72 (0.7697), CAC04 (0.6228), CAC06 (0.6346), CAC20 (O.6763) and CAC65 (0.7134) showed higher PIC values. These primers should therefore be given priority in genotyping coconut because they have higher segregation capacity. The PIC values showed in this study were higher compared to Oyoo et al. (2016). This shows that capillary electrophoresis increases the efficacy of SSR markers and therefore increases their resolution for detecting diversity in coconut genotypes. This suggests that these markers are suitable for detecting the genetic diversity of coconut accessions from the Coast of Kenya.
Expected heterozygosity for the selected markers was generally low with a mean of 0.003 (minimum possible value is 0) indicating that the materials tested were genetically pure, that is, the loci were stable and not prone to high outcrossing frequencies. These markers were good for diversity studies especially in the tall coconut varieties, due to their outcrossing nature (Liu et al., 2011; Oyoo et al., 2016).
The study reaffirms that SSRs are powerful tools in genetic diversity studies and their usefulness could be enhanced if capillary electrophoresis was used than the standard procedure. In DNA markers diversity studies, allelic data analysis is the key towards attaining conclusive and reliable results (Vemireddy et al., 2007). The choice of allele sizing and separation platforms determines the accuracy in allele sizing, reproducibility and interpretation of the data obtained (Wang et al., 2009). A comparative analysis across 8 microsatellite loci in 12 rice varieties (Vemireddy et al., 2007) demonstrated that capillary electrophoresis is the most accurate and preferred method for allele size estimation, with errors of less than 0.73 bp compared to slab gels such as polyacrylamide, which produce error rates of up to 1.59 bp and agarose gels, which give error rates of up to 8.03 bp. Capillary electrophoresis has also been proven to have greater reproducibility (3 bp). Oyoo et al. (2016) who used 2% (w/v) agarose gels could not separate accurately alleles with size differences of as little as 2 bp where the average allele length is 150 to 500 bp long. Such alleles will migrate the same distance in an agarose gel and will therefore be assumed to be of the same size leading to limited interpretation. SSRs results should not be scored as present or absent as they are co-dominant markers and missing alleles can be as a result of low quality DNA or due to a marker that could not bind specifically to the allele locus. In this study, capillary electrophoresis was used to separate alleles and hence added value to the previous study by Oyoo et al. (2016).
Population structure of coconuts along the coast of Kenya
Genetic distances of coconut genotypes among counties
The results of partitioning of genetic variance within and among coconut populations sampled are presented in Table 4. The AMOVA was performed using Arlequin software. Samples obtained from four counties; were considered as constituting 4 different populations.

Results of the study showed a significant negative variation -1.59% (p = 0.001), in coconut genotypes in different counties indicating lack of population structuring according to county of collection. While the population molecular variance value reported in this study was lower than that reported by Oyoo et al. (2016) (2%) who used the same markers and gel electrophoresis detection platform, both studies reported lack of population differentiation. The lack of population differentiation may be attributed to a number of factors; the nature of markers used may lack enough resolution to group the genotypes according to the county of collection (Excoffier et al., 2005). There are chances that similar genotypes were sampled between counties or there is exchange of germplasm by farmers between counties. The negative variance can also be attributed to the highly outcrossing nature of coconut (Gunn et al., 2011) resulting in exchange of genes between populations/counties and reducing inter-population diversity compared to within same population (Excoffier et al., 2005).
Overall, no geographical divergence was observed in coconuts evaluated in the study across the selected counties. This result shows that coconut populations in the select counties at the Kenyan coast are similar.
Genetic variations among coconut genotypes within counties
The majority of the variation displayed in the within populations rather than among populations. The percentile variation among individuals within counties was not statistically significant 101.10 (p = 0.999) indicating that the differences observed in the coconuts within counties could be due to the fact that outcrossing species had less genetic differentiation among their populations (Table 4). The percentage variation within individuals in the same county was significant 0.4927 (p = 0.001) indicating existence of different distinct genotypes in the counties (Table 4). The molecular individual variance was significantly higher than the population variance due to breeding system and seed dispersal mechanism. Life form and breeding system had been reported to have had highly significant influences on genetic diversity and its distribution in woody plants (Hamrick and Godt, 1996)
he genetic differentiation among regions was not significant. This finding is as expected for long-lived, woody plants which inherently display greater variations within populations (Hamrick et al., 1992). Additional studies revealed that low amount of the variation in genetic structure among species can be explained by life history traits alone. Thus, in this study, the high genetic homogeneity and intra-population variability recorded across populations could have resulted from high levels of gene flow, and long-life history of coconut plants as earlier suggested. The coconut from different counties may also have not been geographically separated for an evolutionary significant time to accumulate detectable genetic variation. This also explains the PCA cluster analysis in this work.
Overall, the coconut genotypes within the selected Kenyan coastal counties are genetically diverse. It can therefore be inferred that diversity of the coconut in the select counties is as a result of genetics and not geography.
Factorial analysis
Factorial analysis was performed to evaluate the genetic relationship of the genotypes within and between the counties. The scatter plot was derived from the dissimilarity matrix calculated using raw binary data using Darwin 6.0.21 software. Factorial analysis failed to group the genotypes into any discernible pattern either based on county of collection or genetic makeup (Figure 3), hence dispersal.
This implied that these coastal counties were not specialized habitats for the coconut found at the coastal Kenya. This observation further confirms the genetic relationships of coconut in the area of study in as much as capillarity electrophoresis was able to detect more DNA bands. Cluster analysis failed to group samples as per their origin; the SSR studies of Perera et al. (2000) and Teulat et al. (2000), and the RFLP of Lebrun et al. (1998), both of which were heavily sampled African and south Asian genotypes, support this dispersal theory.
This could be due to farmers to farmer exchange of planting material, accidental material movements within the counties or ocean currents, inbreeding and outbreeding the life form of coconut.

Phylogenetic analysis
Relationship of the genotypes was presented in a Neighbor Joining dendrogram derived in Darwin 6.0 based on Sokal - Michener modalities after one thousand bootstraps (Figure 4). Phylogenetic analysis grouped the genotypes into three main clusters and eleven sub clusters randomly without any specific pattern. Analysis of markers did not segregate the genotypes based on either genetic makeup or county of collection. This observation further highlights the inefficiency of the markers used in detecting diversity within the coconut genotypes in the four select counties (Kwale, Lamu, Kilifi and Tana River) of the Kenyan coast (Figure 4). The lack of population partitioning is common in free mating populations where alleles are freely shared within and between populations. This postulation is further confirmed by the low expected heterozygosity values reported in the study (Table 3). The lack of population differentiation can also be attributed to high cultivation and domestication coconut leading farmers transferring germplasm within and across the counties.
The lack of genotype structuring may be due to genetic closeness of the coconut genotypes and or low resolution of the markers used in the study. This finding is similar to results of Oyoo et al. (2016) who also failed to achieve segregation of the genotypes using the same markers.

CONCLUSION AND RECOMMENDATIONS
This study demonstrates an improved allele scoring technique to that of the study of Oyoo et al. (2016) with similar SSRs markers as shown with marker efficacy indices, genetic diversity indices and AMOVA as capillarity electrophoresis revealed more variation. This new information was used to enhance the existing description of the diversity of these genotypes and guide establishment of a coconut genebank for ex-situ conservation.
This study revealed the power of capillary electrophoresis in gene diversity studies in coconut as more variation was detected in this work than reported by Oyoo et al. (2016). Coconut germplasm however failed to cluster according to the county of collection and coconut type indicating low resolution of the SSR markers and genetic redundancy in Coastal Lowlands of Kenya even with the use of this novel technique. To expand coconut genetic base in Kenya, there is need to introduce germplasm and initiate a deliberate breeding programs that involve making controlled crosses. DNA based genetic characterization will also help avoid duplications in conservation blocks and breeding programs, maximising the use of genetic diversity between coconut populations to breed superior varieties and to identify coconut populations with narrow genetic bases and adoption of appropriate conservation strategies (Martial et al., 2013; Rao and Tobby, 2002).
The study also highlighted on the need to apply platforms with higher resolving power such as genotyping by sequencing (GBS) and genome wide sequencing (GWAS) in coconut diversity studies to expand coconut genetic base in Kenya, through introductions and controlled crosses of elite parents.
CONFLICT OF INTERESTS
The authors have not declared any conflict of interests.
ACKNOWLEDGEMENT
National Commission for Science, Technology and Innovation (NACOSTI) and Kenya Coastal Development Project (KCDP) for financial support and the International Crops Research Institute for the Semi-Arid Tropics (ICRISAT) for technical facilities and support.
REFERENCES
|
Amiteye S (2021). Basic concepts and methodologies of DNA marker systems in plant molecular breeding. Heliyon 7(10):e08093. |
|
|
Batugal P, Bourdeix R, Baudouin L (2009). Coconut breeding. In: Priyadarshan. (P.M., Ed.) Breeding Plantation Tree Crops: Tropical Species pp. 327-376. |
|
|
Bourdeix R, Prades A (2018). A Global Strategy for the Conservation and Use of Coconut Genetic Resources, 2018-2028. Bioversity International ISBN 13:978-92-9043-984-4 |
|
|
Burton J (2021). The world leaders in coconut production (2021). Access on: Jan. 30, 2022. Available at: |
|
|
Caro RES, Cagayan J, Gardoce RR, Manohar A (2022). Mining and validation of novel simple sequence repeat (SSR) markers derived from coconut (Cocos nucifera L.) genome assembly. Journal of Genetic Engineering and Biotechnology 20(1):1-14. |
|
|
Christenhusz MJM, Byng JW (2016). The number of known plants species in the world and its annual increase. Phytotaxa 261(3):201-217. |
|
|
Dasanayaka PN, Evarad JM, Karunayaka EH, Nandadasa HG (2009). Analysis of coconut (Cocos nucifera L) diversity using microsatellite markers with emphasis on management and utilization of genetic resources. Journal of the National Science Foundation of Sri Lanka 37(2):99-109. |
|
|
Dong H, Zhang LJ, Zhang MY, Jiang N, Yu HL, Song CY, Tan Q (2017). Genetic diversity and fingerprint profiles of Chinese major Lentinulaedodes cultivars based on SSR markers. Microbiology China 44(6):1427-1436. |
|
|
George ML, Angels J (2008). Global coconut genetic resources conservation strategies and priority activities for 2005-2015, Malaysia. Retrieved from |
|
|
Harries HC (1978). The evolution, dissemination and classification of Cocos nucifera L. The botanical Review 44(3):265-319. |
|
|
Hamrick JL, Godt MJW (1996). Effects of life history traits on genetic diversity in plant species. Philosophical Transactions of the Royal Society of London. Series B: Biological Sciences 35(1345):1291-1298. |
|
|
Hamrick JL, Godt MJV, Sherman-Broyles SL (1992). Factors influencing levels of genetic diversity in woody plant species. New Forests 6(1-4):95-124 |
|
|
Huang YY, Matzke AJM, Matzke M (2013). Complete sequence and comparative analysis of the chloroplast genome of coconut palm (Cocos nucifera). PLoS ONE 8(8):e74736. |
|
|
Jones CJ, Edwards KJ, Castaglione S, Winfield MO, Sala F, Van de Wiel C, Karp A (1997). Reproducibility testing of RAPD, AFLP and SSRs markers in plants by a network of European laboratories. Molecular Breeding 3(5):381-390. |
|
|
Kenya National Bureau of Statistics (KNBS) (2019). 2019 Kenya Population and Housing Census. Volume III: Distribution of Population by Age and Sex. P 12. December 2019. Accessed from: |
|
|
Koumi P, Green HE, Hartley S, Jordan D, Lahec S, Livett RJ,Ward DM (2004). Evaluation and validation of the ABI 3700, ABI 3100, and the MegaBACE 1000 capillary array electrophoresis instruments for use with short tandem repeat microsatellite typing in a forensic environment. Electrophoresis 25(14):2227-2241. |
|
|
Lebrun P, N'cho YP, Seguin M, Grivet L, Baudouin L (1998). Genetic diversity in coconut (Cocos nucifera L.) revealed by restriction fragment length polymorphism (RFLP) markers. Euphytica 101(1):103-108. |
|
|
Liu K, Muse SV (2005). PowerMarker: an integrated analysis environment for genetic marker analysis. Bioinformatics 21(9):2128-2129. |
|
|
Manimekalai R, Nagarajan P (2006). Assessing genetic relationships among coconut (Cocos nucifera L.) accessions using inter simple sequence repeat markers. Scientia Horticulturae 108(1):49-54. |
|
|
Martial YS, Louis KK, N'Da Desire PO, Noel KK, Emmanuel IA, Sylvere SR, Arsene ZB (2013). Assessment of the genetic diversity conservation of three tall coconut (Cocos nucifera L) regenerated by controlled pollination using microsattelite markers. African Journal of Biotechnology 12(20):2808-2815. |
|
|
Martinez RT, Baudouin L, Berger A, Dollet M (2009). Characterisation of the genetic diversity of the tall coconut (Cocos nucifera L) using microsatellitemarkers. Tree Genetics and Genomes 6(1):73-81. |
|
|
Masumbuko L, Sinje S, Kulaya A (2014). Genetic diversity and structure of East African tall coconuts in Tanzania using RAPD markers. Open Journal of Genetics 4:175-181. |
|
|
Mckeon TA, Hayes DG, Hildebrand DF, Weselake RJ (2016). Industrial oil crops. Elsevier ISBN-13:978-1893997981 |
|
|
Meerow AW, Wisser RJ, Brown SJ, Kuhn DN, Schnell RJ, Broschat TK (2003). Analysis of genetic diversity and population structure within Florida coconut (Cocos nucifera L.) germplasm using microsatellite DNA, with special emphasis on the Fiji Dwarf cultivar. Theoretical and Applied Genetics 106(4):715-726. |
|
|
Mueller UG, Wolfenbarger LLR (1999). AFLP genotyping and fingerprinting. Trends in Ecology and Evolution 14(10):389-394. |
|
|
Mwachiro EC, Gakure RW (2011). Factors affecting the coconut industry from benefitting the indigenous communities of Kilifi district, Kenya. I International Journal of Humanities and Social Science 1(4):1-17. |
|
|
Oyoo ME, Muhammed N, Githiri SM, Ojwang PO, Muniu FK, Masha E, Owuoche J (2015). In-situ morphological characterization of coconut in the coastal lowlands of Kenya. African Journal of Crop Science 9(2):65-74. |
|
|
Oyoo ME, Muhammed N, Cyrus KN, Githiri SM (2016). Assessment of the genetic diversity of Kenyan coconut germplasm using simple sequence repeat (SSR) markers. African Journal of Biotechnology 15(40):2215-2223. |
|
|
Perera L, Russell JR, Provan J, Powell W (2003). Studying genetic relationships among coconut varieties/populations using microsatellite markers. Euphytica 132(1):121-128. |
|
|
Perera L, Russell JRR, Provan J, Powell W (2000). Use of microsatellite DNA markers to investigate the level of genetic diversity and population genetic structure of coconut (Cocos nucifera L.). Genome 43(1)15-21. |
|
|
Perera L, Russell JR, Provan J, Powell W (1999) Identification and characterization of microsatellite loci in coconut (Cocos nucifera L.) and the analysis of coconut populations in Sri Lanka. Molecular Ecology 8(2):344-346. |
|
|
Perrier X, Jacquemoud-Collet JP (2006). DARwin software. http://darwin.cirad.fr/darwin |
|
|
Rao NK (2004). Plant genetic resources: Advancing conservation and use through Biotechnology. African Journal of Biotechnology 3(2):136-145. |
|
|
Rao VR, Tobby A (2002). Genetic diversity, conservation and utilization of plant genetic resources. Plant Cell, Tissue and Organ Culture 68(1):1-19. |
|
|
Rivera R, Edwards KJ, Barker JHA, Arnold GM, Ayad G, Hodgkin T, Karp A (1999). Isolation and characterization of polymorphic microsatellites in Cocos nucifera L. Genome 42(4):668-675. |
|
|
Teulat B, Aldam C, Trehin R, Lebrun P, Barker JH, Arnold GM, Rognon F (2000). An analysis of genetic diversity in coconut (Cocos nucifera L) populations from across the geographic range using sequence-tagged microsatellites (SSRs) and AFLPs. Theoretical and Applied Genetics 100(5):764-771. |
|
|
Vemireddy LR, Archak S, Nagaraju J (2007). Capillary electrophoresis is essential for microsatellite marker based detection and quantification of adulteration of Basmati rice (Oryza sativa). Journal of Agricultural and Food Chemistry 55(20):8112-8117. |
|
|
Wang D, Shi J, Carlson SR, Cregan PB, Ward RW, Diers BW (2003). A Low-Cost, High-Throughput Polyacrylamide Gel Electrophoresis System for Genotyping with Microsatellite DNA Markers. Crop science 43(5):1828-1832. |
|
|
Wang X, Rinehart T, Wadl P, et al (2009). A new electrophoresis technique to separate microsatellite alleles. African Journal of Biotechnology 8(11):2432-2436. |
|
|
Wekesa C, Ongugo P, Ndalilo L, Amur A, Mwalewa S, Swiderska K (2017). Smallholder farming systems in coastal Kenya: key trends and innovations for resilience IIED Country Report. IIED, London. International Institute for Environment and Development. |
|
|
Wu Y, Yaodong Y, Qadri R, Iqbal A, Li J, Fan H, Wu Y (2019). Development of SSR markers for coconut (Cocos nucifera L.) by selectively amplified microsatellite (SAM) and its applications. Tropical Plant Biology 12(1):32-43. |
|
|
Xiao Y, Luo Y, Yang Y, Fan H, Xia W, Mason S, Qiao F (2013). Development of microsatellite markers in Cocos nucifera and their application in evaluating the level of genetic diversity of Cocos nucifera. Plant Omics Journal 6(3):193-200. |
|
|
Yao SD, Konan JL, Pokou ND, Sie RS, Koumane JN, Issali AE, Zoro BI (2013). Assessment of the genetic diversity conservation in three tall coconut accessions regenerated by controlled pollination using microsatellite markers. African Journal of Biotechnology 12(20):2808-2815. |
|
Copyright © 2024 Author(s) retain the copyright of this article.
This article is published under the terms of the Creative Commons Attribution License 4.0


