ABSTRACT
Pineapple [Ananas comosus (L.) Merr.] is an important fruit crop cultivated in Tanzania. However, the knowledge on genetic diversity of the pineapple cultivars grown in Tanzania is limited. This study was aimed at determining the genetic diversity and identity of pineapple cultivars from different growing regions in Tanzania using microsatellite markers also known as simple sequence repeat marker (SSR). Ten of the 18 microsatellite markers were polymorphic and generated a total of 22 distinct reproducible bands with an average of 2.2 bands per primer pair. The number of polymorphic bands detected with each primer pair ranged from 1 to 3 with an average of 1.5 per primer pair. The polymorphic information content (PIC) values of each primer pair ranged from 0.17 to 0.79 with an average of 0.41. Two microsatellite loci TsuAC010 and TsuAC039 revealed PIC values higher than 0.50 thus suggesting that such primers have high discriminatory ability. The consensus tree derived from the unweighted pair-group method with arithmetic means (UPGMA) revealed four different groups. Kinole-SCT sub-population formed a distinct group from Madeke-SCT and MD2 hybrid cultivar. Kinole-SC, Mukuranga-SC, and Kiwangwa-SCcultivars were closely related on the cluster analysis. This study demonstrated the existence of low genetic diversity in pineapples cultivated in Tanzania implying that a well-thought-out breeding strategies should be employed for genetic improvements of pineapple. Introduction of exotic clones and employment of modern breeding strategies such as marker assisted selection (MAS) and genetic engineering technologies is recommended. This will widen the current genetic pool of pineapple in Tanzania.
Key words: Pineapple [Ananascomosus (L.) Merr.], microsatellite markers, genetic diversity, unweighted pair-group method with arithmetic means (UPGMA), polymorphic information content (PIC).
Pineapple [Ananas comosus (L.)Merr.] is a perennial herbaceous fruit crop belonging to the family Bromeliaceae. It is cultivated in tropical and subtropical regions and ranks third in production among non-citrus tropical fruits, after banana and mango (Coveca, 2002). The annual worldwide production of pineapples reached 24.8 million metric tons in 2013 and the top seven producers (Costa Rica, Brazil, Philippines, Thailand, Indonesia, India, Nigeria, China, Mexico and Colombia) jointly accounted for 90% of the global production (FAO, 2018).
The three most economically important traditional pineapple cultivars in the world are Cayenne, Singapore Spanish, and Queen (d’Eeckenbrugge et al., 1997). Smooth Cayenne is the most important and popular cultivar mainly due to its high yield potential and favorable characteristics as a fresh fruit and for processing and hence preferred for pineapple breeding (
Leal and d’Eeckenbrugge, 1996).
Pineapple production in Tanzania is expanding rapidly with increasing tendency toward commercial cultivations through expansion of existing farms and opening new farms. This trend has been caused by increased demand of pineapple in local and internal market particularly in the Middle East. In Tanzania, pineapple production range from 0.4047 to 8.094 ha with yield estimates of 23.37MT/ha in year 2014 (FAOSTAT, 2016). The production is mainly contributed by small holder farmers and few medium scale farmers. Although the larger percent of pineapple produced is consumed locally, few farmers export fresh fruits to markets in Europe and Middle East. However, both local and international markets were faced with several challenges that include short shelf life of the produce, changing consumer preferences, poor branding, packaging and other marketing constraints. Furthermore, farmers, consumers and marketing agents in Tanzania do not know the characteristics of pineapples that are grown in the country. Consequently, the fruits produced has low market value and do not meet the requirements of both local and international markets. In addition, homonyms and synonyms are common among the names of pineapple cultivars and that confuses farmers and restricts the sharing of accurate information and materials among pineapple researchers. Lack of such information on the pineapple identities hamper the use of genetic resources in breeding of pineapple in Tanzania and other major growing areas of the world (Hidayatet al., 2012; Sripaoraya et al., 2001; Zhang et al., 2014).
The current government policy of industrialization is centered around increased production and processing of agricultural goods such as pineapples. To realize this goal, the agricultural sector should focus on improving the production and dissemination of high quality and market/industry preferred pineapple cultivars. Given this challenge, it is important to genetically characterize the locally adapted smooth cayenne cultivars to ascertain their diversity and identities.
Several DNA profiling techniques have been used for cultivar identification and evaluation of genetic diversity in pineapples (Ahmed and Abdel, 2012; Burhooa and Ranghoo-Sanmukhiya, 2012). Among the available molecular markers, microsatellite markers have been widely used for genetic analysis and cultivar identification due to its high polymorphism, abundance, co-dominance inheritance and reproducibility. The technique is simple to assay by Polymerase Chain Reaction (PCR) and gel profiling (Xie et al., 2011). The application of microsatellite markers for plant cultivar characterization have been reported in several crops including grape (Dallakyan et al., 2013), potato (Salimi et al., 2016), rice (
Miah et al., 2013), almond (
Sorkheh et al., 2017; Zhang et al., 2017), apple (Van Treuren et al., 2010) and wheat (Han et al., 2015; Kroupin et al., 2013). However, DNA profiling in pineapple by microsatellite markers has been rarely studied (Shoda et al., 2012; Alfonso et al., 2013).
The objective of this work was to determine the genetic diversity and identity of pineapple cultivars in Tanzania. This study would contribute to enhancing our knowledge and understanding on the genetic relationship between different cultivars and provide basic information for improving parental selection and other pineapple breeding activities.
Plant materials
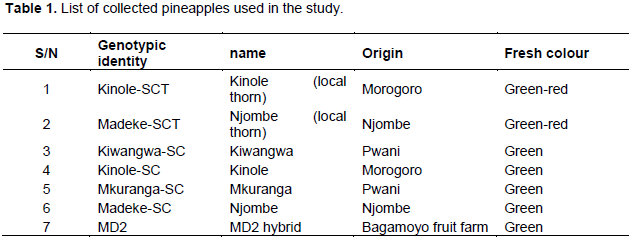
Pineapple germplasm were collected from Kinole in Morogoro, Kiwangwa and Mkuranga in Coast and Madeke in Njombe. These sites represent the major pineapple growing areas in Tanzania. The collected materials (Table 1) were grown and maintained at Chambezi sub-station of Mikocheni Agricultural Research Institute (MARI).
Genomic DNA extraction
Pineapple leaves (10 mm in diameter) were picked and packed in envelopes, labeled and shipped to MARI molecular laboratory for DNA extraction. Pineapple genomic DNA extraction was performed using cetyltrimethyl ammonium bromide (CTAB) method (Charlotte et al., 2016). About 2.5 g of fresh pineapple leaves from each sub-population were pre-chilled in liquid nitrogen, and then crushed using a mortar and pestle to a fine powder before transferring into 1.5 ml of Eppendorf tubes. Then 700 µl of the pre-warmed extraction buffer (2% CTAB) mixed with 10% β-mercapto-ethanol were added and mixed by vortex. The Eppendorf tubes containing the samples were then incubated at 60°C for 30 min on floater in water bath. Equal volume (700 µl) of phenol: chloroform: isoamyl (25:24:1) were added, mixed by inverting the tubes for 10 min and centrifuged for 10 min at 12000 rpm. Approximately, 500 µl supernatant was transferred into the clean 1.5 ml Eppendorf tubes and 300 µl of cold isopropanol were added. The tubes were incubated at 20°C for 2 h to precipitate the DNA and later centrifuged for 10 min at 12000 rpm to precipitate the DNA. The supernatant was discarded and the pellet washed with 400 µl of 70% ethanol and later air dried at room temperature to complete dryness. The pellets were resuspended in 50 µl of sterile double distilled water and stored in refrigerator at 4°C until needed for PCR.
Determination of pineapple genomic DNA quality
The quality of the genomic DNA was determined by resolving the samples on a 0.8 % (w/v) agarose gel in Tris-acetate EDTA (X1 TAE) (40 mMTris-HCl and one mM EDTA at pH 8.2 adjusted with acetic acid) buffer stained with gel red then ran at 100 V for 40 min. The gel was visualized under UV light and documented using BioDoc-It Tm Imaging System (Upland, CA, USA).
Determination of pineapple genomic DNA quantity
The DNA concentration of each of the sample was determined using a Cecil CE3021 spectrophotometer (Cecil Instruments, Cambridge, UK). A concentration of each sample was standardized to 25 ng/µl (working concentration) by diluting with RNase-free water. The purity check of the DNA was estimated at A260/A280 ratio with the reading between 1.6 and 2.0 considered to be of acceptable quality for further processing.
PCR amplification for detection of SSR markers
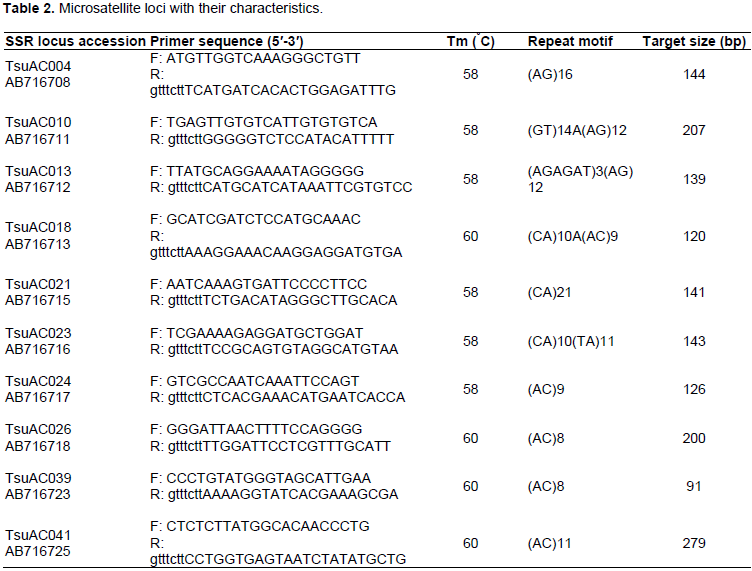
Eighteen SSR primers were used for the genetic characterization of the pineapple cultivars. These markers were selected because they revealed great polymorphism in Japanese pineapple genetic diversity study by Shoda et al. (2012). The SSR primer characteristics are depicted in Table 2. Primers were synthesized by Inqaba Biotech East Africa Ltd (Pretoria, South Africa). SSR polymerase chain reaction (PCR) amplification was performed in a 20 μl reaction mixture containing AccuPower® PCR Pre Mix including 1 U Top DNA polymerase, 250 μM dNTP, 10 mM Tris-HCl (pH 9.0), 1.5 mM MgCl2, Stabilizer and tracking dye (Bioneer Corparation, Daejeon, Republic of Korea), 16 μl RNase-free water, 1.0 μl each of forward and reverse primers and 2.0 μl of 25 ng genomic DNA. DNA was amplified using the following PCR program: 94°C for 2 min initial denaturation and a final denaturation 94°C for 30 s, annealing temperature of 58 to 60°C (Table 2) for 30 s each for 35 cycles and extension at 72°C for 2 min and a final extension at 72°C for 7 min. All PCR reactions were carried out on a Gene Amp PCR System 9700 thermal cycler (Applied Biosystems, Foster City, CA. USA). PCR products were separated on 2% agarose gels (stained with gel red) at 75 V for 45 min and viewed under UV light and gel documented using BioDoc-It Tm Imaging System (Upland, CA, USA).

Data management and analysis
The amplified bands were scored for each SSR marker based on the presence or absence of bands, generating a binary data matrix of 1 and 0 for each marker system. Jaccard’s similarity coefficient values were calculated and phylogeny based on similarity coefficient values supported with bootstrap were generated using unweighted pair-group method with arithmetic means (UPGMA) using PAST (Past 3.14 version) software. The bootstrap values above 50% were considered of significant. The polymorphism information content (PIC) value for each SSR markers was calculated using the formula by Peakall and Smouse (2012).
Where, k is the total number of alleles (bands) detected for one SSR locus and P is the proportion of the cultivars or genotypes containing the allele (band) in all the samples analyzed and Pi is the frequency of the ith allele in the examined test genotypes.
Polymorphic information analysis of SSR primer pairs
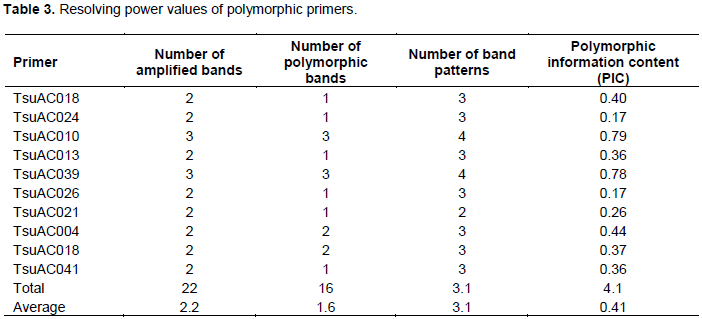
Among 18 primers screened, 10 were found to be polymorphic and thus chosen for diversity study and genotype identification. Banding patterns were observed to range from 2 to 4 with an average of 3.1 generated by primer pairs (primer pair TsuAC026 and TsuAC024, and primer pair TsuAC039). The ten chosen primers generated a total of 22 unambiguous bands with an average of 2.2 bands per primer pairs (Table 3). The number of polymorphic bands detected with each primer pair ranged from 1 to 3 with an average of 1.6 (Table 3). The polymorphic information content of each SSR marker ranged from 0.17 to 0.79 with an average of 0.41 (Table 3). Markers TsuAC024 and TsuAC026 had the lowest values while marker TsuAC010 and TsuAC039 had the highest value (Table 3).
Unweighted pair group with arithmetic means cluster of the seven pineapple cultivars
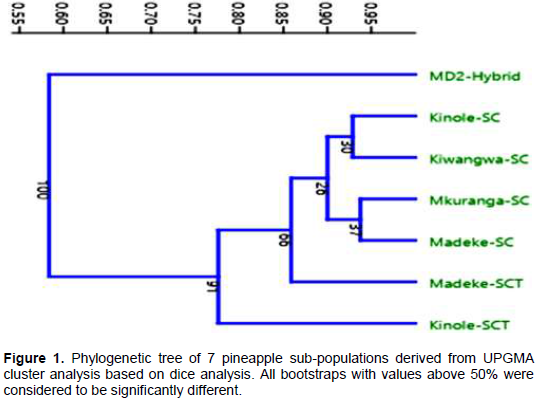
The UPGMA clustered the 7 pineapple sub-populations into four major groups with genetic similarity coefficient value ranging from 0.4 to 1 (Figure 1). The phylogenictree revealed pineapples sub-populations Kinole-SCT, Madeke-SCT and MD2 hybrid were significantly different based on bootstrap and similarity coefficient scale (Figure 1). The first cluster contained MD2 hybrid, the second cluster was Madeke-SCT, the third cluster was made of Kinole-SCT whereas Mkuranga-SC, Madeke-SC, Kiwangwa-SC and Kinole-SC clustered together forming the fourth cluster (Figure 1).
Understanding genetic diversity of Tanzanian pineapples is important as it is the first step in harnessing characteristics for cultivar identification at farmer, processor, market and consumer levels as well as their genetic variability for their improvement. This work represents the first study of basic genetic diversity and identity of seven pineapple sub-populations (collections) commonly grown in Tanzania and one imported hybrid pineapple using microsatellite markers. The genetic diversity were measured in terms of polymorphic information content (PIC), total number of amplified bands, number of alleles per locus and number of band patterns. PIC is a measure of the level of polymorphism or diversity in a given population. PIC value is always less than one, and the population with the PIC value of 0.5 to 0.9 are considered to be more diverse. On the other hand, the PIC value less than 0.5 is considered to be of narrow genetic diversity. Of the ten microsatellite markers used in this study, TcuAC010 and TsuAC039 revealed PIC values higher than 0.5, implying that such markers are more powerful to detect the diversity in pineapple populations. Similarly while working on pineapple accessions in Japan using the same markers, Shoda et al. (2012) reported a distinct diversity among the pineapples. The observed polymorphism in the studied pineapple populations suggest that such microsatellite markers could be readily used for genotype identification and genetic diversity studies of pineapple. In the studied pineapple sub populations, the microsatellite markers readily clustered the subpopulation into four distinct groups as revealed by the phylogenetic tree. These findings suggest that there might be more than three groups of smooth cayenne grown in Tanzania.
The MD2 was clearly identified by primer pairs TsuACO10, TsuAC024 and TsuAC26 at the band allele size of 200 bp. The sub-populations Kinole-SC, Kiwangwa-SC, Mkuranga-SC and Madeke-SC clustered together, indicating that these sub-populations were essentially the same but with different names. On the other hand, Madeke-SCT and Kinole_SCT formed its own distinct groups suggesting that the two sub-populations evolved differently. The variations in the pineapple populations detected by the microsatellite markers in this study are complemented by the findings reported by Alfonso et al. (2013) while studying the diversity of pineapple cultivars using SSR markers.
Similar results were also reported using microsatellite markers (Feng et al., 2013). Such variations may result from the combination of self-incompatibility, high levels of somatic mutation, and intraspecific hybridization in pineapple as noted by Kato et al. (2004). The distribution of pineapple cultivars observed in the phylogenetic tree is coherent and clearly shows that the microsatellite markers and the analytical methods used in this study are powerful tools for studying the genetic identity of pineapple.
Microsatellite markers were successfully used to effectively characterize the selected pineapple sub-populations. The study also revealed that the markers can effectively discriminate the different sub-populations. It is therefore important to incorporate microsatellite marker analysis in the selection of genetically distinct sub-populations to identify lineage in pineapple genetic resources conserved. Narrow genetic base of pineapples revealed under this study suggests that a well thought-out breeding program for pineapple improvement is urgently needed. The identified microsatellite markers will reduce the stress of applying many microsatellite markers for the identification of pineapple cultivars in Tanzania (and elsewhere) and hence, saves time and also cuts the cost of research studies for genetic diversity. These findings suggest that further studies should be carried out in identified groups of pineapple for their respective phenotypic characteristics, sensory evaluation and acceptability test for industrial growth and market promotion.
The authors have not declared any conflict of interests.
REFERENCES
|
Ahmed L, Abdel-M (2012). DNA Based Techniques for Studying Genetic Diversity. In: Genetic Diversity in Microorganisms, Prof. Mahmut Caliskan (Ed.), ISBN: 978-953-51-0064-5, In Tech, Available from:
View.
|
|
|
|
Alfonso DR, Grajal-Martin MJ, Isidron M, Petit M, Hormaza JI (2013). Polymorphic microsatellite markers in pineapple (Ananas comosus (L.) Merrill). Scientia Horticulturae 156:127-130.
Crossref
|
|
|
|
|
Burhooa K, Ranghoo-Sanmukhiya VM, (2012). Evaluation of Different Pineapple (Ananas comosus Merr L.) Varieties Using Morphological and Genetic Markers in Mauritius. Biotechnology 11:272-279.
Crossref
|
|
|
|
|
Charlotte AOA, Gbènato A-DE, Clément A (2016). Optimizing genomic DNA isolation in pineapple (Ananas comosus L.). Journal of Plant Breeding and Genetics 04(01):11-18
|
|
|
|
|
Coveca CA (2002). Comision veracruzana de comercializacion agropecuaria. Gobiernodel Estado de Veracruz, México (In Spanish).
|
|
|
|
|
Dallakyan MV, Yesoyan SS, Harutyunyan FA, Melyan GH, Yesayan AH, Hovhannisyan NA (2013). Application of Microsatellite Markers for Varietal Identification Grape Rootstocks: Preliminary Analysis. Biology Journal of Armenia 3 (65).
|
|
|
|
|
d'Eeckenbrugge G, Leal F, Duval MF (1997). Germplasm resources of pineapple. Horticulture Review 21:133-175.
Crossref
|
|
|
|
|
Feng S, Tong H, Chen Y, Wang J, Chen Y, Sun G, He J, Wu Y (2013).
|
|
|
|
|
Development of Pineapple Microsatellite Markers and Germplasm Genetic Diversity Analysis. BioMed Research Interanational, 2013.
Crossref
|
|
|
|
|
Food and Agriculture Organization of the United Nations (FAO) (2018). Statistical databases. United NationsThe Daily Records: World top ten largest pineapple producing countries in the world. Available at
View (accessed January 15, 2018).
|
|
|
|
|
Food and Agriculture Organization of the United Nations (FAO) (2016). Pineapples, area harvested (hectare) - for all countries.Available at
View (Accessed in January 15, 2018).
|
|
|
|
|
Han B, Wang C, Tang Z, Ren Y, Li Y, Zhang D, Dong Y, Zhao X (2015). Genome-Wide Analysis of Microsatellite Markers Based on Sequenced Database in Chinese Spring Wheat (Triticum aestivum L.). PLoS ONE 10(11): e0141540.
Crossref
|
|
|
|
|
Hidayat T, Abdullah FI, Kuppusamy C, Samad AA, Wagiran A (2012). Molecular identification of Malaysian pineapple cultivar based on internal transcribed spacer region. APCBEE Procedia 4:146–151.
Crossref
|
|
|
|
|
Kato CY, Nagai C, Moore PH, Zee F, Kim M, Steiger D, Ming R (2004). Intra-specific DNA polymorphism in pineapple (Ananas comosus (L.) Merr.) assessed by AFLP markers. Genetic Resources and Crop Evolution 51:815-825.
Crossref
|
|
|
|
|
Kroupin PY, Divashuk MG, Fesenko IA, Karlov GI (2013). Evaluating Wheat Microsatellite Markers for the Use in Genetic Analysis of Thinopyrum, Dasypyrum, and Pseudoroegneria Species. Dataset Papers in Biology 2013 (2013) doi.org/10.7167/2013/949637
Crossref
|
|
|
|
|
Leal F, d'Eeckenbrugge G (1996). Pineapple. In: Janick J, Moore JN (eds.) Fruit Breeding, vol I: Tree and Tropical Fruits. John Wiley & Sons, London, pp. 515–557.
|
|
|
|
|
Miah G, Rafii MY, Ismail MR., Puteh AB, Rahim H A, Islam KN, Latif MA (2013). A Review of Microsatellite Markers and Their Applications in Rice Breeding Programs to Improve Blast Disease Resistance. International Journal of Molecular Science 14(11):22499-22528. Peakall R, Smouse PE (2012). GenAlEx 6.5: genetic analysis in Excel. Population genetic software for teaching and research—an update. Bioinformatics 28(19):2537-2539.
|
|
|
|
|
Salimi H, Bahar M, Mirlohi A, Talebi M (2016). Assessment of the Genetic Diversity Among Potato Cultivars from Different Geographical Areas Using the Genomic and EST Microsatellites. Iran Journal of Biotechnology 14(4):270-277.
Crossref
|
|
|
|
|
Shoda M, Urasaki N, Sakiyama S, Terakami S, Hosaka F, Shigeta N, Nishitani C, Yamamoto Y (2012). DNA profiling of pineapple cultivars in Japan discriminated by SSR markers. Breeding Science 62:352–359.
Crossref
|
|
|
|
|
Sorkheh K, Dehkordi MK, Ercisli S, Hegedus A, Halász J (2017). Comparison of traditional and new generation DNA markers declares high genetic diversity and differentiated population structure of wild almond species. Scientific Reports 7:5966
Crossref
|
|
|
|
|
Sripaoraya S, Marchant R, Power JB, Davey MR (2001). Herbicide-tolerant transgenic pineapple (Ananas comosus) produced by microprojectile bombardment. Annal of Botany 88:597-603.
Crossref
|
|
|
|
|
Van Treuren R, Kemp H, Ernsting G, Jongejans B, Houtman H, Visser L (2010). Microsatellite genotyping of apple (Malus × domestica Borkh.) genetic resources in the Netherlands: application in collection management and variety identification. Genetic Resources and Crop Evolution 57(6):853-865.
Crossref
|
|
|
|
|
Xie W, Lewis PO, Fan Y, Kuo L, Chen M-H (2011). Improving Marginal Likelihood Estimation for Bayesian Phylogenetic Model Selection. System Biology 60(2):150-160.
Crossref
|
|
|
|
|
Zhang J, Liu J, Ming R (2014). Genomic analyses of the CAM plant pineapple. Journal of Experimental Botany 65:3395-3404.
Crossref
|
|
|
|
|
Zhang L, Yang X, Qi X, Guo C, Jing Z (2017). Characterizing the transcriptome and microsatellite markers for almond (Amygdalus communis L.) using the Illumina sequencing platform. Hereditas 155(1):14.
Crossref
|
|